BTCUSDTHello Traders! 👋
What are your thoughts on BITCOIN?
Bitcoin has once again failed to break above its previous high and entered a corrective phase. The price is now moving within a channel and is approaching the lower boundary of that channel.
The correction is expected to continue toward the support zone and the bottom of the channel, where we may see buying interest and a bullish reaction.
If Bitcoin breaks above the channel resistance and key supply zone, it could trigger a strong upward move and lead to new all-time highs.
Key Note:
Price action near the channel support and demand zone will be crucial. A successful rebound from this area may signal the start of the next bullish leg.
Will Bitcoin hold the channel and bounce higher, or is a deeper correction ahead? Share your thoughts below! 🤔👇
Don’t forget to like and share your thoughts in the comments! ❤️
Beyond Technical Analysis

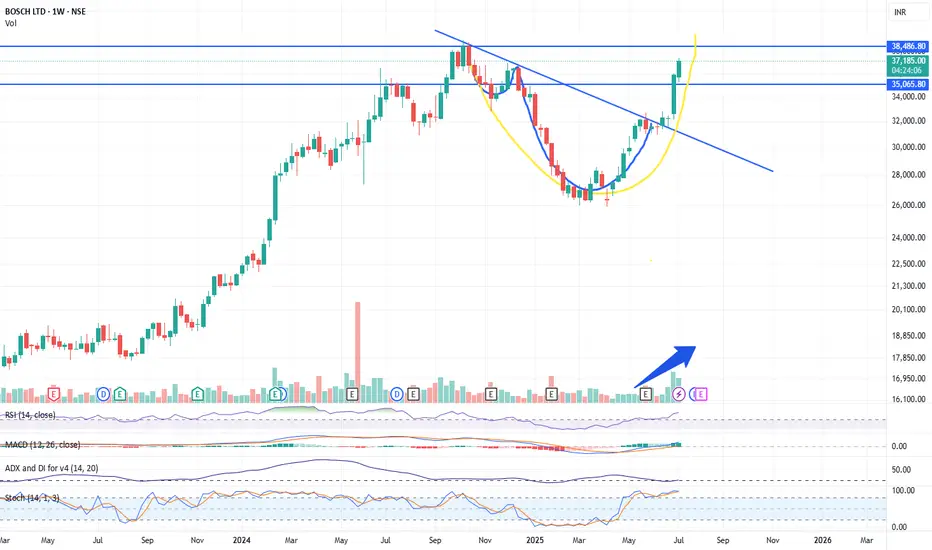
Ye Chart Kuch Kehta Hai - BOSCH LimitedBOSCH Ltd demonstrates a strong bullish setup on the weekly chart, making it a compelling investment for the next few months. The breakout from a cup and handle pattern, supported by volume and momentum indicators, suggests the stock could outperform in the medium term. Consider a 3–6 month investment horizon, with ₹35,000 as a key support and ₹38,500–₹40,000 as the next target zone.
Key Technical Reasons
Cup and Handle Breakout
The chart displays a classic "cup and handle" pattern, a bullish continuation signal. The price has broken out above the handle resistance, suggesting the start of a new upward trend.
Strong Volume Confirmation
The breakout is accompanied by a notable increase in trading volume, which validates the strength of the move and indicates strong buying interest.
Trendline Break
The stock has decisively broken above a long-term descending trendline, signaling a shift from consolidation to a new bullish phase.
Momentum Indicators
RSI (Relative Strength Index): The RSI is above 70, indicating strong bullish momentum. While this can sometimes suggest overbought conditions, in the context of a breakout, it often signals the start of a sustained rally.
MACD: The MACD line is well above the signal line, further confirming bullish momentum.
Stochastic Oscillator: The stochastic is also in the overbought zone, which, during strong trends, can persist for extended periods.
Moving Averages
The price is trading above the 21-week EMA, reinforcing the bullish bias and indicating that the medium-term trend has turned positive.
Clear Resistance and Target Levels
The breakout level near ₹35,065 now acts as a strong support.
The next major resistance and potential target is around ₹38,486, as marked on the chart.
Suggested Investment Time Frame
Medium-Term (3–6 Months):
Given the strength of the breakout and supporting indicators, BOSCH Ltd is well-positioned for further gains over the next 3 to 6 months. The technical pattern suggests a medium-term rally towards the ₹38,500–₹40,000 zone, provided broader market conditions remain supportive.
BTC & ALTCOINS, 4 charts in favor of the bull runIn the columns of TradingView, we have regularly offered you technical and fundamental monitoring of the fundamental uptrend in the bitcoin price. The latter has been supported by its positive correlation with the equity market (new all-time high for the S&P 500 and new all-time high for the MSCI World index for the global equity market), its negative correlation with the trend in the US dollar (DXY) and market interest rates, and finally its positive correlation with the trend in M2 global liquidity. On this subject of global M2 liquidity and BTC, I invite you to reread the analysis below by clicking on the chart.
Four charts currently favor a continuation of the uptrend in the bitcoin price, as well as in altcoins if and only if favorable signals of relative strength are given.
1) Bullish resolution of a bullish flag pattern on the daily BTC price
The chart below shows the daily Japanese candlestick pattern on the bitcoin price. The market has achieved a technical breakout of a bull flag configuration, a technical pattern found in the list of bullish continuation formations. The technical target for this pattern is $125/130K, and the bullish invalidation threshold is below support at $105K.
2) Cycle repetition on a calendar basis from the last year of the bull run
Bitcoin's bullish cycle linked to the spring 2024 halving ends at the end of 2025. When comparing cycles, it's interesting to note that from the end of July onwards, there's a bullish technical confluence of the three previous cycles for their fourth and final cycle year (Bitcoin follows a 4-year cycle as a reminder, structured around the four-year halving). If our current cycle aligns with the average of past cycles, then the price of bitcoin could trend towards US$150,000 by the end of 2025.
3) Bitcoin's dominance chart is validating a bearish divergence in weekly data
This is a long-awaited signal from the crypto investment community, namely the day when bitcoin's dominance will recede to make way for better relative behavior from altcoins. It's a phenomenon known as “altcoin season”, and it will come about if, and only if, BTC's dominance gives a downward reversal signal. That's why we need to keep a close eye on this potential bearish divergence on BTC dominance.
4) ALTCOINS: there's a potential bullish divergence on the ratio between altcoins (represented by the TOTAL3 index) and BTC
But it's the altcoins/bitcoin ratio that's the best barometer for seeing a potential altcoin season coming. This ratio is embodied here by the TOTAL3/BTC ratio, and a potential bullish divergence is forming. Should this ratio confirm it by breaking through technical resistance, this would signal the start of the altcoin season.
DISCLAIMER:
This content is intended for individuals who are familiar with financial markets and instruments and is for information purposes only. The presented idea (including market commentary, market data and observations) is not a work product of any research department of Swissquote or its affiliates. This material is intended to highlight market action and does not constitute investment, legal or tax advice. If you are a retail investor or lack experience in trading complex financial products, it is advisable to seek professional advice from licensed advisor before making any financial decisions.
This content is not intended to manipulate the market or encourage any specific financial behavior.
Swissquote makes no representation or warranty as to the quality, completeness, accuracy, comprehensiveness or non-infringement of such content. The views expressed are those of the consultant and are provided for educational purposes only. Any information provided relating to a product or market should not be construed as recommending an investment strategy or transaction. Past performance is not a guarantee of future results.
Swissquote and its employees and representatives shall in no event be held liable for any damages or losses arising directly or indirectly from decisions made on the basis of this content.
The use of any third-party brands or trademarks is for information only and does not imply endorsement by Swissquote, or that the trademark owner has authorised Swissquote to promote its products or services.
Swissquote is the marketing brand for the activities of Swissquote Bank Ltd (Switzerland) regulated by FINMA, Swissquote Capital Markets Limited regulated by CySEC (Cyprus), Swissquote Bank Europe SA (Luxembourg) regulated by the CSSF, Swissquote Ltd (UK) regulated by the FCA, Swissquote Financial Services (Malta) Ltd regulated by the Malta Financial Services Authority, Swissquote MEA Ltd. (UAE) regulated by the Dubai Financial Services Authority, Swissquote Pte Ltd (Singapore) regulated by the Monetary Authority of Singapore, Swissquote Asia Limited (Hong Kong) licensed by the Hong Kong Securities and Futures Commission (SFC) and Swissquote South Africa (Pty) Ltd supervised by the FSCA.
Products and services of Swissquote are only intended for those permitted to receive them under local law.
All investments carry a degree of risk. The risk of loss in trading or holding financial instruments can be substantial. The value of financial instruments, including but not limited to stocks, bonds, cryptocurrencies, and other assets, can fluctuate both upwards and downwards. There is a significant risk of financial loss when buying, selling, holding, staking, or investing in these instruments. SQBE makes no recommendations regarding any specific investment, transaction, or the use of any particular investment strategy.
CFDs are complex instruments and come with a high risk of losing money rapidly due to leverage. The vast majority of retail client accounts suffer capital losses when trading in CFDs. You should consider whether you understand how CFDs work and whether you can afford to take the high risk of losing your money.
Digital Assets are unregulated in most countries and consumer protection rules may not apply. As highly volatile speculative investments, Digital Assets are not suitable for investors without a high-risk tolerance. Make sure you understand each Digital Asset before you trade.
Cryptocurrencies are not considered legal tender in some jurisdictions and are subject to regulatory uncertainties.
The use of Internet-based systems can involve high risks, including, but not limited to, fraud, cyber-attacks, network and communication failures, as well as identity theft and phishing attacks related to crypto-assets.

Bulish on Link The trend line weakly broke strong. Also on RSI. Also de MACD is pointing up. And also … everything else is aligning.
Hope this time is the one.

Ye chart kuch ketha hai - ACME SolarThe combination of a strong uptrend, bullish momentum indicators (RSI, ROC, Supertrend), price action above key moving averages, and positive analyst sentiment all point to a bullish outlook for Acme Solar over the next few months. These technical factors suggest that the stock is likely to continue its upward trajectory unless there is a significant reversal in trend or broader market conditions
Key Bullish Signals from Weekly Chart
Strong Uptrend and Momentum
The weekly chart of Acme Solar shows a sustained uptrend, with the stock delivering positive returns over the last 12 weeks and a 3-month gain of over 49%. This persistent upward movement is a classic sign of bullish momentum.
Technical Indicators Supporting Bullishness
RSI (Relative Strength Index): The weekly RSI is at 74.20, which is in the bullish-to-overbought zone. While high, this level often accompanies strong trends and suggests buyers are in control.
ROC (Rate of Change): The ROC stands at 18.71, indicating strong positive momentum and continued buying interest.
Supertrend: The Supertrend indicator is well above the current price, reinforcing the ongoing bullish trend.
MACD: The MACD is at 0, which is neutral, but other momentum indicators are positive, supporting the bullish outlook.
Stochastic Oscillator: At 45.59, this is in the neutral-to-bullish range, suggesting there is still room for further upside before overbought conditions dominate.
Moving Averages
The stock price is trading above key moving averages (such as 50 DMA and 200 DMA), which is a strong bullish signal and indicates that the medium- to long-term trend remains positive.
Analyst Sentiment
Multiple analysts have issued strong buy recommendations recently, with price targets above current levels, reflecting positive sentiment for the coming months.

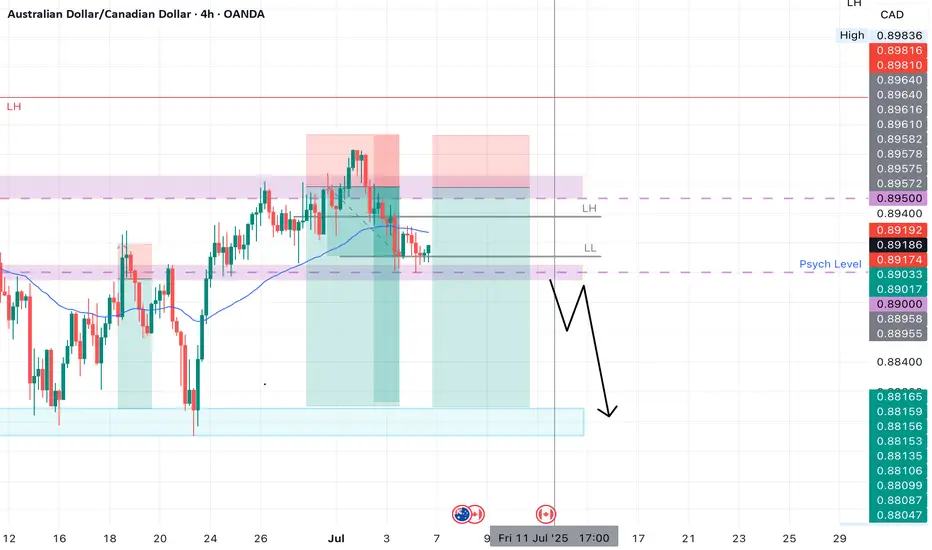
AUDCAD SHORT Potential retest of the same level as last week;
Entry at both Daily and Weekly AOi
Weekly Rejection At AOi
Previous Weekly Structure Point
Weekly EMA retest
Daily Rejection at AOi
Previous Structure point Daily
Around Psychological Level 0.89500
H4 Candlestick rejection
Levels 4.17
Entry 95%
REMEMBER : Trading is a Game Of Probability
: Manage Your Risk
: Be Patient
: Every Moment Is Unique
: Rinse, Wash, Repeat!
: Christ is King.
Everybody loves Gold Part 7Great trading last week. Gold really pushing deep into blues.
This week takes a downturn with possibilities highlighted on the chart; all pointing towards LOS (Level of significance). This level is calculated based on previous week high-low values.
Trade parameters:
1. SL: 50-100pips
2. TP: 3-4x SL
3. double tops/bottom (around LOS) are direction changers.
As always price action determines trades

GBP USD SHORT RESULT Trend was still overall bearish and ongoing a minor pullback to continue downward movement also formed an ascending wedge pattern on the pullback which is also a strong indicator of bearish movement.
With all the conflunce above is why I took the short and it moved perfectly as predicted 🔥💪👌🎯
_THE_KLASSIC_TRADER_.🔥

Gold – July 11 | H4 & M15 Aligned, Higher Highs in Sight🟡 Gold – Higher Highs in Sight | July 11 Analysis
As outlined in our July 10 analysis
( Gold – H4 OB Held, BoS Confirmed ),
price retested the 3313–3310.5 POI and continued upward in alignment with the broader bullish structure.
Gold is now trading around 3330–3335 , and both H4 and M15 remain in clear uptrends — forming a consistent sequence of higher highs and higher lows .
This post is intended purely for educational and structural observation —
not as trading advice or encouragement to enter trades.
Please use your own strategy, confirmation methods, and risk assessment before taking any action.
🔄 Structure Alignment
✅ H4: Bullish continuation
✅ M15: Trend aligned, forming HH–HL structure
🟢 Bias: Long-only setups (based on structure)
🔍 Key Supply & POI Zones
📌 3345–3346:
→ Strong supply zone
→ If price breaks above, we expect a new higher high
📍 If retracement occurs before breaking 3346:
→ Watch 3319.5–3321.5 (M15 POI)
→ Valid only if respected with M1 confirmation (ChoCh + BoS)
🎯 Trade Plan (Educational Observation)
🛑 No shorts — structure does not support counter-trading
🕒 Monitor: For price to revisit the 3319.5–3321.5 zone
✅ If respected + M1 confirms → structure favors long
🎯 Target: Move above 3346 , continuing the bullish sequence
🧠 Final Thoughts
Price structure remains in strong alignment — but the key is confirmation, not prediction.
Wait, observe, and only act within your own defined process.
📖 Trade the structure, not the emotion.
When the trend aligns, hesitation costs more than waiting.
📘 Shared by @ChartIsMirror

BTC Peak forecastedHI,
This is the weekly candle on BTC… showing in orange, a likely topping fractal, which would also likely propagate into something more like the dark orange, as we seek historic resistance levels to test for support.
As an interesting side note… i see DOGE coin as showing increasing strong bullish signals, which could indicate we are in the much prophecized decoupling of the DOGE-BTC pair… which will be a spectacular transfer of wealth from the dying giant to the intrepid coin of unconditional love! Thats what Dog’s represent… and it’s how the tribe feels about their coin too.
Biggest pump and dump of all time… the crypto geeks Pump btc, get the military dark money to buy in, and then dump it… empty bag. And where are they moving their money too? The favorite alt coins… and DOGE moves the biggest and fastest when it jumps and runs!
Good Luck!

GBP USD SHORT RESULT Price is in an overall bearish trend and also created a double top pattern at 4HTF Bearish Trendline and also holding minor resistance Trendline.
With all this Confluence was why I decided to open the Short position at the order block. Price just missing the set entry before rolling down to TP.
Better Set-ups to come 🔥💪
_THE_KLASSIC_TRADER_.

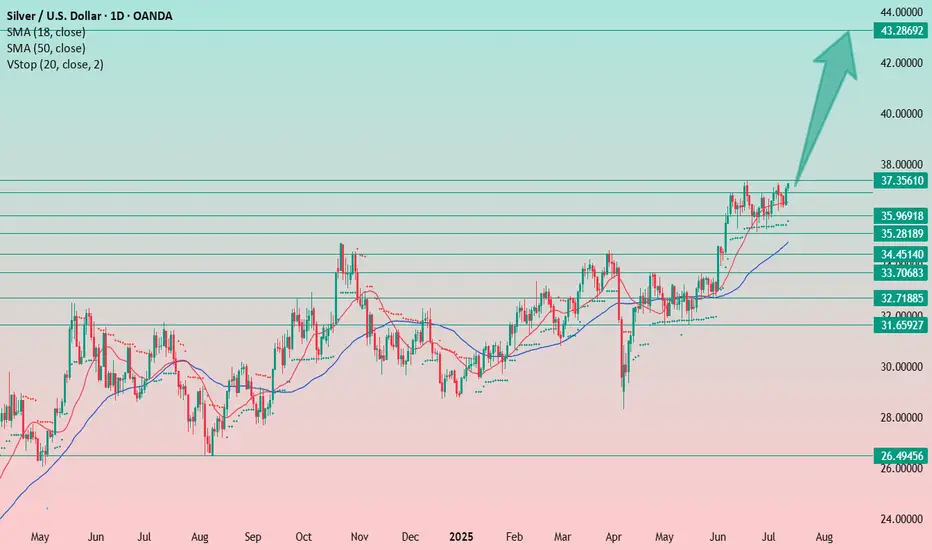
Silver Shows Promising Growth – It’s Not Too Late to JoinSilver is showing a pretty solid upward movement. It’s a harmonious and steady growth. I believe we’re just at the beginning of the trend, so it’s not too late to buy even now.
If you don’t have a position yet, you can still take advantage of this opportunity.
Set your stop-loss just below today’s low — at 36.90.
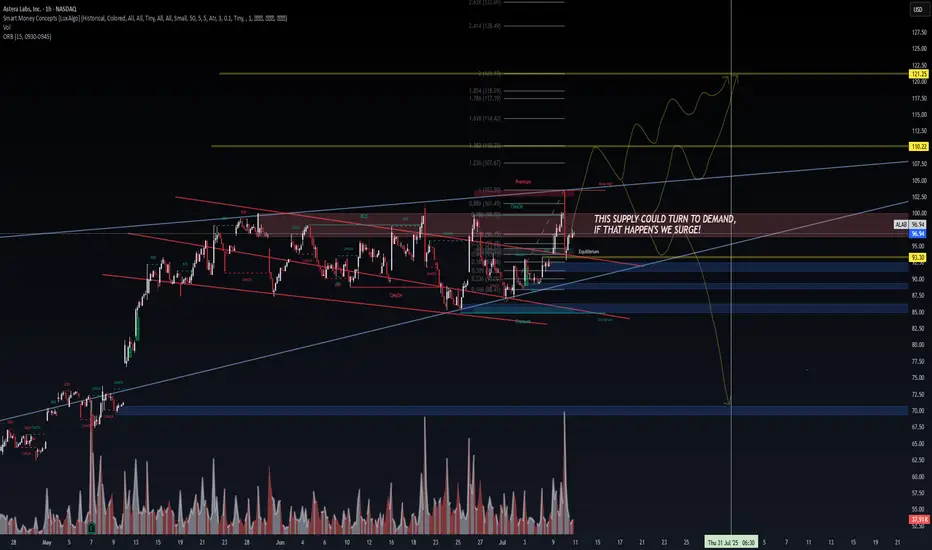
ALAB | Smart Money Compression → Breakout Threat🔭 ALAB | Smart Money Compression → Breakout Threat
Posted by: VolanX Quant Systems | July 10, 2025
We're at a critical inflection point on $ALAB.
The previous supply zone (highlighted in red) is under pressure — one more CHoCH + BOS and it may flip to DEMAND. If that happens, we don’t trickle...
We surge.
🧠 VolanX DSS Notes:
SMC Structure: Multiple CHoCHs + recent BOS confirm internal strength
Volume spike confirms interest at this price level
0.886 Fib rejection zone tagged @ ~$101.49
Equilibrium sits near $95 — ideal backtest zone
Bullish path = target range $110.22 → $122.50
Bearish scenario only resumes below $93.30, where supply holds and volume fades
“This supply could turn to demand — if that happens, we surge!”
🛠️ Risk Layering:
Entry: $96.50–$97.00
Risk: Close below $93.30 invalidates thesis
Reward: Multi-leg rally toward golden pocket + extended fibs
📉 If demand fails to hold, expect retracement into deep discount zones between $72–$77.
🧬 LSTM-backed directional bias: UP (70% confidence)
📊 Options flow is light but positive risk sentiment observed
#SmartMoneyConcepts #ALAB #VolanX #OrderBlock #CHoCH #BreakOfStructure #QuantTrading #SupplyDemand #FibonacciLevels #LSTM #LiquidityZones #WaveAnalysis #TradingView #InstitutionalFlow #DSS
Stablecoins, a huge piece of cake to be distributedThe core of stablecoins lies in payment and opening up channels for sovereign currencies to communicate with the US dollar. In other words, whoever can gain an advantage in the field of payment and exchange in the future will be the biggest winner.
CIRCLE has the advantage of first-mover speculation, which is why NYSE:CRCL can soar 300%+ in the secondary market, but the current profit model of USDC is basically only the US dollar interest. In the future, the income will shrink significantly after the Fed cuts interest rates. The market will start to think after calming down.
Market transactions are always based on expectations, not the present. Can USDC dominate the world in the future? I don’t think so. The first obstacle is USDT, which goes without saying. Second, as the entrance to traffic, Binance and TRX have already stood on the side of Trump’s family’s USD1. Grabbing the market through political power is at least very effective during Trump’s term. Third, many sovereign countries around the world are also issuing stablecoins anchored to the US dollar. It is unknown who will win.
If it is short-term speculation, then any target can be traded. For value investment, CRCL faces many challenges and needs to take one step at a time. Heavy gambling is not my trading style.
I will add more views on stablecoins later.

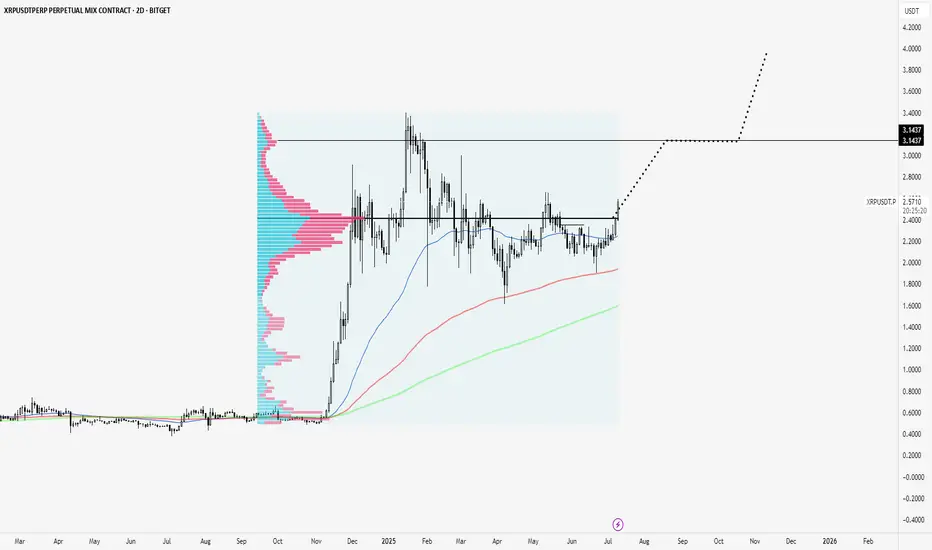
XRP clears Point of Control to test highs.XRP is breaking out of a consolidation zone and above a volume point of control that has been massive since its November rally onward.
Looks like next node is to $3.14
Super strong coin.
Ripple testimony in banking committee yesterday was bullish. Ripple partnering with BNY Melon yesterday was bullish. Ripple leading regulation standards with their XRP case is bullish. Ripple winning the status of XRP as one of a kind is bullish. Ripple getting a bank charter and fed master account is bullish.
Not much is close to XRP fundamentally.
Sell idea!Market returned from a WA and it is time to react to an Special LOZ. let see what happened(wink)

EUR/USD Holding the Line: Bullish Channel Setup!Hi traders! Analyzing EUR/USD on the 30-min timeframe, price is currently reacting near the bottom of a well-defined ascending channel, signaling a potential bullish continuation within the trend:
🔹 Entry: 1.17071
🔹 Take Profit: 1.17423
🔹 Stop Loss: 1.16825
After a corrective move downwards, price tapped into a key trendline support, aligning with prior structure and psychological level near 1.1700. The RSI is showing a bullish divergence near oversold levels, adding confluence to a possible reversal.
As long as price holds above the lower boundary of the channel, bulls may look to target the mid-to-upper region of the range, aligning with previous highs and dynamic resistance.
🟢 The trend remains intact as long as higher lows are respected.
⚠️ DISCLAIMER: This is not financial advice. Every trader is responsible for managing their own risk and strategy.

GBP/USD Outlook: Can Buyers Step Back In?Hi everyone,
GBP/USD continues to consolidate below the 1.36200 level, with multiple failed attempts to break higher confirming this area as firm resistance for now. Following the rejection, price moved lower into the 1.35300–1.34600 demand zone, where we’re watching closely for signs of renewed buying interest.
This area has previously acted as a support base, and a reaction here could set the stage for another push higher. However, if buyers fail to step in, there is scope for a deeper retracement before the next attempt to reclaim resistance. We’ll be monitoring the price action closely to see which scenario plays out.
A drop into this area was highlighted as the more probable short‑term path, and we’re now looking for GBP/USD to find support in this region; and more importantly, to hold above the 1.33800 level to form the base for another push higher.
As previously noted, a decisive break above 1.37500 would renew our expectation for further upside, with the next key target around 1.38400. We'll be monitoring price action closely to see how it unfolds.
We’ll continue to provide updates on the projected path for GBP/USD as price approaches this target.
The longer-term outlook remains bullish, and we expect the rally to continue extending further from the 1.20991 January low towards 1.40000 and 1.417000.
We’ll be keeping you updated throughout the week with how we’re managing our active ideas. Thanks again for all the likes/boosts, comments and follows — we appreciate the support!
All the best for the week ahead. Trade safe.
BluetonaFX

EUR/USD Testing Support — Will Buyers Step In Again?Hi Everyone,
Since our last update, EUR/USD is currently testing the 1.16680 support level. We’re watching for buying interest to emerge above the key 1.16450 zone; if price can stabilise here, we could see a retest of the highlighted resistance area around 1.17450.
Our broader outlook remains unchanged: as long as price holds above 1.16450, we continue to look for the pair to build momentum for another move higher in the coming sessions. A decisive break above last week’s high could attract fresh buying interest, paving the way for a push towards the 1.19290 area and ultimately 1.20000.
We'll be watching closely to see if this recovery gains traction and whether buyers can sustain the move above resistance. The longer-term view remains bullish, provided price continues to respect the key support zone.
We’ll keep updating you through the week as the structure unfolds and share how we’re managing our active positions.
Thanks again for all the likes/boosts, comments and follows — we really appreciate the support!
All the best for the rest of the week. Trade safe.
BluetonaFX

AMP Futures - How to export data from your Trading PanelIn this idea, we will demonstrate how to export data from your Trading Panel using the TradingView platform.
Unfortunately, the recording did not show the demonstration of the exported CSV files; however, as long as you follow the steps provided, you will be able to export the proper data.

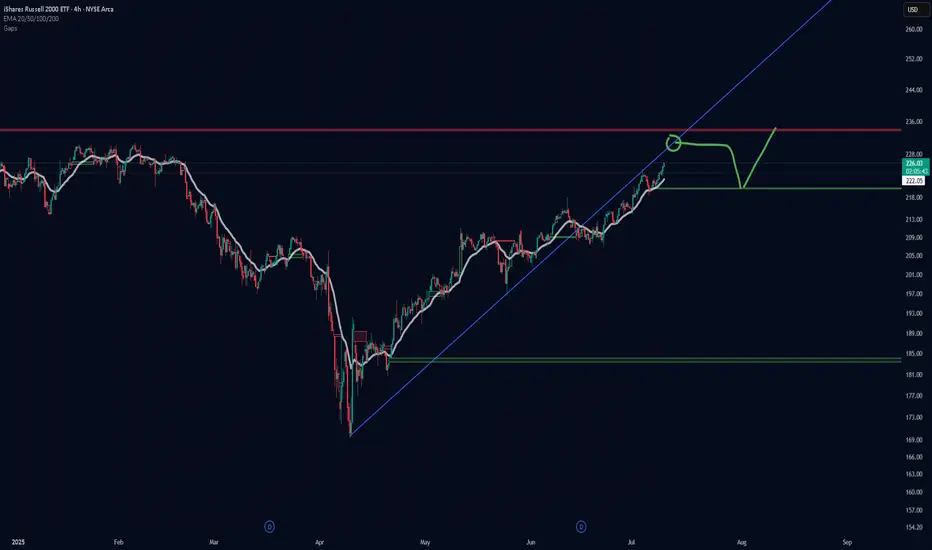
IWM projected pathI have three rooms full of supercomputers and then a few laptops in a spare bathroom plus a refrigerator in my wife's cardboard box running simulations 24/7 about the projected path of the Russell. Based on their findings I have determined that our previous support is now the resistance. When we come into contact with this resistance we will begin to work our way back down to fill the gap before continuing up to achieve a new all time high. When we hit resistance I have prophesized that will go mostly sideways for a numbers of days before we drop down to fill the gap. Thank you. Praise the Lord.
BTC — Harmonic Parabolic Scenario 1. Rise to 110–111k by July 4–5
2. Drop into July 9–10
3. Parabolic move after July 10
4. TP: ATH+
5. Stop: scenario invalid if no breakout

Guys dont sell !!!It needs to go up and its, being pushed by big whales stock piling large amounts of cash.
So let it keep going. Ride it. Never sell. It will never be the same. This is the new era of ETH.
If you all go on too late for BTC, now is your chance to get on ETH and be part of the base.
It's going to recover big time. It is the best mainnet out there stable, and very versatile. It's starting to get traction more and more for its stable trajectory in the past five years.
Start loading up the truck guys.
