Using 1 min time frame for entries on VX algo & day tradingwhat time frames do you use to confirm entries outside of a buy signal?
If I am day trading, I will mainly use the 1 minute time frame to look for moving average support and resistance, and read the candle stick patterns as well from that chart.
However, there are times I'll switch to a 5 minute a
Related futures

DIYWallSt Trade Journal: How I Navigated Powell Firing Rumors & 07/16/25 Trade Journal, and ES_F Stock Market analysis
EOD accountability report: +428.75
Sleep: 7 hours
Overall health: Good
VX Algo System Signals from (9:30am to 2pm)
— 4:17 AM Market Structure flipped bullish
— 9:50 AM Market Structure flipped bearish
— 12:00 PM VXAlgo NQ X3 Buy Signal
—

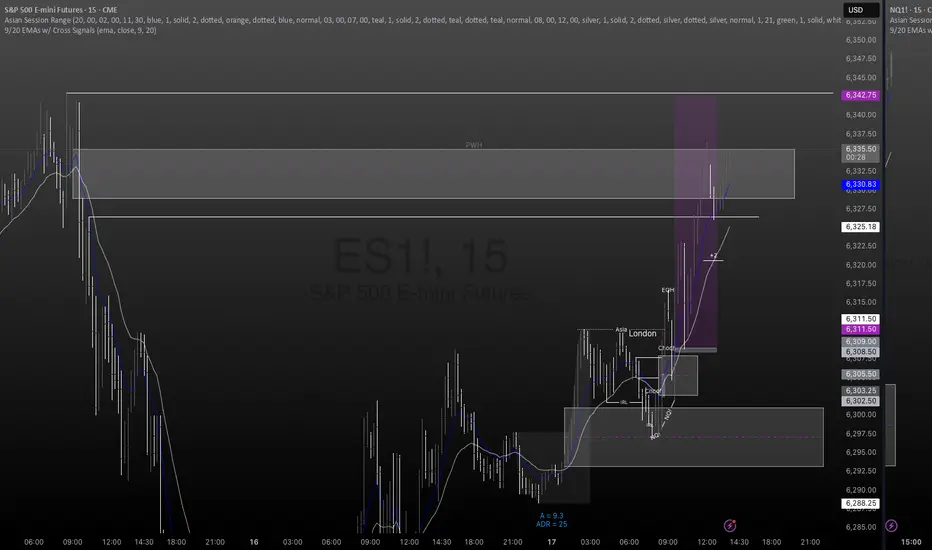
ES! Longs 7RRCRT for Bullish Daily bias
9.30 Sweep on NQ, ES failed to take lows but reacted from 15m FVG
Targets Daily CRT candle high for 7RR clean trade
Tap In!!
#EUBOOGIE
Trade Journal: Missed Morning Move & Trading Into New Highs07/17/25 Trade Journal, and ES_F Stock Market analysis
EOD accountability report: +447.50
Sleep: 5 hours
Overall health: My health ring is signaling that my body isn't well the last few days.
VX Algo System Signals from (9:30am to 2pm)
— 8:53 AM Market Structure flipped bullish on VX Algo X3!

DIYWallSt Trade Journal: Missed Entry & Climbing Back From Loss **07/11/25 Trade Journal, and ES_F Stock Market analysis **
EOD accountability report: -46.25
Sleep: 5 hours
Overall health: Good
** VX Algo System Signals from (9:30am to 2pm) 3/3 success**
— 9:41 AM Market Structure flipped bearish on VX Algo X3!
— 10:15 AM VXAlgo ES X7 Buy signal,
— 1

TACO about to become TUFTThe acronym "TACO" has been adopted as a market slogan to explain the shocking volatility brought on by Trump's follow through with his campaign promises to enact and/or adjust tariff's in the USA on its trading partners around the world. The mere mention resulted in a 1,334 point sell-of culminati


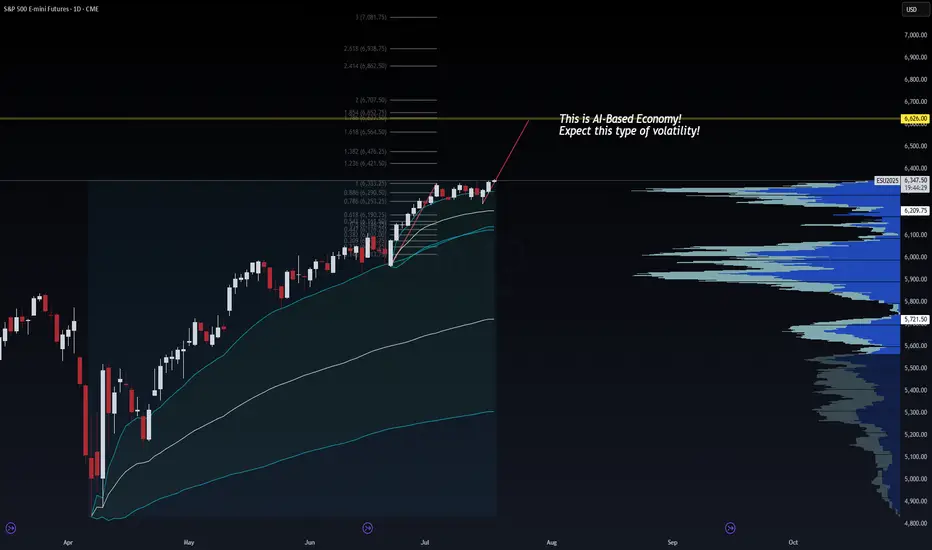
AI Economy Surge: ES Heading to 6626? | VolanX Protocol in Actio🧠 AI Economy Surge: ES Heading to 6626? | VolanX Protocol in Action
📅 Date: July 17, 2025
📈 Instrument: ESU2025 – S&P 500 E-mini Futures
🔍 Timeframe: Daily
🔗 Powered by: WaverVanir DSS | VolanX Protocol
🌐 Macro Backdrop:
📉 Fed on Pause: Market pricing implies a 70% probability of a rate cut in Se
Positioning itselfThe structure in the S&P 500 daily chart implies a market with a bias to the upside positioning itself for the release of fundamental information this week.

Are We Completing the Larger Ending Diagonal Now?The last time I updated followers of my work; I stated that the pattern was advancing, but NOT with confidence, and that it is marked with choppy, overlapping price action that appears to be an ending diagonal. Those sentiments have not changed.
However, what has changed is I was forecasting a mo

See all ideas
Summarizing what the indicators are suggesting.
Neutral
SellBuy
Strong sellStrong buy
Strong sellSellNeutralBuyStrong buy
Neutral
SellBuy
Strong sellStrong buy
Strong sellSellNeutralBuyStrong buy
Neutral
SellBuy
Strong sellStrong buy
Strong sellSellNeutralBuyStrong buy
A representation of what an asset is worth today and what the market thinks it will be worth in the future.
Displays a symbol's price movements over previous years to identify recurring trends.
Frequently Asked Questions
The current price of Micro E-mini S&P 500 Index Futures (Sep 2025) is 6,334.75 USD — it has risen 0.21% in the past 24 hours. Watch Micro E-mini S&P 500 Index Futures (Sep 2025) price in more detail on the chart.
The volume of Micro E-mini S&P 500 Index Futures (Sep 2025) is 758.85 K. Track more important stats on the Micro E-mini S&P 500 Index Futures (Sep 2025) chart.
The nearest expiration date for Micro E-mini S&P 500 Index Futures (Sep 2025) is Sep 19, 2025.
Traders prefer to sell futures contracts when they've already made money on the investment, but still have plenty of time left before the expiration date. Thus, many consider it a good option to sell Micro E-mini S&P 500 Index Futures (Sep 2025) before Sep 19, 2025.
Open interest is the number of contracts held by traders in active positions — they're not closed or expired. For Micro E-mini S&P 500 Index Futures (Sep 2025) this number is 182.51 K. You can use it to track a prevailing market trend and adjust your own strategy: declining open interest for Micro E-mini S&P 500 Index Futures (Sep 2025) shows that traders are closing their positions, which means a weakening trend.
Buying or selling futures contracts depends on many factors: season, underlying commodity, your own trading strategy. So mostly it's up to you, but if you look for some certain calculations to take into account, you can study technical analysis for Micro E-mini S&P 500 Index Futures (Sep 2025). Today its technical rating is buy, but remember that market conditions change all the time, so it's always crucial to do your own research. See more of Micro E-mini S&P 500 Index Futures (Sep 2025) technicals for a more comprehensive analysis.