SPY Approaches Gamma Wall-TA for July 10SPY Approaches Gamma Wall: Key Zones to Watch for Tomorrow’s Trade 🔥
GEX Options Sentiment Analysis:
SPY is currently hovering just below the major GEX resistance zone around 624–626, where the highest positive GEX and gamma wall overlap with strong call walls (52.17% and 41.33%). This region has historically capped upside momentum, so traders should prepare for potential rejection or breakout scenarios.
Downside has modest protection around 620 (HVL level), with negative GEX zones building near 619–617, marking a weak PUT wall. The lack of deep PUT dominance signals limited downside hedging pressure.
* IVR: 8.9 (low), IVx avg: 13.8
* Options Flow Sentiment: 24.1% PUTs
* GEX Bias: Mildly bullish unless 623 fails
Options Strategy Suggestions:
* If price breaks and holds above 626.5, consider buying CALL spreads (e.g., 626c/630c) targeting a gamma squeeze into 628+.
* If 623 breaks, look for short-dated PUT spreads (e.g., 623p/620p) targeting a fade back into 620 or even 617.
1-Hour Chart Price Action Analysis:
SPY has reclaimed a bullish posture after the CHoCH (Change of Character) on July 8 and is pushing into a supply zone just beneath the prior swing high. The price structure now forms a clean ascending channel, supported by higher lows and rising demand.
* Support Zones: 622.00, 620.34
* Resistance Levels: 624.72, 626.27
* BOS (Break of Structure): Confirmed earlier, adding bullish confluence
Watch for a breakout above the current supply zone to continue momentum toward 628+. However, failure to break and a rejection near 625 could lead to a retest of 620–622 as the next demand zone.
Trading Outlook for Thursday:
* Bullish Case: Break and close above 626 opens the door to a squeeze into 628+. Use pullbacks to 623–624.2 as entry zones.
* Bearish Case: Rejection at current levels with a breakdown below 622.5 could pull SPY into the 620.3 and possibly 617.9 levels.
* Scalp Setup: Long above 625 with tight stop below 623. Short below 622.5 targeting 620, risk above 624.
This analysis is for educational purposes only and does not constitute financial advice. Always manage risk and follow your own plan.
Beyond Technical Analysis


TSLA Caught in Tug-of-War-TA for July 10TSLA Caught in Tug-of-War: Key Gamma & Price Action Setups Unfolding ⚠️
🔍 GEX (Gamma Exposure) Analysis:
Tesla’s options market is highly polarized heading into the week.
* Gamma Walls: Strong Call Wall near $304–$310, showing potential upside magnet if bulls regain control. Above this, the $317.5–$320 zone could trigger a gamma squeeze.
* Put Walls: The $288–$285 zone represents a heavily defended downside, marked by high negative NET GEX and multiple put walls.
* Current GEX Bias: Negative gamma regime persists, increasing potential for volatile moves and sharp directionality.
* IVX is elevated at 61.1, with IVR 17.4, suggesting the options market is pricing in moderate near-term volatility.
📈 Options Trade Ideas:
* Bullish Setup: Consider July 12/July 19 300c–310c debit spread if price confirms reclaim of $300, targeting a gamma squeeze toward $317.5–$320.
* Bearish Setup: If price breaks below $288, buy 285p–275p vertical or 295p straight puts, expecting continuation toward $280 and below.
🕒 1H Price Action Outlook:
Tesla remains stuck in a tight consolidation wedge, showing a battle between supply at $300–304 and demand near $288–290.
* Structure: Market formed a bullish BOS earlier this week but failed to extend higher. The latest CHoCH + rejection from $300 zone suggests sellers are still active.
* Range: Coiling inside a triangle formation with tightening price action. A breakout or breakdown is imminent.
* Demand Zone: The green liquidity block around $284–$288 has held firm so far.
* Trendlines: Price is being compressed between a descending trendline (supply) and ascending trendline (demand), signaling a make-or-break moment.
🎯 Intraday Trade Plan:
* Bullish Case:
* Entry: Above $300 with volume
* Target: $304 → $310 → $317
* Stop: Below $294
* Bearish Case:
* Entry: Breakdown below $288
* Target: $284 → $280
* Stop: Above $295
💭 Final Thoughts:
TSLA is in a pressure cooker. A breakout above $300 opens the door to gamma-driven upside, but continued compression or a loss of $288 support could trigger a fast liquidation. Monitor volume closely — this wedge is near resolution.
This analysis is for educational purposes only and does not constitute financial advice. Always do your own research and manage risk responsibly.

NVDA: Ready for a Gamma Squeeze or Cooling Off? for July 10NVDA: Ready for a Gamma Squeeze or Cooling Off? Here's the Setup You Need 🎯
Options Sentiment (GEX Analysis):
NVDA is trading around $163.35 and sitting just above the Gamma Wall at $162.50, which also marks the highest positive NET GEX zone—a key resistance created by dealer positioning. Above that, the second CALL Wall is stacked near $165, with further resistance layering in toward $170 and $172.50.
Below, there’s a liquidity pocket around $157.50 (HVL zone), and deeper PUT support doesn’t come in until $152.50–$151.00.
* GEX: Bullish leaning (CALLS 2.6% domination, GEX bar fully green)
* IVR: Low at 5.9, and IVx Avg 38 → Options are relatively cheap.
* Sentiment: Leaning bullish with potential for a gamma squeeze if momentum builds above $165.
🟢 Strategy Suggestion:
Consider 160C or 165C weekly calls (with tight spreads) if NVDA holds above $162.50 and breaks through $165 with volume. A gamma squeeze toward $170 is on the table.
Risk-managed PUTs (e.g., 158P) only if price flushes back below $160 support with momentum.
1-Hour Chart Technical Outlook:
NVDA has broken out of the previous range, flipping internal structure bullish. The CHoCH and BOS confirm trend change earlier this week, and the price is now consolidating just under a resistance zone (purple box) near $164.
Support below is layered at:
* $160 (broken resistance, now key support)
* $158.05 (previous structure low)
* $152.00–151.00 (demand zone + GEX support alignment)
Resistance:
* $164.41 (current high)
* $167.50, $170, $172.50 (GEX option walls)
Structure is showing a rising wedge/channel pattern; however, we’re still trending strong with clean higher lows.
🟢 Long Trade Setup (Bullish Continuation):
* Entry: Above $164.50 with breakout confirmation
* Target: $167.50 → $170
* Stop: Below $160 (or tighter below $162.50 based on risk appetite)
🔴 Short Trade Setup (Reversal Scenario):
* Entry: Breakdown below $160 with rejection from $163–$164
* Target: $158 → $152 zone
* Stop: Above $165
My Thoughts:
NVDA is sitting in a key decision zone. As long as it holds above $162.50, bulls have the edge to push this higher into the next GEX walls. Watch for confirmation on $164.50 breakout for continuation. If it fakes out and drops below $160, that would likely trigger a downside flush to $158 or lower.
This analysis is for educational purposes only and does not constitute financial advice. Always do your own research and trade responsibly.

MSTR Heating Up! Options and Intraday Setup Ahead for July/10🔥GEX-Based Options Analysis (Macro Sentiment):
MSTR is showing strong bullish momentum fueled by aggressive options flow. The key GEX levels show:
* Gamma Wall / Max Resistance is at $405–$410, aligning with current price action.
* Positive GEX Flow continues to build up toward $425, where the 3rd CALL Wall sits.
* On the downside, minimal PUT Wall pressure is seen until $390, offering a strong base of support.
💡 Options Setup Ideas:
* Bullish Setup: If MSTR holds above $405–$410 zone, consider a 415C or 420C for 07/12 expiry, targeting a move to $422.50–$425.
* Bearish Reversal Risk: If MSTR breaks back below $400 with volume, risk shifts to downside with $390 PUTs back in play.
IV is still low (IVR 7.4, IVx below average), which supports buying premium over selling.
1H Price Action & Intraday Setup:
On the 1-hour chart, MSTR just broke out of a compression wedge after forming a clean CHoCH and BOS (Change of Character and Break of Structure). Price is now flagging just below the purple supply box, creating a textbook bullish continuation setup.
* Key Levels to Watch:
* Resistance: $414–$416 (if broken, opens room to $422+)
* Support: $404–$408 (recent CHoCH zone and breakout base)
* Deeper Support: $396–$400 (prior structure, invalidation if lost)
📈 Intraday Trade Plan:
* Bullish Scenario:
* Entry: Break and close above $416
* Target: $422.50–$425
* Stop: Below $408
* Pullback Long:
* Entry: Retest of $405 with bullish reaction
* Target: $415+
* Stop: Below $400
* Bearish Reversal (low probability):
* Entry: Breakdown below $400
* Target: $393–$390
* Stop: Above $405
My Thoughts:
MSTR is building strength with both option sentiment and price structure aligning for continuation. It’s one of the cleanest bull flags on the board right now. Keep eyes on the breakout zone at $414–$416 — a push through with volume could trigger a gamma squeeze toward $425.
This analysis is for educational purposes only and not financial advice. Always manage risk before trading.

GOOGL Looks Ready to Reclaim the Channel for July 10GOOGL Looks Ready to Reclaim the Channel – Watch These Key Zones! 📈
🧠 GEX-Based Options Sentiment Insight (20 DTE):
GOOGL shows a strong bullish options bias going into this week, with CALLs comprising 20.3% of flow and a positive Gamma Exposure (GEX) reading. Here's the breakdown:
* Gamma Wall (Resistance): $180–$182.50
* 2nd CALL Wall: $177.50 (69.5%) – key magnet
* Highest Positive NET GEX: $180 – breakout level for upside continuation
* Support Zone: $172.5 (Put Wall -31%)
* PUT Pressure Floor: $170–$167 range (3rd/4th PUT wall cluster)
🔧 Option Strategy Suggestion:
🎯 Bullish setup
* Consider 177.5c or 180c contracts (0DTE or 7/12 expiry) for quick moves if price holds above $175 and breaks $177.50.
* Scalp the range to $179–$180, trail stops near $174.80.
* Aggressive breakout players can aim for $182.50 if volume confirms.
🛑 Bearish hedge
* If price breaks $172.50 with strong volume, consider 170p or 167.5p targeting the lower PUT Wall zone.
* Keep stops tight above $174.96.
📊 1-Hour Chart – Price Action Breakdown
GOOGL recently flipped bullish with a BOS and a solid CHoCH confirmation. Price reclaimed a critical trendline and retested a fair value gap inside the green demand zone.
* Current Price: $176.45
* Key Demand Zone: $172.8–$174.9 (multiple FVG and liquidity sweep confluence)
* CHoCH + BOS combo: Indicates momentum shift
* Supply Zone (Resistance): $177.9–$179.7
* Trendline Breakout Retest Confirmed
🧭 If buyers defend above $174.9–$175, we could see a move toward $179.67 and possibly challenge the $181.96 high. A failure below $173.5 risks a full reversion to the prior range near $170.
🎯 Trading Plan Summary:
* Bullish Scenario:
* Entry: Above $177.50
* Target: $179.67 → $182
* Stop Loss: Below $174.96
* Bearish Scenario:
* Entry: Below $172.50
* Target: $170 → $167.5
* Stop Loss: Above $175.10
This analysis is for educational purposes only and does not constitute financial advice. Always do your own research and manage risk accordingly.

Daily Analysis- XAUUSD (Wednesday, 9th July 2024)Bias: Bullish
USD News(Red Folder):
-Unemployment Claims
Notes:
- Daily no bottom wick form yet
- Waiting for liquidity grab and
retest 0.236 fib level
- Potential BUY if there's
confirmation on lower timeframe
- Pivot point: 3280
Disclaimer:
This analysis is from a personal point of view, always conduct on your own research before making any trading decisions as the analysis do not guarantee complete accuracy.

MSFT Charging Toward Resistance for July 10MSFT Charging Toward Resistance — What the Gamma Map Reveals for This Week’s Trading
🔍 GEX Analysis – Options Sentiment Outlook
MSFT’s current positioning reveals a relatively neutral options sentiment with slight bullish bias:
* GEX at $507.12 marks the highest positive gamma exposure and major resistance. It's also aligned with the 3rd CALL Wall and the Gamma Wall, making this level a magnet and a potential stall zone.
* Beneath price, multiple PUT walls form strong support between $487 and $490, with the final PUT Support down at $485.
* The HVL (High Volume Level) sits at $492.55, which now serves as an intraday support pivot.
* IVR is low at 21.6 and IVx avg is 22.2, showing little fear or demand for expensive protection, suggesting a stable grind rather than explosive moves.
📌 Options Strategy Suggestion:
* Bullish Setup: Use $500–$510 Call Spread (July 12 expiry) targeting the gamma wall at $507+. Entry is favorable as long as MSFT holds above $498.
* Neutral Setup: Consider Iron Condor between $490–$510 if price consolidates below $507.
📉 1H Technical Chart Insights
* MSFT recently confirmed a BOS (Break of Structure) after rejecting from the previous supply zone, now attempting to build a bullish continuation flag.
* A new demand zone has formed around $498–$500, which aligns with the GEX 2nd CALL Wall and short-term trendline support.
* Price is consolidating under the purple supply box, and a clean break over $503.50 could trigger a momentum run toward $507.12.
* Structure still holds a bullish bias as long as MSFT remains above the $496–$498 confluence zone, supported by prior CHoCH, trendline, and OB zones.
🧭 Trading Outlook
* Bullish Scenario: Break and hold above $503.50 could trigger a fast move toward $507–$510. Ideal entry: $502.50–$503. Stop-loss: Below $498. Target: $507.
* Bearish Rejection: If MSFT rejects at $503.50 and breaks below $498, it may revisit the demand zone at $492. Ideal PUT entry: break below $496. Target: $490.
Conclusion:
MSFT is sitting just under heavy gamma resistance with demand stacked below. Traders can prepare for a breakout continuation toward $507+ or a fade from resistance into $498–$492 support zone. Use options spreads or short-term directional plays based on the breakout or rejection setup.
This analysis is for educational purposes only and does not constitute financial advice. Always manage risk and confirm your setups before entering trades.

PLTR Poised for Gamma Squeeze? Here's the Key Setup-July 10📈 GEX Options Sentiment & Trade Strategy
Palantir (PLTR) is pressing into a high-compression zone on the Gamma Exposure (GEX) chart, where multiple call walls cluster between 143 → 146, with the strongest net positive GEX wall at 146, acting as the gamma squeeze ceiling. The 3rd call wall sits at ~145, and momentum is building with IVR 40.6, IVx avg 61.3, and a strong 40.8% bullish call-dollar dominance, signaling sustained call flow.
Crucially, there’s minimal put protection above current price, with most put walls far below at 130, 127, and a weak HVL at 133. This imbalance opens room for a potential gamma push toward 145–146, especially if the 143.17 intraday high breaks with volume.
💡 Options Trade Ideas:
* Bullish Setup:
145C (0DTE or 7/12 expiry) if price confirms over 143.50, targeting the 145–146 zone.
Ideal for a short squeeze continuation with trailing stops.
* Hedge/Defensive PUT:
135P if price rejects sharply at 143.50 and loses 140.5 support—risk-managed fade toward HVL at 134.
🔍 1H Chart Technical Outlook
PLTR is moving inside a rising wedge channel, maintaining a strong bullish market structure with back-to-back CHoCH → BOS confirming bullish intent. Price is consolidating under the supply zone near 143–144, coiled for a breakout attempt. The trendline holds firm, and volume is beginning to expand with each retest.
If price breaks and holds above 143.20, bulls can target 146, and even higher toward the channel resistance near 148.21. However, caution: a false breakout here could trap late bulls, so monitor for retest confirmation before chasing.
Support to watch sits at:
* 139.70 / 139.30 – minor support zone
* 137.40 – EMA + trendline confluence
* 134.52 / 133.00 – critical HVL and invalidation zone
✅ Summary & Trade Plan
* Bias: Bullish with gamma momentum, but nearing exhaustion zone
* Breakout Trigger: Above 143.20 → ride the gamma zone to 145–146
* Key Support: 139.70 / 137.40 (hold = healthy trend)
* Invalidation: Break below 134 = game over for bulls short-term
This analysis is for educational purposes only and does not constitute financial advice. Always do your own research and manage your risk accordingly.

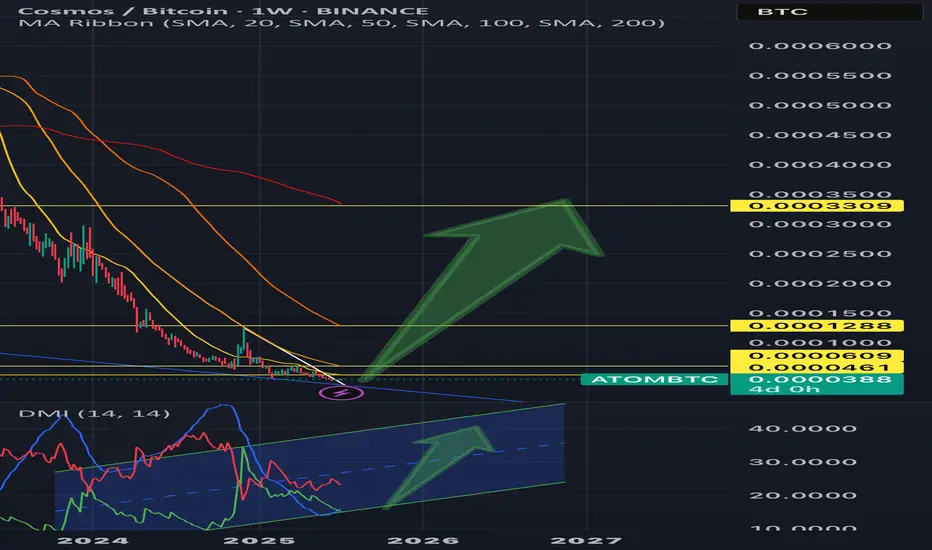
ATOM | COSMOS - REVERSAL SIGNALS & KEY LEVELS💫Here’s a detailed weekly ATOM/BTC analysis—focusing heavily on the Directional Movement Index (DMI) combo—and a forward-looking forecast.
💫 While ATOM/BTC is currently in a strong downtrend, the presence of bullish RSI divergence on a weekly scale suggests that the strength of this trend may be fading, opening the door for a possible upside shift.
💫 Trend Shift Scenarios:
👎 Bearish continuation if:
• –DI remains above +DI, AND
• ADX sustains above 30, reinforcing downtrend strength.
👍Bullish reversal begins when:
• +DI crosses above –DI on the weekly chart, and its starting to curve;)
• ADX remains elevated or climbs, confirming the new uptrend.
📉 Bear scenario:
If +DI continues to lag and ADX remains strong—price may retest recent support levels in BTC terms (around 0.000037–0.000038 levels.)
📈 Bull scenario:
Look for +DI to crossover above –DI while ADX sustains high values. Weekly RSI divergence (already visible!!!!) supports this &suggests potential 30–50% upside if ATOM breaks out against BTC resistance.
💫 Price Target:
In such a breakout, expect ATOM to outperform BTC by ~30–40% short-term, with room for up to 100% upside if momentum builds more!
💫 Summary
Weekly ATOM/BTC shows a strong downtrend (–DI > +DI, ADX ~33), but bullish RSI divergence hints at a possible reversal.
💢Catalyst: +DI crossing above –DI with ADX sustaining signal strength.
💢Potential: 30–50% upside short-term, 100% mid-term if breakout holds.
💢Plan: watch weekly DMI/ADX and price action in 0.000037–0.000038 BTC range, manage risk with stop-loss under support.
*Noteable: Also Watch RSI confirmation: upward breakout off of divergence is a strong signal.
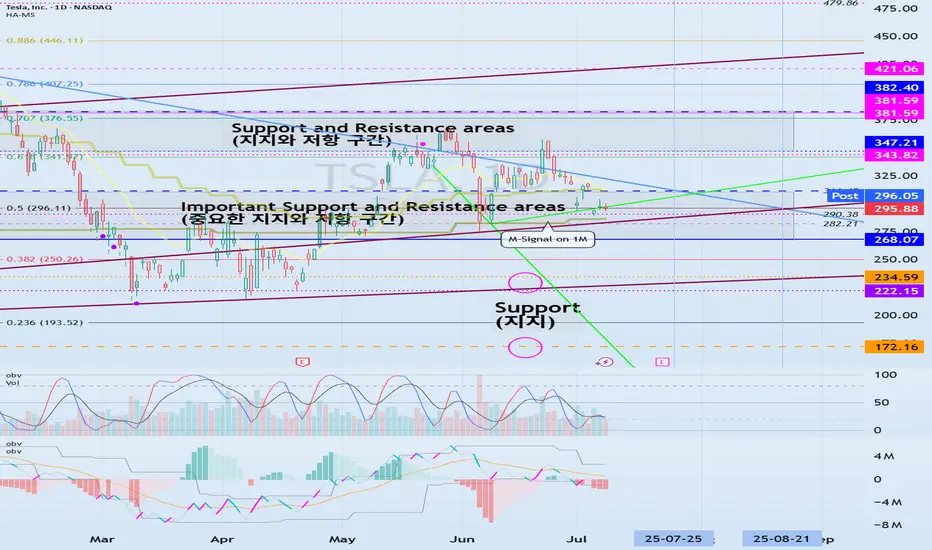
Important Volatility Period: Around August 21
Hello, traders.
If you "Follow", you can always get the latest information quickly.
Have a nice day today.
-------------------------------------
(TSLA 1D chart)
The medium-term trend is maintaining an uptrend.
However, if the price falls below the M-Signal indicator on the 1M chart and maintains, there is a possibility of a downtrend, so caution is required.
The support zone is
1st: 222.15-235.59
2nd: 172.16
Around the 1st and 2nd above.
The 268.07-311.48 zone is an important support and resistance zone.
If the price is maintained above this zone, there is a high possibility that a full-scale upward trend will continue.
However, since a resistance zone is formed in the 347.21-382.40 zone, we need to look at how this zone is broken upward.
-
When it falls to the 172.16-234.59 zone, we need to find a time to buy.
If not, we need to buy when it shows support in the 268.07-311.48 zone.
It would be better to buy at a lower price, but since the investment period will inevitably be longer, I think it is better to buy when an upward trend is detected.
-
The important volatility period is around August 21st, but before that, we need to check the movement around July 25th.
If it falls below 268.07 after August 21st, it could lead to further decline.
If it rises above 311.48 and maintains the price during the movement around July 25th, it could lead to further increase and it seems likely to create a trend after the volatility period around August 21st.
-
Thank you for reading to the end.
I hope you have a successful trade.
--------------------------------------------------
AMP Futures | OCO Bracket orders with Chart Trading.In this idea we will demonstrate how to apply an OCO bracket order on the Chart trader using TradingView.

Ramelius Resources (ASX: RMS) –A Tactical Re-Entry Zone?🟡 Gold-Linked Opportunity: Ramelius Resources (ASX: RMS) – A Tactical Re-Entry Zone?
Context: Ramelius Resources, a mid-tier Aussie gold producer, is showing signs of technical exhaustion after a strong rally from its 2024 lows. With gold prices consolidating and RMS pulling back to a key support zone, this could be a tactical opportunity for shareholders and swing traders alike.
📊 Technical Snapshot:
Current Price: $2.47
Trendline Support: The long-term ascending trendline remains intact, offering a potential re-entry zone for bulls.
Risk-Reward Setup: Defined green/red zones highlight a favorable R:R ratio for those targeting a rebound toward $2.80–$3.00.
🪙 Gold Correlation Insight:
The inset chart shows gold (XAU/USD) stabilizing after a volatile June. If gold resumes its uptrend, RMS could follow suit, given its strong correlation with bullion prices.
🧠 Psychological Angle:
After a 40%+ rally from the $1.78 low, some profit-taking is natural. But this pullback may shake out weak hands before a continuation move.
Watch for sentiment shifts around gold and broader risk appetite—these could be catalysts for RMS’s next leg.
#RMS #Gold #ASX #MJTrading #Forex #Trading #Investment

$BTC - Much Higher or Much Lower. EoY '26I'm not gonna lie, I drew these lines with my balls. I use them to move my cursor on my computer monitor.
This is not financial advice. This is just how my deep gut instinct likes to draw brushstrokes.
I gave 4 optional trajectories.
These will likely not happen, nor is it likely that the Price Action and Valuation will stay within these lines.
Enjoy and Happy Trading!
Mr. Storm

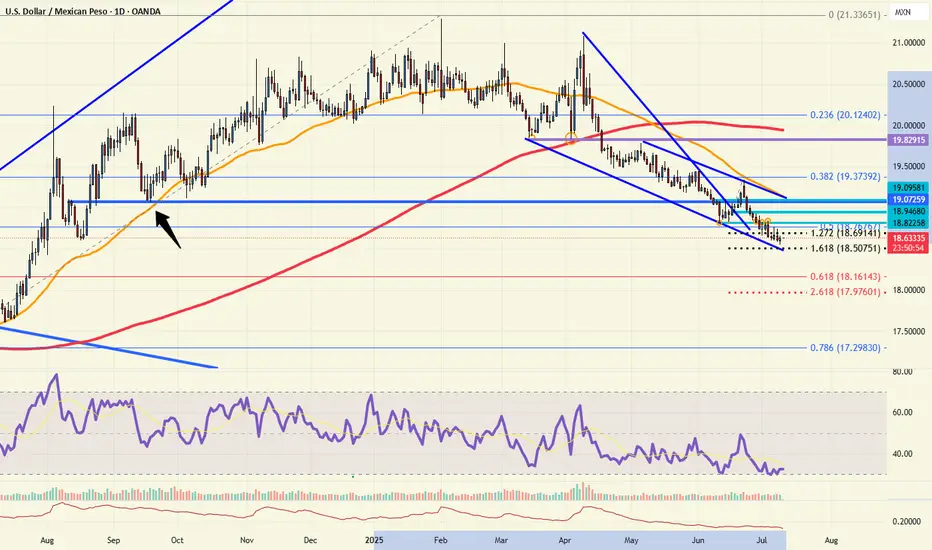
RSI divergent, suggesting a bounceThe USDMXN has been in a descending channel since spring of this year, but is near channel support with a strongly divergent RSI. Since the MXN has gained about 10% against the US Dollar since the beginning of the year, however rate differentials are tightening, the appetite for MXN at current levels may be waning. It's not time to be outright bullish the USD over the MXN, but a break back above the 18.8500 level may suggest that time may be near.
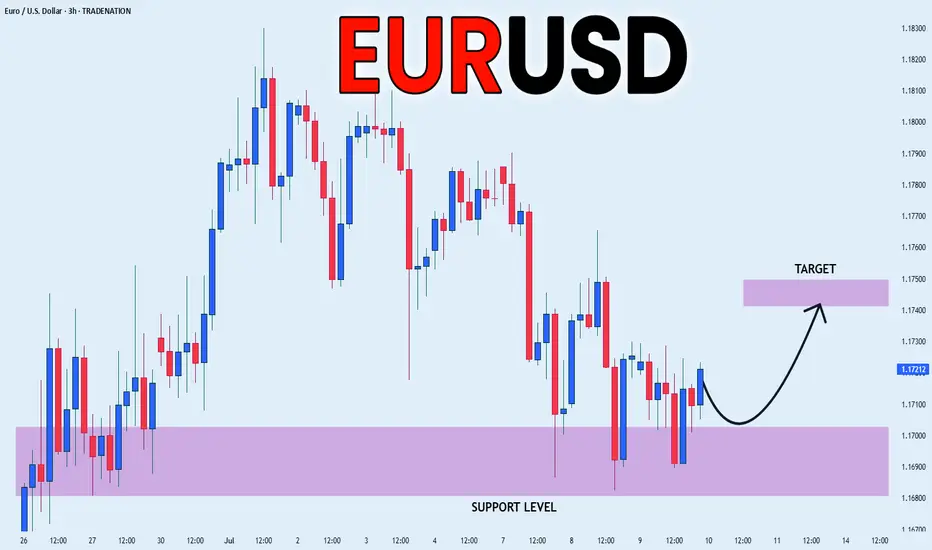
EUR_USD LOCAL REBOUND|LONG|
✅EUR_USD has retested a key support level of 1.1690
And as the pair is already making a bullish rebound
A move up to retest the supply level above at 1.1744 is likely
LONG🚀
✅Like and subscribe to never miss a new idea!✅
Disclosure: I am part of Trade Nation's Influencer program and receive a monthly fee for using their TradingView charts in my analysis.
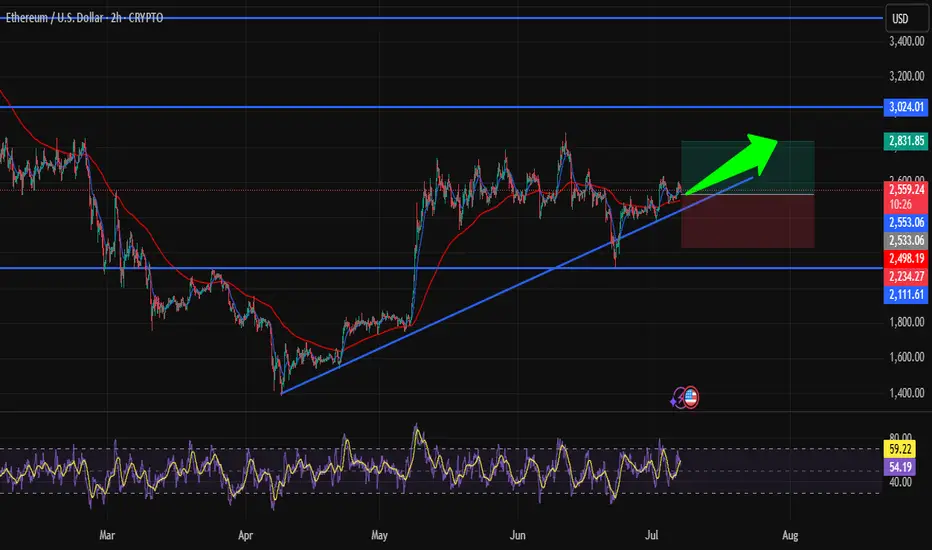
Is ETH Heading to $2800? Strategic Entry in Bullish TrendHi traders! , Analyzing ETH/USD on the 2H timeframe, price is respecting an ascending trendline and showing signs of continuation within the bullish structure:
🔹 Entry: 2555
🔹 Take Profit : 2831
🔹 Stop Loss : 2234
After consolidating above key support and retesting the ascending trendline, ETH is showing potential for a bullish continuation. The recent bounce is forming higher lows, and price remains above the 50 EMA, suggesting buyers are maintaining control.
RSI is currently turning upward from the mid-zone, signaling growing bullish momentum while still avoiding overbought conditions. The trendline has been respected several times, adding confluence to the setup.
If momentum holds, the TP around 2831 lines up with a significant resistance area from previous structure — a logical zone for price to reach in the short term.
⚠️ DISCLAIMER: This is not financial advice. Every trader is responsible for managing their own risk and strategy.
Bitcoin on Fire: Targeting $110K in Relentless Uptrend!Hi traders! , Analyzing BTC/USD on the 30 minute timeframe, price is currently respecting an upward channel and showing consistent higher highs and higher lows. The recent bounce from dynamic support suggests bullish continuation.
🔹 Entry: 109,545
🔹 Take Profit (TP): 110,612
🔹 Stop Loss (SL): 108,438
Price is trading above both the 50 and 200 EMA, confirming bullish momentum. The RSI remains above the midline, indicating buyers are still in control. This long setup offers a favorable risk-reward ratio within the context of the broader uptrend.
A confirmed breakout from the short-term resistance, combined with trendline support and channel structure, adds confluence to this idea. Watch for potential resistance near the 110,612 zone.
⚠️ DISCLAIMER: This is not financial advice. Every trader is responsible for their own decisions and risk management.

CAD_CHF STRONG SUPPORT|LONG|
✅CAD_CHF has been falling recently
And the pair seems locally oversold
So as the pair is approaching a
Horizontal support of 0.5790
Price growth is to be expected
LONG🚀
✅Like and subscribe to never miss a new idea!✅
Disclosure: I am part of Trade Nation's Influencer program and receive a monthly fee for using their TradingView charts in my analysis.

AUDUSD good structure for higher bullish
OANDA:AUDUSD whats next, we are have DESCENDING CHANNEL breaked, its followed by bullish push, but its not make to much in my op, at end price is make revers, its stop at end on strong sup zone (0.64900).
We are have in last day-two RBA and RBNZ today, price is start pushing looks like zone 0.64900 can be taked for valid zone, from which now expecting higher bullish push in next periods.
SUP zone: 0.65100
RES zone: 0.66300, 0.66600

BITCOIN BREAKOUT IMMINENT (120K)The Trend is your Friend. Bitcoin’s current action is the kind of bull‐market digestion you want to see before the next big surge. We’ve powered up from roughly $50 K on the Trump‐election narrative to flirt with all‐time‐high territory around $112 K, and now we’re simply consolidating in a tight $100 K–$110 K range. What really grabs my attention is how volume has dried up inside that band: fewer sellers stepping up means less fuel for a deep pullback, and an ebb in liquidity often precedes the kind of compressed buildup that launches a sharp move. That liquidity squeeze tells me smart money is biding its time rather than panicking out, and that sets the stage for a clean breakout once a new catalyst arrives.
Technically, the setup could hardly be neater. The 10-, 21- and 50-period moving averages have converged, running almost in lockstep. When those averages come together like train tracks, it signals a market in “healthy pause” — neither exhausted by an overextended rally nor capitulating under bearish pressure. It’s the kind of feature you love to see: price has had its run, it’s caught its breath, and it’s ready to go again on fresh conviction. Meanwhile, the RSI sits squarely in the middle of its range, neither overbought nor oversold, meaning there’s plenty of room for buyers to step in without an immediate pullback risk from extreme readings. In other words, momentum indicators are calm, not frothy or fearful, which further supports the case for a measured upward thrust rather than a sudden crash.
On the macro side, fundamentals are lining up, too. Monthly passive inflows into Bitcoin ETPs and ETFs continue at a robust clip, with institutions quietly adding to their positions out of the spotlight. If the Fed pivots toward rate cuts later this year, capital that’s been chasing yield elsewhere could flow back into risk assets — and Bitcoin, with its “digital gold” narrative, stands to gain especially when you consider its roughly $2 trillion market cap versus gold’s $20 trillion. That leaves a lot of upside potential if institutional demand keeps accelerating. Even more compelling: real‐world use cases for blockchain—everything from proof‐of‐ownership to decentralized finance—continue to mature behind the scenes, reinforcing Bitcoin’s narrative as not just a speculative asset, but a foundational piece of tomorrow’s financial system.
Of course, we can’t ignore the risks. We’ve already seen Bitcoin price near $112 K once, and there’s always the chance it carves a frustrating double-top if it stalls again. External narratives—Middle‐East tensions, renewed Ukraine tensions, fresh tariff skirmishes—could throw cold water on the rally and trigger a quick sell-off. But given the current setup—low‐volume consolidation, converging moving averages, balanced RSI and steady capital flows—a 10 % push toward $120 K feels not just possible but probable. Keep your eye on $112 K as your breakout trigger, size your positions sensibly, and plan your stop-loss around the lower end of the range. If Bitcoin can clear that level on strong volume, we’re likely to see this bull market extend rather than roll over into a double-top scenario. Happy trading, stay disciplined, and let’s see where this market takes us next!


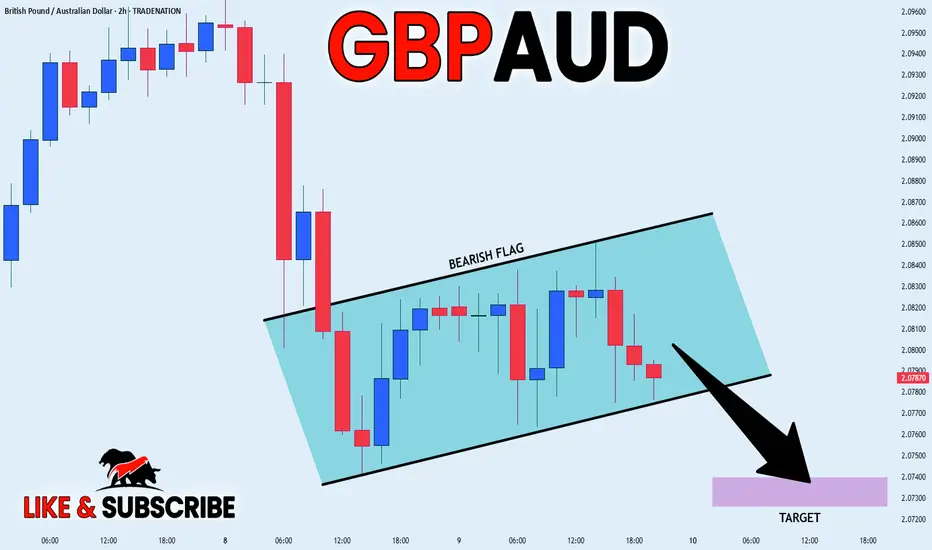
GBP_AUD BEARISH FLAG|SHORT|
✅GBP_AUD is going down now
And the pair has formed
A bearish flag pattern
Which makes me bearish biased
And after the breakout
I believe we will see bearish continuation
SHORT🔥
✅Like and subscribe to never miss a new idea!✅
Disclosure: I am part of Trade Nation's Influencer program and receive a monthly fee for using their TradingView charts in my analysis.