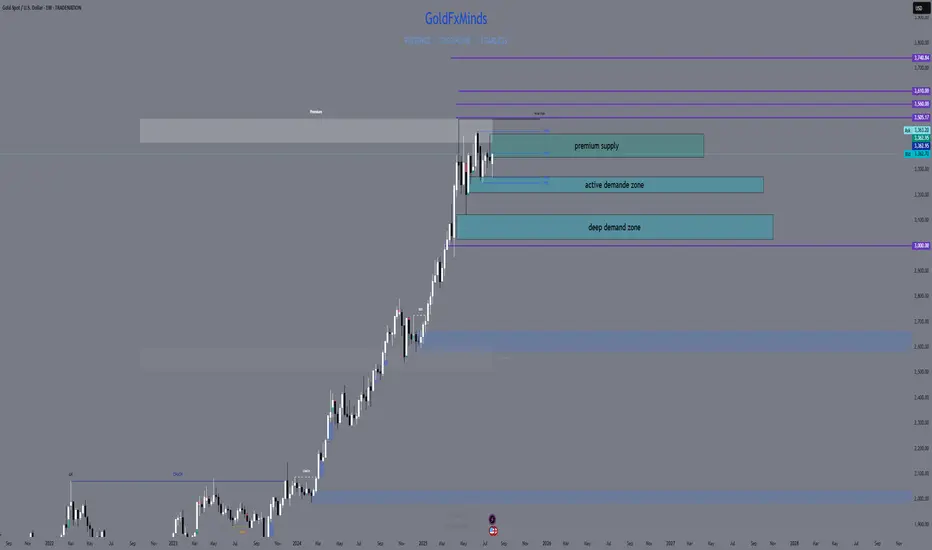
XAUUSD Weekly Outlook – August 4–8, 2025
The question isn’t whether gold is strong. The question is — will price expand, or rebalance?
🔸 Macro Overview
Gold begins the week consolidating just below its final HTF supply zone (3439), while USD weakens amid mixed macro data and growing speculation of future rate cuts. Markets await fresh catalysts, and gold’s recent impulsive rally is now facing the big test: break the wick, or pull back?
🔸 Weekly Structure & Bias
Element Observation
🔹 Trend Bullish continuation — clean structure
🔹 Last BOS March 2025 — impulsive, with imbalance below
🔹 Price Action Top wick rejection forming near 3439
🔹 Bias Still bullish, but entering exhaustion zone
🔹 RSI Above 70 — overheated
🔹 EMAs EMA5 > EMA21 > EMA50 > EMA100 — perfect trend
🔸 Key Weekly Levels (Zones + Confluences)
Zone Type Price Range Confluences
🔴 Supply 3350 – 3439 HTF wick supply + FVG + RSI 70+ + liquidity trap
🔵 Demand 3270 – 3215 Weekly OB + FVG + EMA21 support
🔵 Demand 3120 – 3070 Old BOS + deep FVG + psychological level
🟢 Support 3000 zone EMA50 + historical consolidation
🔸 Fibonacci Extensions (Above 3439)
Extension Level Price Target Confluences
1.0 (Swing Full) 3439 Supply wick high
1.272 3505 Next psychological milestone
1.414 3560 Mid-extension + liquidity
1.618 3610 Golden expansion target
2.0 3740 Full trend extension (max)
🔺 These levels serve as potential breakout targets ONLY if we get a confirmed weekly close above 3439 with clean BOS on LTF.
🔸 Weekly Scenarios
🟢 Scenario 1 – Break and Expand
If gold breaks 3439:
Expect clean continuation to 3505 → 3560 → 3610
Best entries come from new OBs on H4/D1 around 3350–3370
Follow momentum — but don’t chase without retrace confirmation
🔻 Scenario 2 – Rejection + Retracement
If price holds below:
Pullback toward 3270 – 3215 expected
EMA21 acts as dynamic support
If selloff gains strength, next demand = 3120 – 3070
🎯 This zone aligns with macro OB + re-entry for long-term bulls.
🔸 Conclusion & Gameplan
Gold is pressing against its final weekly ceiling.
Structure remains bullish, but every sniper knows — at the edge of premium, timing is everything.
✅ Above 3439 → expansion opens to 3505 → 3560 → 3610
🟦 Below 3439 → retracement into 3270 → 3215 → 3070
The best setups will be born from confirmation, not prediction. Let the market decide.
—
What would you do if 3439 rejects hard this week?
Comment your plan, tag your sniper level, and let’s stay ahead together 💬
—
With clarity, confidence, and perfect timing,
GoldFxMinds 💙
Disclosure: Analysis based on Trade Nation (TradingView) chart feed.
Bias
EURUSD - Bears Are on the MoveHello TradingView Family / Fellow Traders. This is Richard, also known as theSignalyst.
📈EURUSD has been overall bearish trading within the falling wedge pattern marked in red. And it is currently retesting the upper bound of the wedge.
Moreover, the blue zone is a strong structure.
🏹 Thus, the highlighted red circle is a strong area to look for sell setups as it is the intersection of the upper red trendline and structure.
📚 As per my trading style:
As #EURUSD approaches the red circle zone, I will be looking for bearish reversal setups (like a double top pattern, trendline break , and so on...)
📚 Always follow your trading plan regarding entry, risk management, and trade management.
Good luck!
All Strategies Are Good; If Managed Properly!
~Rich
Disclosure: I am part of Trade Nation's Influencer program and receive a monthly fee for using their TradingView charts in my analysis.

Nasdaq Deep Bearish RetraceI Think we're going to retrace (potentially deeply) on FED release or just before it to then reverse aggressively higher.
I am considering the current "range" on m15 as re-distribution and expecting lower prices on Fed release or just prior before continuation higher that may be delayed till tomorrow next FED.

MNQU2025 SELL IDEAMy bias for MNQ this morning with this trade of 2 contracts running. Would like to see price trade lower to 9:30am lows.
What do you guys think will happen? Will post results of the trade below.
Thanks for watching! Give a like if you enjoyed the explanation and a comment on what you'd like me to share with you guys about my trading journey.

Nasdaq Bearish 4hNasdaq Bearish after the failure in continuation through Previous Weekly High and the rejection afterwards.
Setting the Target to 21,471.00 Swing Low and using 21,716.00 as Low Easy Hanging Fruit (LEHF) objective that We may even reach today despite the small range day expectation (pre-CPI)

NQM2025 outlook for the week ahead 05/19/2025Hello World.
for the week ahead i have a bullish bias im looking to target the bearish fvg created on mon 24 feb 2025 ( daily TF) i expect the fvg formed on tue 13may2025 (Daily TF) reject the price higher, if the bullish fvg didnt hold maybe we will se a drop to the V.I bellow.
i will give updates

Quick Win on MNQ with Over $250 Profit — Here’s the Setup!Today’s trade was a perfect execution using an inverse fair value gap. I spotted a bearish fair value gap that had been disrespected, and instead of fading it, I flipped the bias and used it as an inverse gap, anticipating price would not trade under it. With my stop just below, I targeted the buy-side liquidity near the London kill zone highs.
The result? A smooth ride to over 300 points and a $250+ profit in a single entry, reaching target with precision. This is how it’s done when you combine technical setups with market context. Keep your risk low, target the right liquidity zones, and let the market work for you.
#MNQ #FuturesTrading #TradeSetup #FairValueGap #PriceAction #TradingTips #MNQTrade #NasdaqFutures #LiquidityHunt

Nasdaq and Indexes Week 22 BiasWhile the Indexes maitain a Bullish perspective on Weekly right now, I would not dare to anticipate next week "Flavour" but rather wait for The New Week Opening and if necessary till FOMC Minutes on Wednesday.
I would like to see immediate rejection from where price it's right now (allowing it to reach the IFVG starting at 20,690.00) to maintain a bullish bias rather then a deeper retrace, otherwise Bias may change on a Daily basis and pause that Weekly View for a later time .

Position Management – Price Consolidation & FVG SupportIn this video, we continue managing the position after taking our first partial. Price consolidates around the 50% retracement level before pushing lower to the 21,188.75 level, which aligns with the 9:33 AM fair value gap we identified earlier. We find support here, and at this point, we’re still hoping to see a continuation lower.
However, the inverse fair value gap only holds for a few more points before the price reverses against us. This ultimately takes us out of the position, but we still lock in a profit of $65 from the trade.
Trade Overview:
Price Action: Consolidation near 50%, then lower to 21,188.75 (9:33 AM fair value gap)
Support: Price found support at the fair value gap level before reversing
Exit: Stopped out with $65 profit as the inverse fair value gap failed to hold.

Trade Management – First Partial at 50% of the TrendIn this video, we’re already inside the 10 AM trade from the previous setup. At this point, we’re up 290 ticks, and we’re managing the position carefully. To mitigate risk, we decided to take our first partial near the 50% retracement of the trend, just in case the price reversed and went against us.
This step allowed us to lock in some profit while still leaving room for the trade to continue in our favor.
Trade Overview:
Profit: +290 ticks
Partial: First partial taken at 50% retracement of the trend
Risk Management: Protecting against potential reversal while staying in the trade.

MNQ Trade Setup -- Waiting for Flash PMI ImpactI’m holding off on a re-entry as we approach the Flash PMI at 9:45 AM. My bias is that there’s a potential for price manipulation to push higher above buy-side liquidity, taking out the highs before continuing lower. I’m waiting for the PMI release to confirm this idea and get better clarity on the market direction.
Bias: Expecting a possible manipulation higher to take out buy-side liquidity, followed by a continuation lower.
Waiting for Flash PMI to unfold before making any further decisions.

Indexes Daily "Slow" Trend anticipationExpecting a Daily slowliness a.k.a. HRLR (ICT Concepts) due to the Bonds decorrelation which is bearish. Once Bonds has reached Sell Side Liquidity Target, acceleration will be seen on Indexes higher. Meanwhile "give and take" is expected on a Daily and 4h basis.

Continuation into MNQ trades 5.14.25Continuation into my MNQ trading day, would like to see price continue higher, we have been pumping alot lately which cautions me to worry if we will see some sort of fast retracement sometime soon.
We took yesterday's daily highs, so I am a little confused if we will continue to take the current daily candle's high or if we will see some sort of retracement today into a bullish FVG from the daily to then continue trading higher.
The key aspect of trading that we are learning is when a candle/price will do something. Still alot to learn but have been making some decent choices with our trades. If we are stopped out we are still in profits for the day and maybe we call it.
The key thing I regret this trading session is not taking that $500 profit on NQ on that very first entry we took. Would've offset our losses and helped us stay secure profits for the day.

Gold - All eyes on Wednesday 08 May - FED🟡 Gold Traders: Nothing Matters Until Wednesday! ⏳💤
Hey traders! 👋
This week, all eyes are on Wednesday... and everything before that? Mostly noise.
Let me break it down for you. 👇
📊 Technical Outlook
Gold is chilling above a key resistance level right now.
Trendlines suggest we won’t see any major moves before Wednesday unless big news drops. 📰
🕐 Asian session is kicking things off above resistance.
If bulls show up there, we could break Trendline 1 (Image below) and head towards the $3300 🎯 target.
📉 RSI across multiple timeframes? Pretty neutral.
If Asia trades flat or slightly bearish, gold might range between $3210–$3250.
Break below $3201, and things could get shaky... but the European session might push us back above that support.
U.S. session on Monday? Likely a sideways snoozefest 😴 (unless surprise news hits).
🎯 Trade Setup (Mon–Wed)
I’m looking to play the range between:
$3261 (Trendline 2) 🔼 and $3169 (Trendline 4) 🔽
That’s a comfy $90 window I’m aiming to trade before Wednesday's fireworks. 🚀
🔮 After Wednesday – The FED Factor 💣
Here’s the real catalyst:
Wednesday, May 7 at 2:00 PM EST – FOMC Rate Decision
If the FED cuts rates (not likely, but possible under pressure), gold could tank hard. 💥
I’m talking a potential drop to $3150 or lower 🕳️📉
That’d be a -$90+ move easy.
FED has been holding the line 💪, resisting pressure (especially from Trump back in the day), but if the economy flashes red, that rate cut might come sooner than expected.
🧠 Final Thoughts
FED paused hikes, but left the door open for 3 rate cuts this year.
Until we get more clarity, no strong bullish signals on gold.
My bias stays: Bearish unless proven otherwise. 🐻💬
Stay sharp out there, and watch those sessions. Wednesday’s the real deal! 💼📉
And last but not least, look at this and let us know what you think about please:
Some would say its impossible but as we know, gold can do everything!
-------------------------------------------------------------------------
This is just my personal market idea and not financial advice! 📢 Trading gold and other financial instruments carries risks – only invest what you can afford to lose. Always do your own analysis, use solid risk management, and trade responsibly.
Good luck and safe trading! 🚀📊

A 3-Step Process For Analytical SuccessIn this video I go through the 3-step process of implementing a Bias, Narrative, and Model.
This process was a game-changer for me when it came to analysis, as well as taking actual trades. It considered high-probability targets, patience in waiting for traders to coming for me, and the calm of being prepared when it was time to take an entry. It filters out pointless trades, because if I don't have Bias, then I can't have a Narrative, and if I don't have a Narrative, then I don't have a Model.
I use ICT concepts, but this process works equally well for most other methodologies that aren't completely mechanical and algorithmic.
I give a real example of a trade I took yesterday on EURUSD where I utilized this 3-step process to frame a trade.
I hope you find this video insightful and gives you more clarity in your trading!
- R2F Trading

MNQ Sell Idea 5.2.2025Hey Everyone, Welcome back! I am here posting a trade idea we caught, hopefully our final terminus is hit! But in this video I share with you guys my confluences and bias for this trade.
We took out BSL with the 8:30am open and NFP news. I am targetting 19,829 levels as a potential area of interest because I believe the market will want to trade into it for buying opportunities as I do believe the market is bullish.

EURUSD retracement?
I'm watching OANDA:EURUSD today. My bias is bullish and would like to see it swipe some liquidity and reach some buy zones. There's also an imbalance in the Daily timeframe. However being a US holiday today, I don't expect a lot of movement. So I'm also considering the retracement down to those levels, considering its distance from them. Observing and waiting for liquidity to be taken first before taking any trades. Maybe preserving capital is the right trade today?

My POI and Market Outlook for MNQ 2.13.25Forex, Crypto and Futures Trading Risk Disclosure:
The National Futures Association (NFA) and Commodity Futures Trading Commission (CFTC), the regulatory agencies for the forex and futures markets in the United States, require that customers be informed about potential risks in trading these markets. If you do not fully understand the risks, please seek advice from an independent financial advisor before engaging in trading.
Trading forex and futures on margin carries a high level of risk and may not be suitable for all investors. The high degree of leverage can work against you as well as for you. Before deciding to trade, you should carefully consider your investment objectives, level of experience, and risk appetite.
There is a possibility of losing some or all of your initial investment, and therefore, you should not invest money that you cannot afford to lose. Be aware of the risks associated with leveraged trading and seek professional advice if necessary.
BDRipTrades Market Opinions (also applies to BDelCiel and Aligned & Wealthy LLC):
Any opinions, news, research, analysis, prices, or other information contained in my content (including live streams, videos, and posts) are provided as general market commentary only and do not constitute investment advice. BDRipTrades, BDelCiel, and Aligned & Wealthy LLC will not accept liability for any loss or damage, including but not limited to, any loss of profit, which may arise directly or indirectly from the use of or reliance on such information.
Accuracy of Information: The content I provide is subject to change at any time without notice and is intended solely for educational and informational purposes. While I strive for accuracy, I do not guarantee the completeness or reliability of any information. I am not responsible for any losses incurred due to reliance on any information shared through my platforms.
Government-Required Risk Disclaimer and Disclosure Statement:
CFTC RULE 4.41 - HYPOTHETICAL OR SIMULATED PERFORMANCE RESULTS HAVE CERTAIN LIMITATIONS. UNLIKE AN ACTUAL PERFORMANCE RECORD, SIMULATED RESULTS DO NOT REPRESENT ACTUAL TRADING. ALSO, SINCE THE TRADES HAVE NOT BEEN EXECUTED, THE RESULTS MAY HAVE UNDER-OR-OVER COMPENSATED FOR THE IMPACT, IF ANY, OF CERTAIN MARKET FACTORS, SUCH AS LACK OF LIQUIDITY. SIMULATED TRADING PROGRAMS IN GENERAL ARE ALSO SUBJECT TO THE FACT THAT THEY ARE DESIGNED WITH THE BENEFIT OF HINDSIGHT. NO REPRESENTATION IS BEING MADE THAT ANY ACCOUNT WILL OR IS LIKELY TO ACHIEVE PROFIT OR LOSSES SIMILAR TO THOSE SHOWN.
Performance results discussed in my content are hypothetical and subject to limitations. There are frequently sharp differences between hypothetical performance results and the actual results subsequently achieved by any particular trading strategy. One of the limitations of hypothetical trading results is that they do not account for real-world financial risk.
Furthermore, past performance of any trading system or strategy does not guarantee future results.
General Trading Disclaimer:
Trading in futures, forex, and other leveraged products involves substantial risk and is not appropriate for all investors.
Do not trade with money you cannot afford to lose.
I do not provide buy/sell signals, financial advice, or investment recommendations.
Any decisions you make based on my content are solely your responsibility.
By engaging with my content, including live streams, videos, educational materials, and any communication through my platforms, you acknowledge and accept that all trading decisions you make are at your own risk. BDRipTrades, BDelCiel, and Aligned & Wealthy LLC cannot and will not be held responsible for any trading losses you may incur.

Current XRP sell, remember my POI?This isn’t the best photo to show you guys but it’s just an update to my XRP bias. I’m on a sell currently Targetting that $2-1.50 level. Will be watching how price reacts as it reaches those levels.
What do you guys think, will XRP drop down for us to buy the dip and accumulate ? Or will it just keep going lower!?
Share your thoughts down below 👇

MY CURRENT POI FOR XRPSharing my Current POI for XRP, what are your thoughts? What do you see?
Forex, Crypto and Futures Trading Risk Disclosure:
The National Futures Association (NFA) and Commodity Futures Trading Commission (CFTC), the regulatory agencies for the forex and futures markets in the United States, require that customers be informed about potential risks in trading these markets. If you do not fully understand the risks, please seek advice from an independent financial advisor before engaging in trading.
Trading forex and futures on margin carries a high level of risk and may not be suitable for all investors. The high degree of leverage can work against you as well as for you. Before deciding to trade, you should carefully consider your investment objectives, level of experience, and risk appetite.
There is a possibility of losing some or all of your initial investment, and therefore, you should not invest money that you cannot afford to lose. Be aware of the risks associated with leveraged trading and seek professional advice if necessary.
BDRipTrades Market Opinions (also applies to BDelCiel and Aligned & Wealthy LLC):
Any opinions, news, research, analysis, prices, or other information contained in my content (including live streams, videos, and posts) are provided as general market commentary only and do not constitute investment advice. BDRipTrades, BDelCiel, and Aligned & Wealthy LLC will not accept liability for any loss or damage, including but not limited to, any loss of profit, which may arise directly or indirectly from the use of or reliance on such information.
Accuracy of Information: The content I provide is subject to change at any time without notice and is intended solely for educational and informational purposes. While I strive for accuracy, I do not guarantee the completeness or reliability of any information. I am not responsible for any losses incurred due to reliance on any information shared through my platforms.
Government-Required Risk Disclaimer and Disclosure Statement:
CFTC RULE 4.41 - HYPOTHETICAL OR SIMULATED PERFORMANCE RESULTS HAVE CERTAIN LIMITATIONS. UNLIKE AN ACTUAL PERFORMANCE RECORD, SIMULATED RESULTS DO NOT REPRESENT ACTUAL TRADING. ALSO, SINCE THE TRADES HAVE NOT BEEN EXECUTED, THE RESULTS MAY HAVE UNDER-OR-OVER COMPENSATED FOR THE IMPACT, IF ANY, OF CERTAIN MARKET FACTORS, SUCH AS LACK OF LIQUIDITY. SIMULATED TRADING PROGRAMS IN GENERAL ARE ALSO SUBJECT TO THE FACT THAT THEY ARE DESIGNED WITH THE BENEFIT OF HINDSIGHT. NO REPRESENTATION IS BEING MADE THAT ANY ACCOUNT WILL OR IS LIKELY TO ACHIEVE PROFIT OR LOSSES SIMILAR TO THOSE SHOWN.
Performance results discussed in my content are hypothetical and subject to limitations. There are frequently sharp differences between hypothetical performance results and the actual results subsequently achieved by any particular trading strategy. One of the limitations of hypothetical trading results is that they do not account for real-world financial risk.
Furthermore, past performance of any trading system or strategy does not guarantee future results.
General Trading Disclaimer:
Trading in futures, forex, and other leveraged products involves substantial risk and is not appropriate for all investors.
Do not trade with money you cannot afford to lose.
I do not provide buy/sell signals, financial advice, or investment recommendations.
Any decisions you make based on my content are solely your responsibility.
By engaging with my content, including live streams, videos, educational materials, and any communication through my platforms, you acknowledge and accept that all trading decisions you make are at your own risk. BDRipTrades, BDelCiel, and Aligned & Wealthy LLC cannot and will not be held responsible for any trading losses you may incur.

XAUUSD 6/1/25Coming into this week, we maintain a bullish bias on gold. Last week, we experienced a short-term shift to bearish, which was expected as we mentioned before the new year. Currently, we are focusing on the cluster of lows at the base of our most recent range. This is the area we are targeting for potential long trades this week.
Orion is indicating that we need to align with the long bias, so we will follow this direction and monitor targets and entries accordingly. Note that we currently have only two targets above. If the market creates another high before dropping into the mentioned lows, we may have more than two targets to work with, requiring us to trade within those areas.
Be mindful of the current structure. As mentioned in the EU analysis, we may form short-term lows to play off, which could make the lower areas less likely for the week’s initial move. As always, we wait for a low to be reached, then analyse the entry timeframe to determine if there’s an opportunity to participate.
Trade safely and stick to your plan.

USDCAD Bullish setup.Above this high we wait for a solid BOS , the nature
of a candle close will dictate if we commit to the
setup
We are looking for a candle that fully breaks above the structure With the body close above the structure .
This will be an impulsive move.
We identify a market structure that formed prior the
break , and that will be our entry position.
Be sure to use your hard learnt skills to look for an
entry around this area. Which will be our POI.

GBPUSD Daily Bias (18th Oct. 2024)It's been 3 consecutive weeks of the Cable printing bearish volumes and we anticipate the bears are not tired yet, at least not today.
Looking at the daily TF, we can see the bears just broke out of last week's consolidation on Wednesday and seem to be doing a pullback to clear internal liquidity from the new range it created following the breakout PA.
We've identified Wednesday's high as possible IRL (internal range liquidity) that can sponsor a further move to the downside.
We'll keep our arms folded as we await today's delivery.
GLGT!!!
LloydFx,
Trade Monastery.
