🌀 Cycle Theory and Wave Analysis 🌊👋🏻Hi guys. 💋Well, let's continue develop ourselves???💪🏻
Today I would like to tell you about the 🌊wave analysis🌊
☝🏻😉For those, who have recently joined, I would like to say, that we are studying technical analysis.💪🏻💪🏻
👇🏻👇🏻👇🏻Below you can find my previous educational ideas.👇🏻👇🏻👇🏻
Ok, now let's start from the few words about theory of cycles💪🏻
🌀The theory of cycles is more developed at the theoretical than at the practical level, and deals with cyclical fluctuations not only in prices, but also in natural phenomena in general. Almost all methods of technical analysis fit into this classification.✔
💥 If you wanna be successful trader, you need to understand this method of analysis 💥
☝🏻 The trend (impulse waves) has a 5-wave structure (waves are indicated by the numbers 1,2,3,4,5, A, B, C ) and consists of impulse waves and correction.
📌 Impulse Waves 1,3,5
- longer than correction waves
- show the direction of the trend
📌 Correction Waves 2 and 4
- has a 3-wave structure (a-b-c)
- show the direction opposite to the current trend
☝🏻 1st, 3rd, 5th impulse waves have a 5-wave structure of their subwaves. Correction waves (2 and 4) have a 3-wave structure and are denoted by A-B-C.
📌 Signs of a trend reversal in terms of wave analysis are:
- finite diagonal triangle
- extended 5th wave
- truncated 5th wave
👉🏻 The 2nd and 4th waves are corrective. The movement on these waves takes the form of the following correction models:
- zigzags (5-3-5) (Zigzags) or simple (zigzag) correction
- planes (3-3-5) (Flats) or flat (flat) correction
- triangles (3-3-3-3-3-3) (Triangles) or triangular correction
- double triples and triple triples (combined structures)
- incorrect correction
In fact, wave analysis has nothing to do with the market. At least in the modern world.
This theory once worked, but not now.
☝🏻Although it attracts a lot of people with its simplicity and visibility.
Now you will not find two wave operators, that would give the same market assessment and forecasts. So many directions and methods of wave analysis have formed today.
Wave analysis is an artificially invented method for predicting markets, that is, not natural even for human behavior.
💥If you use it, then be extremely careful. To say, that wave analysis doesn't work is too subjective. Each for himself decides what and how to use.
😆Right or wrong - the market will judge by adding or taking money to the account.😆
🤔I hope I have clearly explained you my vision of wave analysis, if you are interested, you can study this method more deeply.💪🏻💪🏻
😸Subscribe and don't forget to put like to my enthusiasm, I try for you😉😉😉
Stay with me🌞
Kiss You 💋
Your Rocket Bomb🚀💣
Cycle

HOW TO TRADE MARKET STRUCTURE HOW TO TRADE MARKET STRUCTURE
1) WE CAN SEE THAT USDCAD HAS BEEN IN AN UPTREND MAKING HIGHER HIGHS & HIGH LOWS. THIS IS DISPLAYED WITH THE A-B-C-D MOVEMENTS
2) AT 'C' WE REACHED A KEY RESISTANCE ZONE AT 1.42500 RESULTING IN THE NEXT PHASE OF THE UPTREND TO CREATE A NEW HIGHER LOW AT D
3) AT 'D' USDCAD BEGINS THE NEXT PHASE OF OVERALL UPTREND AND ATTEMPTS TO MAKE A NEW HIGH. HOWEVER THIS UPWARD MOVE FAILS AS WE FAIL TO BREAK ABOVE 'C' & INSTEAD END WITH THE MOVE TO 'E', SIGNALLING A POTENTIAL END TO THE UPTREND
4) THE NEXT MOVE FROM 'E-F' CREATES A NEW SUPPORT LEVEL AT OUR PREVIOUS LOWER HIGH 'D' (1.41142) ZONE
5) THE NEXT MOVE FROM F-G IS AN ATTEMPT FROM BUYERS AT THE SUPPORT LEVEL CREATED FROM E-F (1.41142) TO TRY AND CONTINUE THE UPTREND HOWEVER 'G' NOW CREATES A LOWER HIGH
6) FROM G-H WE CAN SEE PRICE IS MAKING A THIRD TEST OF THE SUPPORT LEVEL AT (1.41142). A FAILURE OF THE SUPPORT LEVEL HOLDING GIVES US A GOOD ENTRY POINT TO ENTER A SELL POSITION WITH OUR PROFIT TARGET OF 105 POINTS AT 'H' (1.40000)

Bitcoin Market Cycle. Psychology & Mechanics.Just as important, riding a bicycle, or even a supercar, doesn’t fall under the train, in order to understand when and in which direction to trade - you need to figure out who you are playing against, how to behave in each of the phases of the market, and how to identify these phases.
Today we’ll talk about the mechanics of the market and its participants. According to the postulates of technical analysis, which in turn is based on the law of market fractality, there are market cycles in which 4 phases can be distinguished:
1. Accumulation
2. Acceleration
3. Distribution
4. Shaking out
There is also theory that divides the cycle only into accumulation and distribution, we distinguish 4 phases, which, in our opinion, describe in more detailed market participants behaviour.
The problem of many novice traders and investors is precisely the lack of an optimal exit point from the transaction. Understanding the phases of the market will be helpful in solving this problem.
Consider each phase in more detail:
Accumulation - this phase visually looks like a horizontal corridor with low volatility and increased volumes. On Bitcoin, this phase can be observed twice on weekly charts in 2015 and 2019. At this moment, large limit players of long positions are activated. Lows and highs cease to be updated. These market participants operate on the principle of buy low - sell high. Accordingly, they have models of fundamental asset pricing, and the fair price that it should cost. Purchases are made below this price. As a result, there is an imbalance between buyers and sellers, which affects future pricing. The latter is becoming less and less inside the accumulation. At a time when there are not enough sellers on the market ready to push the price further, a control purchase on the market occurs, which causes the first update of three-month highs and the subsequent market reversal. Then begins the phase of overclocking the market.
Acceleration - at this moment, traders on 1D or less charts are activated. Highs begin to update and lows cease to be updated. A growing market is starting to create excitement and attract new money, interested in future benefits. These participants can act for fundamental, technical, or emotional reasons and with their money push the course upwards by buying market orders. Participants in the purchase phase during the accumulation phase begin moderate sales above their “fair” price starting distribution.
Distribution is the culmination of closing purchases made during the accumulation phase. In this phase, the highs cease to be updated, but the lows have not yet begun to be updated. At the potential top of the bull market, large players will want to sell stocks previously purchased at low price levels, which will take profits. Most of them will place large sell orders in a certain price range. Each sale should be absorbed by market makers who create the market. Some orders will be executed immediately, another part will go to the order book. Market makers will resell, which must be executed without lowering the selling price of their own, or other traders. Large limit orders in a glass can maintain a rate higher than the price at which the remainders of the "initiators" are added to players who are too optimistic about prices in the near future. After closing the deals of the “initiators”, limit purchase orders disappear from the glass and the remaining mass of the market falls under the influence of the supply thrown onto the market - a bearish trend begins, and with it the shaking out phase.
Shaking Out - new minimums becomes lower. The market is accelerating in down trend and trying to get balance. Afterwards market starts to slow down and then volatility goes down. At some point, traders who are already trading short positions leave the instrument for other, more volatile ones. The strongest holders who have not yet sold their assets remain in the cold darkness. At one point, market capitulation occurs. The market cycle is over. There is no weak holders anymore. If fundamentally there is a potential for growth and the price is "underestimated", a new phase of accumulation begins. If fundamentally everything is bad, the asset goes into non-existence and is replaced by dozens of new ones.
For hundreds of years, technology, markets, products have changed, but not psychology - the psychology of the masses, built on greed and fear, remains unchanged for hundreds of years.
In order to learn how to successfully trade, unlike investing, you must forget about the intrinsic value of a stock, or any other instrument. All that you should care about is the perceived value - the value that professionals imagine, and not the one that reflects the interests of the issuer. Intrinsic value is only part of the perceived value. Remember that instrument quotes reflect precisely its perceived value, and not internal, as you might have thought.
When to quit:
1. The ideal way is to exit at the beginning of the distribution phase. At this point, the new high will be lower than the previous one. The first signals will be reversal candle patterns, with a continuation in the form of bearish volumes. many technical indicators will show divergence signals.
2. If you missed this moment, after the first downward wave, there will be a correction. Oscillators will show a way out of the oversold zone with the high below the previous one.
3. If you missed this signal, then it is advisable to exit on the signal-momentum indicators, or on the next correction wave of lower time frames.
Congratulations! Now you understand the mechanics of the market and, perhaps, this article will help you not to fall into the trap of the market. And if without multiyears of trading experience you want to be profitable on cryptocurrencies market from the begin - join to FOBS!
If this material was useful for you - please leave your likes and comments, and also follow us on social networks!

BITCOIN - Where are we now?Bitcoin is the best asset to invest for high profit in long-term!
Decentralize the network!
Decentralize the world!

Fundamentals of Elliott Wave Theory - Cycles ConstructionThis chart corresponds to our second article about The Elliott Wave Theory

Structure of a Complete CycleThis chart,corresponds to the second part of the educational series about Elliott Wave Theory.

Bull/Bear cycle indication: Using the FUSIONGAPS oscillatorFUSIONGAPS (FG):
DIFFERENTIAL FUSIONGAPS (DFG):
Currently showing the BTCUSD (1M) chart, with only the 50/15 DMA FG oscillator shown.
The y-axis for the FG and DFG charts are both set to log-scale simply to allow comparison with historical behavior here.

UJ expanding flat abc (circle green)Charts consist in 3 Dimensions - The X-factor ( Time or Cycle ), The Y- factor ( Price Geometry ), AND The Z-factor ( The Speed/How "fast" price travel according to time )

MAYBANK (1155): MALAYAN BANKING BHD For Education Purpose ONLY
Murphy's law : "Anything that can go wrong will go wrong". So?!! Cut lost , cut lost AND CUT LOST!! If anything wrong!
P/S: Unlike conventional, To have consistent elliot wave counts,there is ONLY 3 subwave ( abc ) counts on ANY Impulsive wave (1,3,5) VS coventional counts which is 5 subwave (1,2,3,4,5)

Learn how Bitcoin Cycles Work.Hey, I am back with another Chart, but this time with something more educational .
Last time I was saying, that you should Ride with the wave, go with flow.
Many of you has asked my how can I predict this market, if we are currently bearish or bullish, how to follow trends..
Yeah, this Chart looks kinda complicated and messy but again, I think cycles arent that simple and tried to draw this to be clear and understable as possible.
First of all, what is a cycle?
Cycle in simple.
Cycle is a time period in where buyers/sellers are in dominance.
It ussualy last around one month.
On the chart, you can see 5 Cycles, 3 Bearish 2 Bullish.
6500 level as strong support.
There is a crossing Line that Indicates the start of each cycle.
Green line that Indicates the 6 th day in month.
Why is there a line that Indicates 6 th day in a month?
Notice how on the green there is long. somehow trend changing candle .
That may be the exact day of cycle start or end, change of trend.
Okay, next thing to look at - RSI.
Whenever Bitcoin is over 60 t hat is consider as bullish level, anything below 40 is ocnsider as bearish .
Simple and clear isnt it?
Look at Bitcoin each time we are in Bull cycle it always bounces of that 40 bearish level, and each time we are Bear cycle Bitcoin fails to break 60 bullish level
I hope I have make your mind about Cycles kind of clearer, if you have any questions, make sure to ask me bellow or at my Discord Channel.
If you like this Educational material let me know in the comments below or by just simple agreeing with me, Thanks !

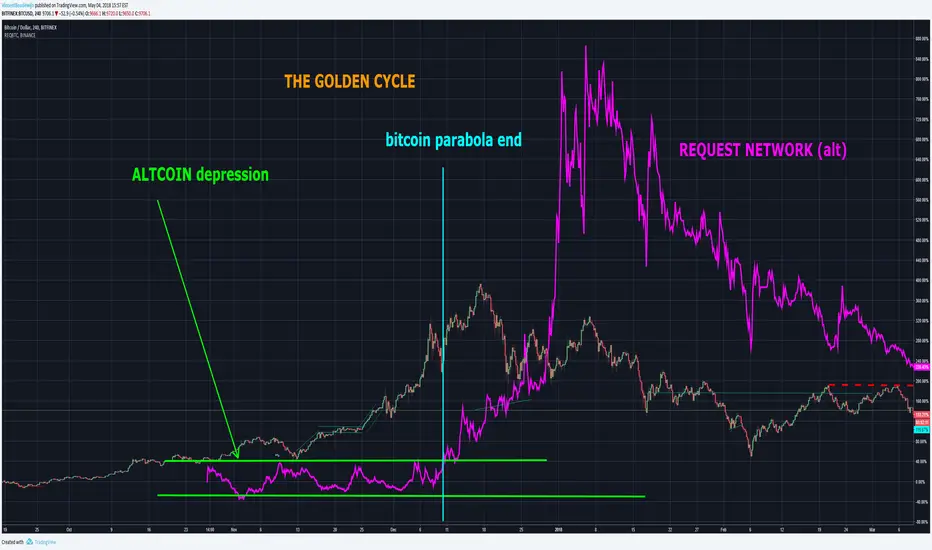
LEGENDARY: Trading the GOLDEN CYCLELets play a little game.. I want you to figure this chart out yourself. Looking back at December..
Will YOU trade the GOLDEN CYCLE and become a legend?
Hint.. Hint..
Goodluck ;)
GARTNER HYPE CYLE GARTNER HYPE CYLE
1. Technology Trigger - A potential technology breakthrough kicks things off. Early proof-of-concept stories and media interest trigger significant publicity. Often no usable products exist and commercial viability is unproven.
2. Peak of Inflated Expectations - Early publicity produces a number of success stories—often accompanied by scores of failures. Some companies take action; most don't.
3. Trough of Disillusionment - Interest wanes as experiments and implementations fail to deliver. Producers of the technology shake out or fail. Investment continues only if the surviving providers improve their products to the satisfaction of early adopters.
4. Slope of Enlightenment - More instances of how the technology can benefit the enterprise start to crystallize and become more widely understood. Second- and third-generation products appear from technology providers. More enterprises fund pilots; conservative companies remain cautious.
5. Plateau of Productivity - Mainstream adoption starts to take off. Criteria for assessing provider viability are more clearly defined. The technology's broad market applicability and relevance are clearly paying off.

