Elliott Wave Theory - Motive WavesElliott Wave Theory , developed by Ralph Nelson Elliott, proposes that the seemingly chaotic behaviour of the different financial markets isn’t actually chaotic. In fact the markets moves in predictable, repetitive cycles or waves and can be measured and forecast using Fibonacci numbers.
The very basics of Elliott Wave Theory ;
The Elliott wave principle at its core consists of motive waves, movement in the direction of the larger trend, and corrective waves, any correction against the main trend. Market prices alternate between a motive phase, and a corrective phase on all time scales of trend.
Wave analysis offers insights into trend dynamics and helps you understand price movements in a much deeper way and offers the trader a level of anticipation and/or prediction when searching for trading opportunities
Motive Waves
Motive waves in general can be categorized as Impulse and Diagonal waves
a- Impulse Waves
Impulse waves consist of five sub-waves in the same direction as the trend of one larger degree.
Elliott proposed that financial price trends, the waves, are created by investor psychology or sentiment and the waves can be measured and forecast using Fibonacci numbers . In adition to using fibonacci retracments and extetion to forcast probable targets, channeling technique is also presented, where channeling technique is used to forecast wave formations and targets using price action .
Disclaimer: besides the rules, the below presented figures displays guidelines that elliott waves may form. Guidelines are tendencies, not set in stone rules
b- Diagonal Waves (Wedges)
Another form of motive waves are diagonals, they appear in the beginning of a larger trend, called leading diagonal and at the end of the larger trend, called ending diagonal
They are five-wave structures in the direction of the main trend within which wave 4 almost always moves into the price territory of (overlaps) wave 1, breaking the rule of impulse motive wave
Diagonals take a wedge shape within two converging lines
Elliott was careful to note that these patterns do not provide any kind of certainty about future price movement, but rather, serve in helping to order the probabilities for future market action. They can be used in conjunction with other forms of technical and fundamental analysis, including technical indicators, to identify specific opportunities.
Technical Indicators
Using various technical indicators among elliott wave practitioners is not so common, except few, probably the common one used is a kind of momentum indicator, such as RSI or MACD , to detect divergencies
Fibonacci retracement and extension drawing tools are essential for elliott wave practitioners. In todays computerized era many of the darawing tool's auto indicator versions are availabe on the trading platforms, such as Auto Fib ( where and how tp apply )
Elliott Wave Oscillator ( EWO ) , is inspired by the Elliott Wave principle and helps counting the waves
Volume and Volume Profile ( Vol / Vol Profile ) combined with price action is esential in technical anlaysis and for elliott wave practitioners helps to identify impulse and correction phases
Other indicators that are referred among elliott wave practitioners
Pitchforks ( how to apply ), Pitchfans , FibFans ( how to apply ), FibChannels ( how to apply ), FibTime , LinReg Channel ( what it is ), Raff Regression Channel ( what it is ), etc
Elliotwaveanalysis

Elliott Wave Example - Impulse Wave 📚 Today i would like to share some basic Elliot Wave analysis along with an example. The Elliott Wave Theory was developed by Ralph Nelson Elliott in the 1920s. Elliott found that financial markets have characteristic movements that repeat in perpetuity. He called these movements *waves," due to the troughs and peaks that present themselves in a cyclical up-and-down fashion.
I have put together this example of an Impulsive wave, this pattern is the most common motive wave and the easiest to spot in a market.
The impulse wave consist of five sub waves that make net movement in the same direction as the trend of the next-largest degree. Like all motive waves, it consists of five sub-waves—three of them are also motive waves, and two are corrective waves.
It has three unbreakable rules to be an impulsive wave -
Wave 2 cannot retrace more than the beginning of wave 1
Wave 3 can never be the shortest but does not have to be the longest of waves 1, 2 and 5
Wave 4 cannot overlap the end of wave 1
If one of these rules is violated, the structure is not an impulse wave.
Elliott Wave Theory is a broad and intricate topic and can be a little overwhelming when first learning it but despite its complexity you can use these simple elements to begin with to help you understand which way the market is going. We will dive deeper into
Elliott Waves in the future but for now train your eyes to spot these impulse waves

ELLIOTT WAVES and REAL CHART RUNE ANALYSISElliott Wave Theory Interpretation
The Elliott Wave Theory is interpreted as follows:
Five waves move in the direction of the main trend, followed by three waves in a correction (totaling a 5-3 move). This 5-3 move then becomes two subdivisions of the next higher wave move.
The underlying 5-3 pattern remains constant, though the time span of each wave may vary.
Let's have a look at the following chart made up of eight waves (five net up and three net down) labeled 1, 2, 3, 4, 5, A, B, and C.
Waves 1, 2, 3, 4 and 5 form an impulse, and waves A, B and C form a correction. The five-wave impulse, in turn, forms wave 1 at the next-largest degree, and the three-wave correction forms wave 2 at the next-largest degree.
The corrective wave normally has three distinct price movements – two in the direction of the main correction (A and C) and one against it (B). Waves 2 and 4 in the above picture are corrections. These waves typically have the following structure:
Wave Degrees
Elliott identified nine degrees of waves, which he labeled as follows, from largest to smallest:
[
*]Grand Super Cycle
Super Cycle
Cycle
Primary
Intermediate
Minor
Minute
Minuette
Sub-Minuette

Bitcoin's Market Cycle Explained Through Elliott WavesThis is an educational post on Elliott Impulse Wave structures, and how the theory can be applied to Bitcoin's chart, in order for us to identify the overall market trend.
Disclaimer: This is not investment advice. This is for educational and entertainment purposes only. I am not responsible for the profits or loss generated from your investments. Trade and invest at your own risk.
Basic Elliott Wave Structure
- 80% of the time, an Elliott Impulse Wave would have a structure as the diagram demonstrated above.
- After the first impulse wave, we have wave 2, which is a short term corrective wave, play out.
- Most of the time, the second wave demonstrates a zig zag pattern, in which we can count ABC waves.
- When the second wave is a zigzag, there's a high probability that the fourth wave demonstrates a complex correction, such as a double three (WXY), or a triple three (WXYXZ).
- Also, when the second wave is a zig zag pattern, there's a high probability that the length of the third wave is 1.618x of the first wave's length.
- In this case, there's also a high probability that the length of the fifth wave is equal to that of the first wave.
- Keep in mind that these are all probabilities. There are no rules set in stone that state that waves have to move a certain way, in a certain length, but they tend to demonstrate this structure under certain conditions
Bitcoin's Elliott Wave Structure
- However, as you can notice from Bitcoin's Elliott Wave count chart above, Bitcoin's second wave did not demonstrate a zig zag pattern.
- Instead, Bitcoin demonstrated a triple three (WXYXZ) leading to a sharp final drop caused by the Covid outbreak.
- When the second wave demonstrates a triple three pattern, there's a high probability that the fourth wave demonstrates a zig zag pattern.
- Also, when the second wave is a complex correction, there's a high probability that the third wave's length is 2.618x of the first wave's length.
- Additionally, when the second wave is a complex correction, there's a high probability that the final wave's length is 1.618x of the first wave's length.
Bitcoin Weekly Chart Elliott Wave Analysis
- Taking into consideration the Elliott Wave structures explained above, we can now see that Bitcoin's trend can be explained by the second diagram.
- We saw a complex correction (triple three, WXYXZ) pattern on Bitcoin's second wave.
- We're currently completing wave 4, which seems to be a running flat pattern (ABC).
- While this isn't exactly a zig zag pattern, it's a variation of the zig zag pattern, and part of the larger concept of simple corrections.
- For a more in-depth explanation on this corrective trend for the short term, make sure to check out my previous analysis by clicking the chart below:
Revealing My Secret Method: Technical Symmetry Analysis
Summary
I believe that there's an extremely high probability that Bitcoin's bull run isn't over. While December's price action may be rather disappointing, as we're in the process of completing the final corrective wave within a bigger impulse trend, we could expect a parabolic rally as we move towards Q1 of 2022. Using Elliott Waves isn't about accurately predicting the exact price and period of an asset's price action. While a lot of people try to correct each other on "wrong counts", unless the general rules are kept, there really isn't a strictly correct way or incorrect way of using this theory as a tool. In my opinion, Elliott Waves are best used on longer time frames, to identify the overall trend, and which point of the market cycle we are at.

5 YEAR BEAR MARKET AHEADMY Chart clearly show's that SPX just completed it's 5th wave expansion after major 4th wave which was ended on 2009
As per NEO wave analysis the ''TERMINAL 5 TH WAVE'' in S&P500 INDEX is ended this month after a spectacular Rally for 13 years.
Now the game has to change on the hands of BEARS for at least 5 years.
I invite any querries about my wave counts and timing.
B.selvam ,B.E,MBA,
ANALYST

Trading phycology Elliot Wave 12345If you are interested in charting elliotwave where many thinks its a holy grail of making profit in the market like me I have here to share the knowledge.

NIFTY WILL CORRECT UPTO11300Using my vast experience in Elliot wave labelling, I charted a super cycle count for NIFTY INDEX.
NIFTY Completed its 5 legged 3rd wave and extended its ''B'' Wave recovery(Running flat correction)to16700
A five legged wave 'C' of WAVE ''4'' will bring the index to minimum 38.2% to 11300 before April 22 and oscillate up and down till July24
We have more time to resume 5 th wave ,which will make you richer again to 25000
NOW its time to play with bears

💨𝙀𝙡𝙡𝙞𝙤𝙩𝙩 𝙒𝙖𝙫𝙚 𝙋𝙖𝙩𝙩𝙚𝙧𝙣: 𝙄𝙢𝙥𝙪𝙡𝙨𝙚🌊●● 𝙄𝙢𝙥𝙪𝙡𝙨𝙚 (IM)
❗❗ Rules
● An impulse always subdivides into five waves.
● Wave 1 always subdivides into an impulse or a diagonal.
● Wave 2 always subdivides into a zigzag, flat or combination .
● Wave 2 never moves beyond the start of wave 1 .
● Wave 2 always ends in the territory of wave 1 , and wave 4 in the territory of wave 3 .
● Wave 3 always subdivides into an impulse.
● Wave 3 always moves beyond the end of wave 1 .
● Wave 3 is never the shortest wave.
● Wave 4 always subdivides into a zigzag, flat, triangle or combination .
● Wave 4 never moves beyond the start of wave 2 .
● The termination point of wave 4 never moves beyond the end of wave 1 .
● Wave 5 always subdivides into an impulse or a diagonal.
● Never are waves 1 , 3 and 5 all extended.
❗ Guidelines
● Wave 4 will almost always be a different corrective pattern than wave 2 . If the second wave is a sharp correction, then the fourth wave will usually be a sideways correction, and vice versa (alternation).
● Wave 2 is usually a sharp correction in the form of a single or multiple zigzag.
● Wave 4 is usually a sideways correction in the form of a flat, triangle, or combination .
● In rare cases, a triangle (one that does not include a new price extreme) in the fourth wave position will take the place of a sharp correction and alternate with another type of sideways pattern in the second wave position.
● Wave 4 typically ends when it is within the price range of subwave four of 3 .
● In an impulse wave, wave 4 should significantly break the trend channel formed by the subwaves of wave 3 .
● Wave 4 often subdivides the entire impulse into Fibonacci proportion in time and/or price.
● On rare occasions, wave 4 subwaves can enter the territory of wave 1 . As a strong guideline, no portion of wave 4 of an impulse wave can enter the price territory of wave 1 or wave 2 .
● Second waves of impulse waves would tend to go beyond the previous fourth wave at one lesser degree.
● Sometimes wave 5 does not move beyond the end of wave 3 (in which case it is called a truncation).
● Wave 5 often ends when meeting or slightly exceeding a line drawn from the end of wave 3 that is parallel to the line connecting the ends of waves 2 and 4 , on either arithmetic or semilog scale.
● The center of wave 3 almost always has the steepest slope of any equal period within the parent impulse except that sometimes an early portion of wave 1 (the "kickoff") will be steeper.
● Wave 1 , 3 or 5 is usually extended. (An extension appears "stretched" because its corrective waves are small compared to its impulse waves. It is substantially longer, and contains larger subdivisions, than the non-extended waves).
● Often, the extended subwave is the same number ( 1 , 3 or 5 ) as the parent wave.
● Rarely do two subwaves extend, although it is typical for waves 3 and 5 both to extend when they are of Cycle or Supercycle degree and within a fifth wave of one degree higher.
● Wave 1 is the least commonly extended wave.
● If wave 1 of the impulse is the leading diagonal, then one should not expect wave 5 in the form of the ending diagonal.
● When wave 3 is extended, waves 1 and 5 tend to have gains related by equality or the Fibonacci ratio.
● When wave 5 is extended, it is often in Fibonacci proportion to the net travel of waves 1 through 3 .
● When wave 1 is extended, it is often in Fibonacci proportion to the net travel of waves 3 through 5 . In addition, wave 2 can subdivides the entire impulse into Fibonacci proportion in time and/or price.
Elliott Wave Principal 2005 & QA EWI.

Mastering Elliott Wave AnalysisHi, traders!
Today we gonna speak about Elliott wave principles. The Elliott wave principle is a form of technical analysis that finance traders use to analyze financial market cycles and forecast market trends by identifying extremes in investor psychology, highs and lows in prices, and other collective factors. Ralph Nelson Elliott (1871–1948), a professional accountant, discovered the underlying social principles and developed the analytical tools in the 1930s. He proposed that market prices unfold in specific patterns, which practitioners today call Elliott waves , or simply waves. Elliott published his theory of market behavior in the book The Wave Principle in 1938, summarized it in a series of articles in Financial World magazine in 1939, and covered it most comprehensively in his final major work, Nature's Laws: The Secret of the Universe in 1946. Elliott stated that "because man is subject to rhythmical procedure, calculations having to do with his activities can be projected far into the future with a justification and certainty heretofore unattainable." The empirical validity of the Elliott wave principle remains the subject of debate.

Elliott wave diagonalHello guys :)
Today I'm going to teach you what diagonal wave is. The normal wave counts like 53535 but this wave has 33333 waves.
Most ending diagonals have a wedge shape like this one.
Follow me for more tutorials.
Cheers :)

Elliott wave truncationHello guys :)
In this Elliott we have something called truncation or failure. It's because wave 3 is too large and wave 5 cannot reach wave 3.
Follow me for more tutorials.
Cheers :)

Elliott Wave Extension 9 WavesHello guys :)
Sometimes we have 9 waves instead of 5 waves. This is rare.
Follow me for more tutorials.
Cheers :)

Elliott Wave ExtensionHello guys :)
In the previous tutorials we have taught you what Elliott wave theory is.
In this tutorial we're going to talk about extensions.
we have an extension in either wave 1, 3 or 5.
Follow me for more tutorial.
Cheers :)

Elliott Wave Theory RulesHello guys :)
The Elliott wave theory has 3 rules.
Follow me for more tutorial.
Cheers :)

Elliott Wave TheoryThe elliott wave consists of three impulse wave and two correction wave. And each impulse wave consists of 5 waves. And each correction wave consists one ABC wave. And after all it consists one ABC wave. It's like the number 53535.
Follow me for more tutorials.
Cheers :)

Elliott Wave TheoryElliott Wave Theory
What is the Elliott Wave Theory?
The Elliott Wave Theory came from Mr. Ralph Nelson Elliott in the 1930s. The Elliott Wave Theory said that there are five waves in the main trend with three waves in a correction. The smaller patterns together form the bigger pattern.
Pattern Identification
Wave 1, 2, 3, 4, and 5 run in the direction of the main trend. Legs A, B, and C form a correction pattern. Wave 1, 3, and 5 are impulse wave, which makes advancement in the direction in the current trend. Wave 2 and 4 are the corrective wave that travels in the opposite direction of the main trend.
Variation of Wave 1, 3 and 5
Legs A, B, and C are corrective waves following the 5 waves in the main trend. Leg B may appear in numerous variations. Leg B may have more than one rebound peak, and when that happens Leg C may be delayed. Leg B peaks may be high altitude or low altitude peaks. Leg B may appear in the form of bottoming patterns; however, the downtrend may follow in the form of a Leg C.
Variation of Leg B
Leg C may be a short or a long wave. An additional Leg C may follow immediately. The additional Leg C may be delayed if Leg B takes longer to complete.
Variation of Leg C
A truncation wave is usually a wave five that fails to move beyond the end of wave three. A truncation happens with uptrend and downtrend. Interpretation of the truncation varies in different charts, but a truncation may indicate a reversal is due, but not always.
Benefits of the Elliott Wave Theory
The Elliott Wave enables traders to make better price predictions and improve trade decisions. Knowing that Elliott waves 1, 3, and 5 runs in the direction of the main trend, then trading in the current direction of the security may sometimes be a more favorable bet. Knowing that Elliott wave 2 and 4 are corrective waves of the current main trend, then a trader may consider profit-taking. Knowing that Legs A, B, and C are corrective waves, then a trader may consider trading in the opposite direction of the previous main trend. Knowing that the truncation pattern is forming, this may be an indication of a possible trend reversal. There are risks involved in trading. Each trader has different risk tolerance. Knowing which Elliott wave the security is currently trading in may help the trader decide which direction to trade. Trading in the direction of the waves may reduce the trader risks.
Thank you for reading!
Greenfield
Disclosure: I am not a financial advisor. This is not a recommendation, not a representation, and not a solicitation. You should do your research and come to your own decision. Investment involves significant risks. You need to understand that you may lose your money. Past performance is not an indication of future performance. Chart reading is subjective information.

Elliot Wave Tutorial from 1998 till 2020Many Claim Elliot Waves are a false pseudo science. I present the last 30 years as an example, n a monthly time frame, the last part of the "Grand Supercycle" Bull Market Elliot predicted
The 1990's Wave I, ( The dot com bubble) complex and impulsive.
2000-2003 Wave II down, simple corrective ABC.
2003 until Nov 2007 Wave III Up Impulsive and Complex.
2008 until 2010 the IVth wave complex and corrective,this is the wave i have been posting about so much, as opposed to what most thought would be a V shaped Recovery
2010 until February 2020 Wave V comprised of 3 sets of 5 waves up. This is actually the Tripple Thrust pattern, 3 sets of 5 waves up, each and every wave contains waves inside it in lower timeframes
Feb 20th till Mar 23 Wave I or A wave
march 23 until April 30 th Wave B or Wave 4 (You have to go to a 4 hour chart to see the wave 2 ABC)
WE now have a lower high, and are beginning to see lower lows.
I don't want to spend 1 hour or longer labeling all the waves for you, the reader, so I give you a simple trick... Use your left hand under the pattern... 5 waves up, followed by an ABC
will allow your hand to fit up under it..


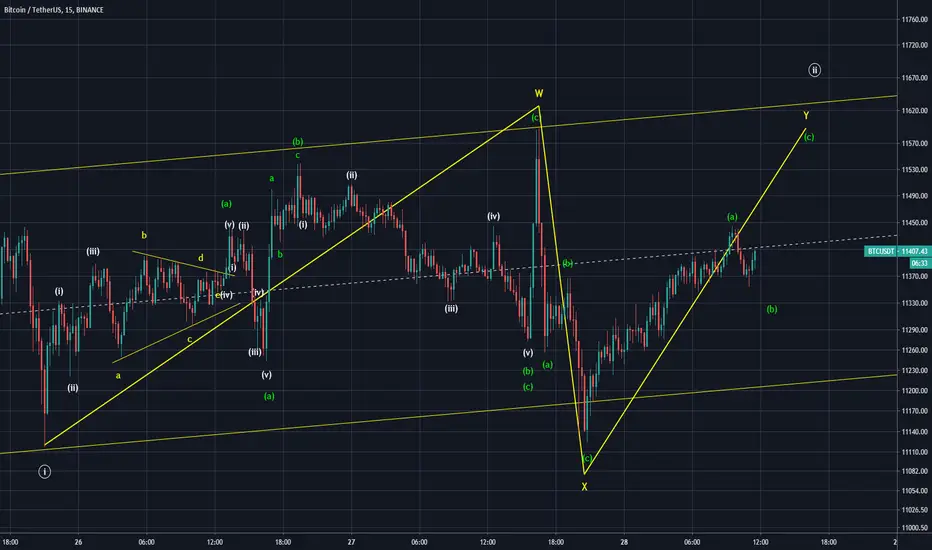
BTC 15 MINUTE FRAME OF ELLIOTT WAVE / DETAILED MICRO EW STUDYHere is how I count in a tight frame. Y of WXY has one more leg up to complete cycle of WXY correction or it may end right here so both are called irregular flat
We should see lower prices at BTC does not matter WXY ended here or one more leg left to go
USDJPY, triple Three correction Usdjpy is pointing at a new opportunity to sell with this corrective pattern.
This correction is one of the five types of corrective patterns that correct the completed cycle of the prevailing trend. Zigzags (5-3-5), Flats (3-3-5), Triangles (3-3-3-3-3), Double threes which are a combination of two corrective patterns previously mentioned. Then lastly a Triple three that is a combination of three corrective patterns mentioned above
The corrective structures are labeled as WXYXZ. They are an 11 swing structure. The subdivision of wave W, wave Y, and wave Z can be a zigzag, a flat, a double three of smaller degree, or a triple three of smaller degree. The Wave X can be any corrective structure including a stand-alone triangle

Basic explanation of elliot wave using GOLD Here's a short video for any new traders who want to learn the basics of elliot wave analysis. I made this for a friend but thought I'd just post it on a public platform so it could help others as well.
Pardon the quality! I've never made a video before so shall continue to improve in the future :)

Special Analysis IN the mid-term and long-term for USD/CADHello guys, in this technical analysis I want to speak you to Monthly from Daily timeframe what I expect of this par!!!
Lookin in Montly, we are in the elliot wave correction ABCDE, and that mean a possible bullish this pattern, because we are into in the ascendent triangle with expectative so bullish for long term!!!
But more important is this screenshoot above, we are into the elliot wave # 4 into this elliot wave correction above up this screenshoot This mean that USD/CAD it's can going to reach the $1.64 CAD, and now look in the past time how Canadian Dollar is going to devaluate agains the U.S. Dollar, that is horrible, and also there are a bad news for Canada that the country it's going to comming on a considerable cases of covid-19 and the situation of Canadian petroleum that I see in this country a strong reccesion for the CAD currency.
In weekly as you see in the monthly timeframe, we are complete the elliot wave correction D to find down the elliot wave correction E, and alter the USD to the moon against of CAD. But now the situation in weekly is that we are in the another into elliot wave that we are in the elliot wave 4 with chartist pattern called a bearish rising wedge. And also, I mark this elliot wave of this form because is the model of the possible drop in finished to find down the elliot wave E in monthly. And that support line is the base that form the ascendent triangle that you can see in monthly
And finally, to conclude in Daily timeframe, we are in this rising wedge mentioned above, this is so bearish pattern with a possible drop of 5% if you put in long in the elliot wave E, we can to find up sell off of this par, So, also, this par is so interesting in this timeframe to put in short position. But, if you trade in H4 or H1 timeframe, we can see a possible up of the price until to find up the elliot wave E into this bearish rising wedge that I show you. And copying the Elliot waves Fibonacci, you can to see the same question of Weekly timeframe, because we are into the elliot wave correction.
And guys, if you like my idea and aport you a help of then. So, consider this technical analysis for mid-term and long-term situation. Now in conclusion, in mid-term we can to expect that the price is reach the $1.30 CAD and this zone, it's the elliot wave E to put with hope the price action in weekly to put in long in the good zone to buy, but only we need to be patient and take a lot discipline, becuase I see in long term this par so bullish reaching above $1.60 CAD about all Canadian issues in the government, currency, petroleum and bad news for the Canada economy.
This is not my techncal analysis, but I put in tutorial as teach you how you need to operate of this par, and it's important to know you this information for mid-term and long-term. Now, don't missing my part II of this analysis in H4 in minutes that I will going to make now.

Special Analysis for EUR/USDin this technical analysis as education, we see an EUR/USD in long term very bullish. Why? Because there:
If you keep watching up, we are in the strong support and a possible formation of Bat armonic pattern bearish or double top, as you want to see, maybe it's has for me a double top, and very strongest because in the past in the accumulation of 2014-2017 we having a bullish trend until the 2018. But, so, we are in the possible bull run to form in long term, because indicators in the RSI show us a bullish divergence in Monthly, and this is a good indicator for this currency EUR. I see an Euro very optimistic their economies and there are a good indicators so what EUR is could be the strengthen in the long term.
In weekly, we have a very curious patter, because we are from August 2018 in the descendent and bearish channel from $!.17 USD from $!.06 USD, and then, in the RSI if you see, we are having in the ascendent channel in the RSI, and then, it's a good indicator what the force is strenghten on the price action. Also, as we broke up the descedent channel, we can to see a possible proyection and target again from the level of $1.24 USD. So, that it's a study of elliot wave analysis so we need to recover this information to take in our hand.
And Daily in midterm, we proyect a drop until the $!.11 USD to later of the elliot wave analysis, we need to see an Euro bullish in this bull run of 2020. And also, I detect a hide bearish divergence and it's very neccesary to the price drop in that zone as I estimated in my previously technical analysis. Also i added in my link of related ideas a updates of EUR/USD so recently from yesterday
That my friend, is all my technical analysis in Moonthly, Weekly and Daily timeframe, my expectative of the Euro is that I see that currency in the bull run agains the US Dollar.
