Playing with Gann fansThe gann fan is a powerful tool to find future trend lines. Watching price near these line could be one more arrow in your quiver...
Gann


Gann Fans and PriceTimeUsing Gann fans to visually see the mathematical relationships of price action over time.
Yes. the rabbit hole is quite deep.
Trade safe
M~

Using Gann Fans/Retracements with Impulse/Retrace Scaling Part 2Finished analysis of 2014 Nov Beans using price scaled Gann fans.

Using Gann Fans/Retracements with Impulse/Retrace Scaling Part 1How to setup simple price scaled Gann fans to determine support and resistance out in time. Gann's geometrical method advanced by scales derived from highs and lows in the wave formation to forecast future price expansion and SR zones.


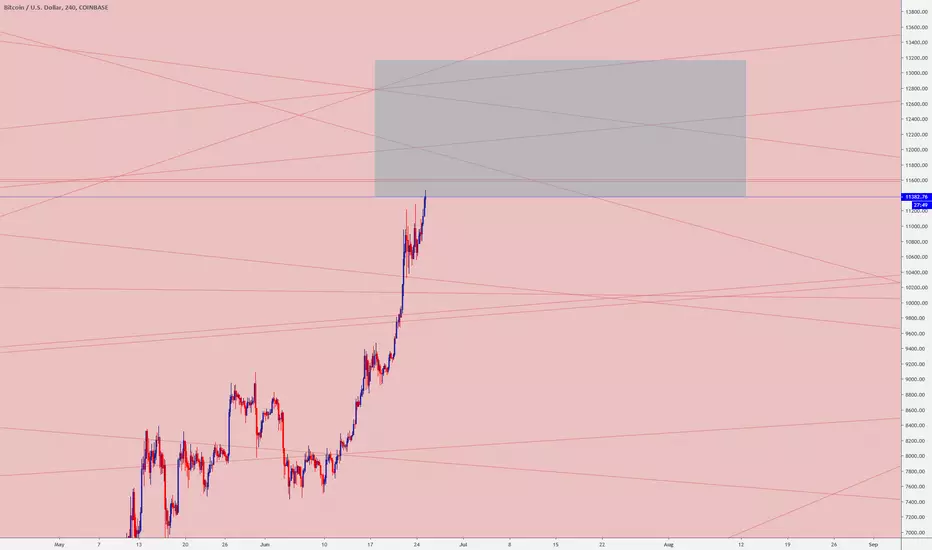
its dangerous to buy #Bitcoin , a lot of resistances waiting 4Uits very dangerous to buy Bitcoin now , it is a vibrational area based on Gann methods
Just wait and long it above this area
good luck mates ..
ETHUSDUsing my algo and Gan to predict the future. Will my my forecast come true. Let's wait and check accuracy soon...
Trade safe, mnovo

Total Market excluding BTC - Detailed Bonfire squaring/scaling Got my mic working so Audio included! As I mentioned this is a brief rundown for Bonfire setup and I will include more videos and screenshots soon. Check below for more ideas on this chart below.

Alternate trading strategyIn this video we use the APO-Absolute Price Oscilator in conjunction with the 21 day EMA and the 200EMA as aditional confirmations to enter and exit trades safely. We do give up some profit for security of strong trends instead further strengthening the avoidance of bad trades. While you can use this technique on shorter time frames, time is valuable. You could just check your positions 15min per day instead of staring at the screens all day and do something else like enjoying life and freedom.
Enjoy and trade safe...
M~

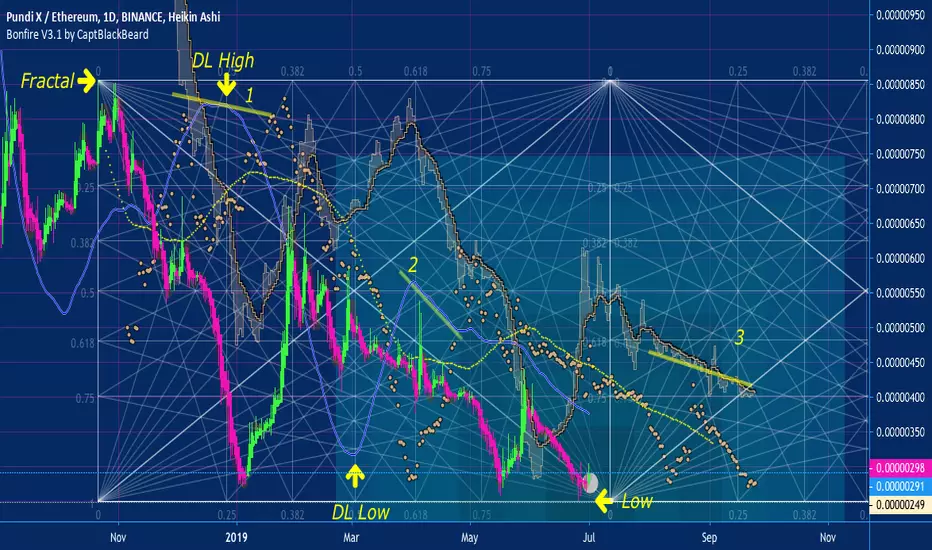
Gann Boxes with #Bonfire! Love the indicator by @BlackBeardCaptGann Boxes made easy with Bonfire
Method:
Use default Gann Fibonacci ratio and tick angles.
Align Driving Line with top and bottom wedges of the Gann Box.
Start Gann Box at a top/bottom fractal and align opposite edge with high/low.
Look for box alignment on 3 places with either the Driving Line or the Safety Net
Clone for future forecast

Excerpt of Mr. W.D. Gann methodsHey
Probably many of you already know that most important part of analysis by W.D. Gann methods is scaling. In other words how many pips are in one unit of time. This parameter is used in Gann fan (set of angles) and Gann Boxes (chart overlays).
The correct way to find out the scale factor is to calculate it from price swings.
Here us the rule: Each swing or impulse follows one of the angles. No exceptions!
I am posting here the monthly chart of GBP/USD with the scale I've calculated. My intention is to show how working angles and boxes look like, so you can verify you have found the scaling factor correctly.
Pay attention that intersection of angles gives points when we can expect reactions.


PLI and GANN sorcery or sacred math?Time and price are directly related at geometric intersection in the price/time continuum. Watch thru my ramblings as we explore Gann box fractals. you be the judge it this is another weapon for your arsenal

Let's get freaky with Gann Box Analysis and Time CyclesI have decided to help make a more in-depth analysis covering CSE:LHS since the stock is fairly new. The chart above is where we are currently sitting, which is on the bear side of the gann box but we will get into that later.
How I start drawing Gann Boxes:
Use the dynamic Gann box tool and draw from high to low or low to high;
Configure the settings to show only 1 & 0.5, set all others to zero and turn angles on.
Things to remember about Gann's time cycles:
Days of interest and should be watched are significant days in a given solar year. Any of the solstices and equinox's (Dec 22, March 21, June 21, Sept 23) and their important angles which are in increments of 15 from these days. This means that 15 days after these significant days in a solar year.
Gann used degrees in a circle to compute cycle lengths. The 360 degree in a circle is approximately the same as 365 days in a year. So he used 180 (half a circle), 90 (a quarter of a circle), 45 (1/8 of a circle), 135 (90+35), etc.
He also used eights of 90 for shorter cycles to calculate the trading days in a cycle. 1/8 of 90 is 11.25 days, 2/8 is 22.50 days, 3/8 is 33.75 and 4/8 is 45 days. 5/8 is 56.25, 3/4 is 67.50, 7/8 is 78.75 and 8/8 is 90. If we round these numbers we trading day counts of 11, 22, 34, 45. 67, 79, 90.
Step 1:
Draw the first Gann Box from Low to High so an entry point can be established on the pullback.
Step 2:
Clone the Gann Box over to find entry once a support line is reached on one of the increasing angles about the 45 deg line. I use other indicators to confirm entries and exits. In the chart below we can see support is reached on Dec 13, 2017, but MACD hasn't come close to crossing. The actual breakout is on Dec 28, 2017, when we see strong RSI, Stoch crossover and MACD crossover to confirm entry. Oddly enough this date is shortly after the Winter Solstice which Gann says is a date to watch for. Digging further we see a high made when it reaches one of the trading cycle counts of 23 which is right after the 22nd degree.
Step 3:
The cycle has ended with The Box now broken and invalid since the creation of a new all-time high. We can expect an inflection point here and we can now redraw the Gann Box from the low to this new high. Oddly enough this Gann box has a cycle of 77 trading days and if we look above at the important dates we are pretty close to Gann's cycle.
As you can see we break the bottom of the box and again have to redraw the box to establish a new position if we can see movement onto the bull side of the box.
Step 4:
Since the creation of the new box and cloning the box over we can see a few things. We begin with the inflection upward along the strong trend line which is confirmed by rising RSI and Stoch crossover. However, this rally doesn't last since we soon break down into the bull side and consolidates until we reach a new ultimate low.
Step 5:
Since the Gann Box has become invalid once breaking through the bottom we can now redraw a new dynamic Gann box which end's up being our most current. From here we will analyze this one a little bit further.
We can see a few things after we create a new box. We have reached an inflection point where a rally starts moving and continues along the bull side of the box. An entry here is promising since the indicators are confirming a strong trend is imminent. Eventually, we break below the 45-degree angle and enter into the bear side where a trade would be closed.
If we look at this pullback we can see that it hits an area of support when we apply Fibonacci. We eventually break below the 1x1 angle but are able to make a nice gain should we choose to.
Present Day Look:
Pay attention to where the close is relative to the angles and what the indicators are telling us.
Looks like we are on the bear side of the box with a weak trend and the indicators do not look promising.
Well, that is it for me on this. Tell me what you guys think, don't be afraid to start a conversation with me if you have charts and ideas to share.


Gann's Garden of EdenGann said the bible was the greatest book he ever read. He also said read it 3 times and truth would be revealed to you. But, it's not what you think... It was about math and cycles.

How to set up the GannBox I'm usingA brief video to illistrate how to customise your gann box settings


Keep the read simpleKeeping it simple with less noise will help you determine a general trend of pricetime and where it's headed. By using different candles, indicators and Gann angle relationships, you might be able to see a clearer picture outside your bias and belief of what a stock is going to do.
Did this help. Let me know. I love feedback...
M~

Think outside the "box"This video is to show you how far ahead Gann was ahead of his competition. The godfather of TA has said over and over so many times, that price and time are related. Here is just a scrape of what he meant. It takes years to follow understand how complex and yet so simple Gann TA can be. By drawing 1 line, one more layer of the onion is mathematically revealed.
