Massive sequence of RSI-Renko DIVINE™ Scalps Following Iran NewsThere were a total of 250-270 points of NQ scalps after the Iran missile strikes going long. If you held the first contract long on the swing trade (1st trade in the direction of the new trend is always the swing trade, marked by a fat arrow) you would have gained another 270 points.
Overbought

How to use my FG oscillator in conjunction with DFG oscillatorLooks like BTCUSD still have a little bit further down to go, but is winding up for a next significant pump.
DEMO of the use of my FUSIONGAPS (FG) and DIFFERENTIAL FUSIONGAPS (DFG) scripts, with my LIVIDITIUM indicators set.
Not a financial/trading/investment advice. Exercise your own judgement and take responsibility for your own trades. ;)
See also:
If you like this set of indicators, and it has benefited you in some ways, please consider tipping a little to my HRT fund. =D
cybernetwork @ EOS
37DzRVwodp5UZBYjCKvVoZ5bDdDqhr7798 @ BTC
MPr8Zhmpsx2uh3F5R4WD98MRJJpwuLBhA3 @ LTC
1Je6c1vvSCW7V2vA6RYDt6CEvqGYgT44F4 @ BCH
AS259bXGthuj4VZ1QPzD39W3ut4fQV5giC @ NEO
rDonew8fRDkZFv7dZYe5w3L1vJSE51zFAx @ Ripple XRP
0xc0161d27201914FC0bAe5e350a193c8658fc4742 @ ETH
GAX6UDAJ52OGZW4FVVG3WLGIOJLGG2C7CTO5ZDUK2P6M6QMYBJMSJTDL @ Stellar XLM
xrb_16s8cj8eoangfa96shsnkir3wctdzy76ajui4zexek6xmqssweu85rdjxrt4 @ Nano
~JuniAiko
(=^~^=)v~

Oscilator RSI- Crypto Low price on point A, elevated volume, is confirmed by reviewing stochastic RSI where we can see stock is over sold, and this will create variation on pattern and add volatility .
Same case works for point B, with a higher variation on price, and lower volume, but volatility is created, and stock is oversold.
Point C, has a price increase, which confirms volatility, and stock is over bought.

Simple Way to Read Oversold/Overbought Without RSIThis is how u can tell if a market is oversold (or overbought) by reading price and using our little 14EMA friend
After price has a large push down (or up) like you can see in the yellow circles, it retraces up to the green circles
In example 1, this yellow circle was right on the close of a huge bearish 4h engulfing. Perfect example to see how it is oversold by seeing the large gap between price and the 14 cyan coloured EMA
And the following day we see this happen again in example 2. price pushes fast away from the 14EMA and therefore it needs to breath and retrace a little. No body can continuously sprint, neither can markets! "After big drop, markets must chop"
Whether or not you have RSI on the charts, it is good to know when a market is oversold or overbought because nobody likes entering and seeing the trade go immediately negative, only to see it later where you thought after you closed in a loss
Another cool term for a temporary up trend in an overall down trend is a dead cat bounce! This is a very very short term version considering we are looking at the 15m tf here
~ The trend is your friend and so are retracements ~

1] How to use Traders Dynamic Index and Complementary OverlayTraders Dynamic Index serves for crossover signals and are essential for trade entries and most beneficial when identified on over 30-minute Time Frames as on hourly time frames.
I have made the options available of the oversold (green) 32 level line overlay which is useful in identifying potential buy zones/price.
In KK_Traders Dynamic Index_Bar Highlighting it is also good to note that in uptrends : RSI ranges between Upper Volatility Band, Lower Volatility Band and/or relatively "within" 68 and 50 level lines as it has been doing on hourly time frames on Bitcoin.
Direction and deviation of MBL overlay or Phaser from price is strong indicator of trend direction and price level/zone useful for those who are confused in knowing where price will have to average into.
Promoting free and highly useful Indicators:
KK_Traders Dynamic Index_Bar Highlighting
Traders Dynamic Index Overlay
"Price Action Channel Master by JustUncleL Restored"
_______________
I had not used these guides recently which I have currently published.
If anything (I ever do publish) varies contrary to these indicated guides and the coming guides to be published, the likelihood of failed forecast is augmented.

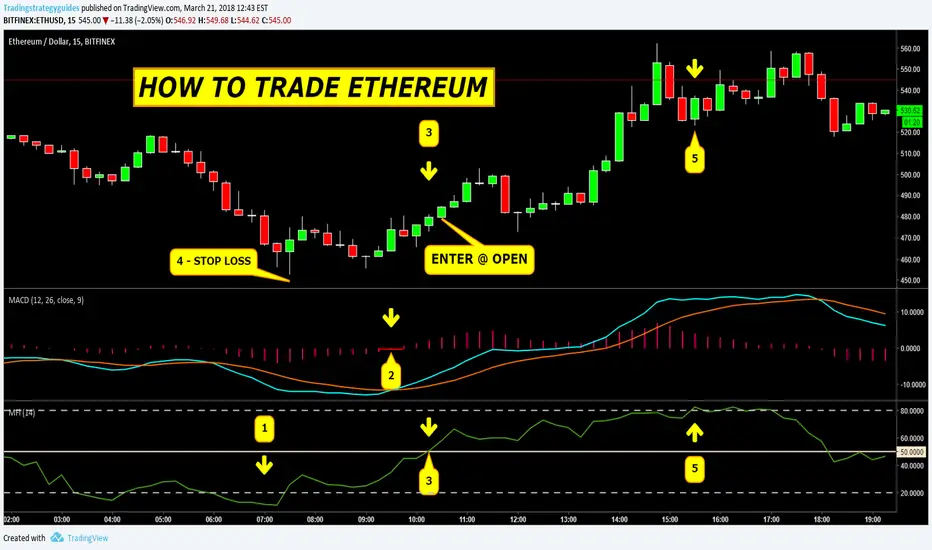
HOW TO TRADE ETHEREUMEthereum Trading Strategy
All we need for this trading strategy is two technical indicators:
The MACD – This is a momentum indicator that can help us spot a trend.
The MFI or the Money Flow Index an overlooked but critical technical indicator that measures the money flow into or out of a cryptocurrency.
The MACD is one of the most common indicators used by traders around the world in a variety of different markets to spot trades before they happen.
The MFI indicator is based on price action and it incorporates Volume in its calculation, which is quite similar to other oscillators. In other words, we can use the MFI indicator to measure buying and selling pressure.
We can use the MFI indicator to trigger entries and to take profits.
The easiest way to interpret the MFI indicator is that a reading above the 50 level represents an inflow of money into the cryptocurrency, while a reading below the 50 level represents an outflow of funds from the cryptocurrency.
The other critical MFI thresholds are 20 and 80. An MFI reading of 20 is considered bullish and oversold while a reading above the 80 level is considered bearish and overbought.
Step #1: Wait until the Money Flow Index drop below the 20 level
The first rule is that you always want to wait for the Money Flow Index to be in oversold territory. In other words, we need to have an MFI reading below the 20 level.
An extreme MFI reading below 20 suggests that there is very heavy money outflow from Ethereum. As history has repeatedly shown, this information can be used as a contrarian indicator.
The MFI indicator is not a standalone indicator. There are plenty of good cryptocurrencies that have high MFI reading, and most bad ones have low MFI reading.
So, in order to use the MFI indicator, we need to check it against other technical indicators which are the reason why we also use the MACD indicator.
Step #2: Wait for MACD histogram to break above the zero level
The second rule is to wait for the MACD histogram to turn positive. This is a confirmation that the bullish momentum is starting to build up. Now, we have two rules in place, but these are still not enough to trigger an entry.
Indicator-based strategies are very unpredictable which is the reason why we’ve added another confirmation signal before to enter and buy Ethereum.
Now, we’re going to lay down a straightforward entry technique for Ethereum trading system.
Step #3: After MACD turned positive, Buy after MFI also breaks above the 50 level.
As an extra measure of caution, we also like to wait for the MFI indicator to break above the 50 level before to buy Ethereum.
A reading above the 50 level represents an inflow of money into Ethereum which is the moment when smart money is stepping into the market. We want to trade alongside smart money to really make a profit trading the cryptocurrency market.
Step #4: Place Protective Stop Loss below the Previous Swing low
In order to minimize our potential loss we want to place our protective stop loss very close to the market price but at the same time at a price where it should really invalidate our trade signal.
For the Ethereum strategy, the ideal place to hide the stop loss is just below previous swing low. You can always add a buffer to protect yourself in case of a false breakout.
Step #5: Take Profits when the MFI enters Overbought territory or above the 80 level
When it comes to our Ethereum take profit trading strategy we want to cash some profits at the first sign that the market is about to turn against us. Otherwise, we risk given back some of our hard earned gains.
The first indication that the market is about to turn is when the Money Flow Index enters into overbought territory. In other words, when the MFI breaks above 80 levels, we take profits.
Use the same rules for a SELL trade – but in reverse.
Ethereum has fundamental advantages that hopefully will help Ethereum price suppress Bitcoin in the coming years.