Day trading NASDAQ and making over 9,000 on itHey traders!
This is a short clip of a recap of the trades we've taken on NASDAQ / Us100 today.
The video explains our strategy in brief detail and goes over the reasons why we traded NASDAQ long today (and we continue to do so towards the close of the day also).
We are full time day traders, we only focus on day trading and we've recently made major update on our strategy, this video explains a little more regarding the strategy
Profit

Some important questions & answers (for beginner investors)Today we prepared for you several questions and answers that might be helpful to new investors. Please feel free to post your own questions and answers in the comment section.
What is technical analysis and why does it work?
Technical analysis is a scientific discipline that analyzes investments by evaluating statistical data (usually price and volume). This method works because of fractal nature which represents the ability of same price patterns to appear across multiple different time frames independently. This applies also to patterns observable in oscillators, indexes and other technical tools.
What trading systems are the best performing ones?
Best performing trading systems are trend based. Purpose of such trading systems is to identify the trend and then „ride it“ – which means investing in its early stage and taking profits in its latter stage.
Which time frame is the most reliable?
Generally, bigger time frames are more reliable as opposed to smaller time frames. Though, patterns and trading signals usually take longer to develop when using a bigger time frame. Most common time frames are: 1-hour, 4-hours, daily and weekly.
What is leverage? Is it a really fast way to make money?
Leverage simply represents borrowing money in order to fund an investment. For example, when a trader uses leverage with ratio 1:10 and underlying asset moves by 1% then leveraged asset moves by 10% in the same direction. Leverage is definitely one of the possible ways to generate money fast. However, it is also a quick way to lose money.
Should I use a leverage when I am new (unexperienced) investor?
Use of leverage by new investors is pretty common as it represents an enticing opportunity to make money fast. However, in our opinion, an unexperienced investor should not use leverage at all. That is because leverage is very difficult to manage and its use by an unexperienced trader usually results in loss of capital.
Is it possible to time exact market tops and bottoms?
Timing exact market tops and bottoms is incredibly difficult even for an experienced trader. There are several technical tools at disposal of a technical analyst which he or she can use to indicate market reversal points. However, picking these exact spots is not necessary in order to turn profitable in trading. As mentioned previously, best performing trading systems are trend based. Such trading systems work by identifying trends and by exploiting them (without requirement to identify exact market top or bottom).
What is diversification? Why should I implement it?
Diversification is one of the possible ways to manage risk in the portfolio. It simply stands for diversifying capital into multiple different investments rather than focusing capital in a single investment. Proper diversification protects investor's capital from price fluctuations within particular market sectors. Additionally, it is crucial in order to build a long-term lasting portfolio.
Should I invest in the stock market when it just reached all time high?
Probably not. Usually, the market tends to pull back when it reaches a new all time high. Therefore, in our opinion it is not best to add to the long position just when a new all time high was reached by an asset. One of the best strategies in a strong bull market is to add to the long position when price drops and then sell the position once an asset reaches new all time high.
Should I invest in an asset just because it fell 90% in value recently?
Not necessarily. Fall of such high magnitude does not necessarily mean that the price trend will reverse. There may be various reasons why an asset fell by so much; and therefore, doing your own due diligence is highly advised before entering any trade.
Is past performance of an asset indicative of its future performance?
No. Past performance of an asset should not serve as a basis for predicting future performance of that same asset.
Should I use options/other derivatives as a new trader?
There is no restriction to use options as a new trader but derivatives in general are more complex instruments than stocks or bonds; additionally, their price is determined by numerous factors that an investor should be aware of. If a trader does not fully understand how some asset class behaves, then he or she should avoid such a particular asset class.
Should I keep holding a losing position?
It depends on the investor's own assumption but in general it is better to close positions that keep losing to prevent further losses and to be able to use capital somewhere else.
I feel I haven’t made many trades in the recent past. What should I do?
Trading is not about making enough trades but about generating profit. Sometimes there are not enough opportunities in the market; making too many trades could lead to entering positions that a trader is not fully comfortable with. Also too many trades reduce profit due to trading fees being stacked up. So if a trader can not find another opportunity to make a trade, the best solution is to take a “break” and to keep looking for the next opportunity rather than force himself or herself into trading.
DISCLAIMER: This analysis is not intended to encourage any buying or selling of any particular securities. Furthermore, it should not serve as basis for taking any trade action by individual investor. Your own due dilligence is highly advised before entering trade. This content serves solely educational purposes.

When/How to move SL to BE and to profit in a running trade ?Hello everyone:
Today I want to discuss a topic in Risk Management, specifically on when and how to move your STOP LOSS to BREAKEVEN or in PROFIT when you have a running profit trade/position.
In an impulsive phase of the market, we want to make sure to protect our entry as well as secure profits.
In this example of EURUSD, I managed to get 2 entries in, and manage it to my best ability and secure profits
Trade close down for +7.9% profit
Original Trade Forecast and Analysis:
This is a topic that will have various answers across traders, as this is certainly up to each individual trader’s strategy, style, and management approach.
So understand there is no right or wrong, “holy grail” kind of decision.
It's up to you individually as a trader. I will share my management, and why I choose to go with these types of approaches, and you can certainly use them to your advantage to tweak/modify them to fit your strategy.
Few things to keep in minds are:
1. Moving the SL to BE or/and in profit is a way to protect your entry, as well as secure profit.
2. Sometimes moving the SL too early may “choke” the price, and you can get stopped out for BE or small profit. Then watch the price take off in your desired direction, which can create negative emotion.
3. Whereas sometimes if you don't move SL to BE or in profit, you can watch a trade that hits 3:1 RR or more, end up reversing down, passing your entry point and to your actual SL of -1%, which can also create negative emotion.
4. No perfect scenario or management when it comes to the aspect of trading, as every trade is unique, and different outcomes may happen, since the market itself is not perfect, and can do whatever it wants to do.
Now, I will explain my own management when it comes to moving SL to BE or/and in profit.
Certainly this is NOT the only way, nor it will be the best way, but over the years of backtesting & chartwork have given me reassurance on these types of management ways.
I will then show some real live examples on the trades that I closed down, and how I manage them as well.
CADJPY -
Original Trade Forecast and Analysis:
GBPJPY -
Original Trade Forecast and Analysis:
CHFJPY -
Original Trade Forecast and Analysis:
NASDAQ -
AUDNZD -
Original Trade Forecast and Analysis:
First, a general rule of thumb for me. IF the price has hit about 1:1 RR or so, and has broken past the previous recent lows,
I will move my SL to BE. There is no exception in this rule.
Again, I explained earlier that sometimes this will help you to protect your entry when price reverses, and sometimes it will choke the price.
In this case, I would rather take a BE first, and re-look for entry again in the same position, as long as the bias and the price action is still valid on both the higher time frame and lower time frame.
Second, once the entry is in some profit, say 2:1 or higher, I generally will move the SL up to about +0.5% profit or so.
Just want to secure a little profit while not choking the price entirely.
Third, once the entry is in 3:1 profit, then I will move my SL to +1% profit.
This is where I generally will decide whether I should take full profit here, or hold the trade for a mid-long term if the higher time frame has given me the bias.
Fourth, since the trade has already been in 3:1 profit or higher, generally we can expect a continuation correction to form now after the impulse phase.
If it's a smaller correction and price isn't reversing up sharply right away, I will move my SL to about +1.5% profit, set my alert above the continuation correction and observe the development of the correction.
This is generally a point where I can decide to hold the trade longer, or if it reverses up from the continuation correction, then exit the trade for profit.
Fifth, if we start to see a possible reversal development, then I will move down my SL to the recent swing highs/lows,
or just above the reversal correctional structure, and will let the trade tag me out for profit if it reverses.
Any questions, comments or feedback welcome to let me know :)
If you enjoy these contents, and the educational lessons are helpful, please press like, subscribe and follow for more.
Jojo

Can we create the strategy that can wining the market??Hi guys, im guaddi min homie.
I will give you two options:
1. Have stable profits in the market on a regular basis
2. Get rich quick in a short time but potentially lose all your profits quickly
You will definitely choose the first option,right?. You've heard a lot of people make hundreds of thousands of dollars a day, but that's just the surface,maybe make a profit today, but the next day they will lose more than your profit. In fact, anyone can make money from trading but there are quite a few people who make a steady profit. When people enter their trades on impulse, they can make a profit for a while but can't make a profit in the long run.If you want to be a professional in trading, you must create your own trading strategy. Are professional traders good predictors of the future??? That's definitely not the case. We think we have to learn a lot of this, a lot of that, this indicator, this candlestick pattern To be able to accurately predict the next direction of the market. And of course that's not the case. The key of succes trading is the trading strategy have a good RR ratio and reasonable winrate with that RR. Or perhaps, in some cases your win rate can be very high along with the profit is also very large.
To create a stable trading strategy according to the price action method or indicator, the first job is to identify the trend. You can use moving averages or draw trendlines. You can refer to strategies on youtube, forums or create your own strategies with indicators, or simply just resistance, support,...Remember no one strategy can has a 100% win rate,like I said, the win rate is just enough and the RR rate is good.
I have a position with 100 USD account, if I win I get 1.5 USD if I lose I lose 1 USD but the win rate of this order is 50%,For every 100 orders like that, my average profit is 25 USD. However in trading, we can raise 50% win higher or 1.5 USD profit to 2 USD profit. You can set a fixed stop loss for example 2USD ,5USD and set the take profit 1.5 times the stop loss.Your risk should only be from 2-4% of your account. Doing so, in the short term you may lose, but in the long term, you will definitely make a profit.
I don't rate strategies with high win rate but low return/profit .I just need a strategy that has a 50% win rate with a RR ratio of 1/2 or 1/1.5
Your trading strategy may have a losing streak of up to 5 even 7, but your win rate is 50% with RR ratio 1/2.So in the long term you will never lose.Such losing streaks are extremely normal and you don't need to worry because you still have a long term advantage.
I have met people who every time they lose 2-3 in a row the emotional side kicks in and they start trying to develop a better strategy, despite having thoroughly tested their strategy and knowing that It is very beneficial.Because they don't stick to that really good strategy.
If you have created a really good strategy for yourself then congratulations, you have a formula for winning the market, all you need to do is be patient and patient,the ratio is quite high in the case that you should not break the trading principle(In cases, you will have to make decisions and those will help you to grow up), and remember just follow the trend.
See you in my other posts, thanks.

an adviceplease pay attention my advice. on next my posts, I am going to send my trade records history.
Mr ATASH

Market PhasesHello guys, I am here to talk about the different market phases and to explain you how important they are.

This is ALL you need to be Profitable in TradingGood morning traders! Today we will make an educational post about something that generates many doubts in many people:
That is, what are the tools that I should use to trade correctly? Do I need indicators? do I need extremely complex strategies? The answer is DEPENDS.
Why does it depend? It depends because there are many ways to see and trade the market, and just as there are thousands of traders, so there are also thousands of strategies since there are many ways to combine the different tools that we have. That said, it is worth clarifying that this post is made 100% from our experience, and the objective is not to discredit or downplay other trading methods. This is simply what we use, and for a long period of time, it has served us well.
We will divide this post into two parts, first, a theoretical explanation of each tool, and second, show how we apply the previously explained concepts.
🔸Price action:
This is the first concept that we must cover since it incorporates everything in a certain way. The price action, basically, is the behavior of the price. Depending on the market situation (trend, either bearish or bullish or in range), we may see different price actions. The technical analysis starts from the basis that the price action discounts everything necessary to decide on an asset; therefore, everything that is happening, the price is transmitting in its behavior. For example, if the price is in strong support, and we see that a candle with a lot of volume appears, and it forms a candlestick pattern (suppose bullish engulfing), clearly the price action tells us that there is strong buying interest. This applies to all scenarios; we can also consider a breakout of a structure or correction that closes with a strong candle above the previous high, and so on with infinite cases.
Example of price action in support (real situation in USD / CAD in Weekly Chart):
🔸Trendlines/channels:
This will be a determining tool when defining a trend. Depending on which market or timeframe we trade, we will see more or fewer trends, but they are a very comfortable visual way of marking them. In the case of an upward trend, the concept is based on joining the increasing lows with a line and the same with the increasing highs. Same situation for a downtrend, but with the highs and lows in reverse. The price tends to respect these lines very well, bouncing off them every time it touches them.
Example of trend lines in channel form in EUR / USD Daily Chart (Real example):
🔸Support / Resistance Zones:
The Support and Resistance zones are horizontal and static supply and demand zones. As we saw previously in the trend lines that the price reacts (these are considered dynamic supports and resistances since the value changes as time progresses), the same thing happens here, since they are specific places where there are many buy or sell orders. The key is to wait for a reaction in the price in that area to confirm the movement. When the price moves for a long time between support and resistance, we can say that it is within a range. This usually happens after periods of a powerful trend, where the price begins accumulation/distribution consolidation processes that last a long time.
Here, we have an example on Amazon (AMZN):
🔸Corrective Patterns:
This is a particular concept since it is focused on momentum/trend traders. This trading style is characterized by taking positions that are always in favor of the trend, and corrective patterns are an exciting time to join the movement. These patterns happen after impulses; if we have a strong upward movement, then once the price starts to retrace, it will form a correction pattern in the opposite direction of the trend. They are very useful to be able to join the next trend.
Real example on Facebook (FB):
🔸Risk Management:
The basic idea of risk management is to be able to earn as much as possible but always keeping losses as low as possible, and of course, avoid destroying an account. It is very common to see traders who try to "duplicate" accounts or obtain exorbitant results in very short periods of time. Is this possible? Of course, YES, but we must ask ourselves whether this is functional in the long term, and the answer is NO. OBLIGATORY, if we take high risks, we will lose a lot of money after a certain period of time. This is very simple, trading is a game of statistics, and streaks exist either for better or worse.
There are certain basic rules, such as the % risk of the total capital in each trade. For example, if we have an account of $10,000, a conservative and correct risk to assume, it would not be more than $300 per trade, which implies 3% of the total capital. We recommend risking that value as much as possible, and even the optimum is a little less. We handle ourselves with risks between 1-2%.
Assuming real situations, there are bad streaks of trades that can reach 10-15 consecutive negative trades. Assuming a risk of 2% per operation, we would have a maximum loss of capital of 30%. In this way, we can stay in the game for the long term. Never forget that capital is the raw material of labor, and rule number 1 is NOT TO LOSE IT.
🔸Psychology:
When it comes to trading, thousands of emotions appear that go through our heads, both positive and negative. We will feel fear, euphoria, anxiety, greed, depression, excitement, happiness, and infinite emotions depending on the situation in which we find ourselves. The objective of working on psychology is, obviously, to reduce these sensations, but more importantly, it is to ensure that they do not affect us in our daily work. In the end, we are human, and we will always feel emotions, but the goal is that they do not negatively influence our trading.
In the first place, to reduce negative emotions, we must necessarily know perfectly the statistics of the strategy that we are carrying out. This implies knowing what your return is, what period, maximum loss, how long it will take me to recover it, etc.
On the other hand, it is necessary to perform a backtest to know how it behaved over time and if what I see at the moment is correct. In this way, we will have peace of mind when operating.
We must never forget that this is a business, and expectations must be long-term. Do not measure the result in days or weeks. Look at it in months, quarters, or years. In this way, the results will be more representative.
🔸With the concepts explained, we will see how we can unite them all to take a trade. Although they are all useful, individually, they do not serve us to take a trade. We must unite them in an organized way to use them to our advantage.
We will show you some positions we have taken over the last few months (some already closed, others active).
Bullish Trade on INTU:
In this trade, we see a clear uptrend. The price, after making a maximum, was consolidating for a few months. We detected a clear corrective pattern and took a bullish position once it was broken to the upside. The entry was above the previous high, the stop loss behind the low, and the target in the Fibonacci extension (this concept is not explained, but we can make an informative post later if you want). The risk assumed was 1% of the capital, with a potential gain of +2.5%. The position is open but near the take profit.
Bullish Trade on FB:
Similar scenario to the previous one. Price builds bullish momentum and then corrects. We operate the correction breakout, assuming a risk of 1% with a potential gain of +2.4%.
Bullish Trade on FB (short-term):
This is a trade that we take in addition to the previous one; it is an internal trade. Here, we also incorporate the concept of support/resistance. There was a broken resistance to the upside, and then the price generates a throwback (retest). This setback forms a corrective pattern, which gives us a good opportunity to enter the market—assumed the risk of 1% with a potential gain of +2%.
Bullish Trade on GOOGL:
In this trade, the price breaks the upper end of the bullish channel and begins to correct at the edge. We see a clear consolidation, and we trade the bullish breakout. This trade is already closed with a profit of +1.75% with an assumed risk of 1%.
Of course, not everything is so nice, and there are also stop losses.
Bullish Trade on TLRY:
In this trade, the price breaks the descending trendline and the resistance zone (then support). It generates a corrective structure, and we take a bullish position at the break. The price was a bit in our favor, but then everything turned against us, and we jumped our stop loss.
🔸 This is a small sample of certain technical analysis concepts and how they can be applied to the market. There is no complex science here, no confusing indicators. Simply clear trends, trade-in that direction, and interesting profits with limited risks. That's all it takes to make money on this.

How to maximise profit while capturing a trend in crypto tradingQuick glance: We have come up with another tutorial to maximise the potential of MACD in capturing a trend. In this tutorial, we discuss the use of MACD in different time frames in crypto-trading.
First let us understand how is the MACD histogram calculated?
The MACD-Histogram measures the distance between MACD and its signal line (the 9-day EMA of MACD).
Like MACD, the MACD-Histogram is also an oscillator that fluctuates above and below the zero line.
But then, MACD is a lag indicator! Then how do we predict future movements with it?
Since the Signal Line is the EMA of the MACD line, it lags the value of MACD. Therefore, when MACD > Signal Line, the market has an overall positive sentiment. When MACD < Signal Line, the market has an overall negative sentiment. Thus when MACD Histogram is positive, bullishness is anticipated. When MACD Histogram is negative, bearishness can be anticipated.
Hence the following buy/sell signals can be generated:
Buy when:
MACD Histogram > 0
MACD crosses up Signal Line
Sell when:
MACD Histogram < 0
MACD crosses down Signal Line
T1: 1D timeframe
T2: 1H timeframe
Please note:
The fact that there were minimum/none false signals generated shows how beautifully we filtered the false signals using MACD Histogram in multiple time-frames to determine the overall trend first and then generate the buy/sell signals.
-------------------------------------------------------------------------------------------------------------------------------------------------------------------
Any feedback and suggestions would help in further improving the analysis! If you find the analysis useful, please like and share our ideas with the community. Keep supporting :)
- Mudrex

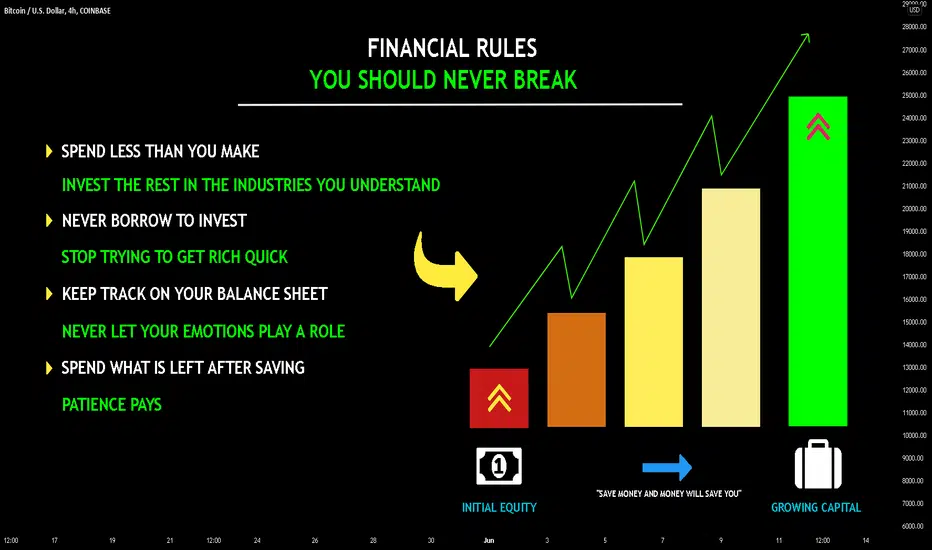
BASICS OF SAVING & INVESTMENT | RULES YOU SHOULD NEVER BREAK
Debt and living on credit is a universal norm .
While the "wisest" among us are trying to persuade themselves how they "hack" the system buying on credit card smartly, the richest among us keep following totally different commandments .
You must remember that debt makes you dependent , it makes you submissive to the system.
To become truly free and wealthy, here are the simple rules that will change your life if you follow them:
1 - Spend less than you make
2 - Do not save what is left after spending, but spend what is left after saving
3 - Invest the rest in the industries that you understand
4 - Never borrow to invest
5 - Stop trying to get rich quick
6 - Never let your emotions intervene
7 - Patience pays
The rules by themselves are very easy and straightforward, however, most of us are not disciplined enough to follow.
Learn them, try them, practice them and one day you will become free!
❤️ Please, support my work with like and lovely comment !❤️
It truly helps!
Thank you!
Trading Basics Part 1:How Candlesticks Work!
Hello,Traders!
Japanese Candlesticks are thought to have been invented by the Japanese rice traders
And then made their way into the West where they were used for stocks, forex and commodity trading.
Reading candlesticks is quite easy: the body represents an area that indicates the price distance between the open and close of the candle, while wick’s ends indicate the full magnitude of the movement in-between open and close. Thus, when picking the timeframe for your chart, you are deciding on how much time will be contained between open and close of each candle.
If open is below the close, the candle is bullish , and if open is above the close, the candle is bearish , which is usually represented by different colors of the bodies and wicks on the chart, typically, green and red.
Some of you might ask me, why am I explaining things that seems to be obvious and self evident, yet my experience of Coaching, paints a different picture, with thecandlesticks being undervalued and misunderstood by many, despite them being the staple of technical analysis .
In my trading strategy, which is based on multi timeframe top-down technical analysis ,
we examine multiple timeframes, from 1 week to 1 hour, going from higher to the lower timeframes. Looking for strong levels on weekly and daily and for patterns and confirmations on 4 hour and 1 hour charts. Which means that we are opening 1 week/1 day candle like a Russian doll, finding multiple candles inside the other. We enter the trade only if we are getting the same bias on all timeframes that were of our interest!
If you found my post helpful and interesting, please, like comment and subscribe!
Thank you!

SXP BTC Reversal analysis & tutorialSome tips to identify a reversal, minimise risk when choosing where to open a position and identify targets to close the position with less risk and more profit.

selby_exchange - Selby Margin Trading Rules v1.1Selby Margin Trading Rules 1.1
1.Trading Working Hours: 01:00UTC Monday thru 21:00UTC Friday take off all weekends and holidays. Only begin margin trading after 30 minutes of reviewing all instruments and timeframes.
2. Margin Forecasting: Charts are built on the 11/15min. using data from Heikin Ashi candle wicks. Identify entry/exit on the 1,2,3min. chart using moving average crossover intersections based on the Fibline Glance indicator set to: 100,100,0.1,40,0.1
3. Risk management: Maximum leverage on any position long or short is 70X. The position size should be based on weekly "working capital" and not total life savings. Formula for position size is a 5X position can use up to 95% and a 70X position can use up to 30%.
4. Enter limit order long/short and then set limit exit to take profit (TP) at the next short term Fibonacci level. Moving average crossovers in higher timeframes 14,21,33,48min. the 1-6hr. and 1day will confirm market direction for successful trade.
5. "THINGS TO AVOID" Greed - Bragging - FOMO
6. -2%-20% RULE: Always close negative positions. Look for a retrace opportunity to exit but if trade falls below (-2% on a 5X) or (-20% on a 70X) for more then 30min. set a stop loss limit order to prevent loss of time and a potential liquidation.
7. 60/40 Split: To maximize margin profit, stay out while awaiting confirmation of market direction, the entry must be caught at the Fib. Think/Chart 3-steps ahead, do not rush yourself into a position. Wait a few minutes between entry/exit. "3-Strikes" If you have three bad trades during the workday stop for 24hrs.
8. (TP) TAKE PROFIT: Cash-out at the end of the week into btc/fiat and pull 10% of net gains out of cyberspace forever. Work as long as you like on any day during the week, but remember not every day of the work week is always a good trading day.
Selby finding creative patterns in charts on Tradingview
Not advice for investing, but I am one to watch
Rebellion=Change=Future

Rolls Royce Trade Review - 20% profit in just 3 weeks!Hi traders,
This is the first in a series of trade reviews that I will be doing for TradingView viewers where each week I will review one or two of my trades. We will outline why we entered them and also how they went.
This is meant only for educational purposes for you to learn some of the skills that I implement when trading.
In this trade I used a very simple break and retest of a key level as the investment strategy.
If you have any questions then please let me know in the comments.

The continuous feedback loop of a successful traderDo you know what’s more important than winning in trading? It is knowing exactly why you actually won . Why? So that you can do it constantly. Needless to say, it is equally important to know why you lost when you lost.
The successful trader is constantly winning money, no matter the conditions. The economy may be in recession … or not … Algorithmic trading may be accounted for most of the trading volume. The volatility may be over the edge or down to ridiculous levels due to the summer holidays. So what … these are all part of the job . You need to make money because this is your job and if you complain and blame external factors for your poor results then think about choosing another profession.
Many would ask how is that possible … to constantly make money in ever-changing markets? Among the other 999 little things, your overall strategy is built upon there is one directly linked to your consistency. That is the continuous feedback and adjustment loop of your trading approach . This is where your post-trade analysis takes place and where you should find out WHY you won or lost.
For a discretionary trader, this feedback loop is not an easy thing to put in place, but it’s crucially important to have it. Because, the more useful you want the feedback, the more accurate the analysis should be. The difficulty of building the whole feedback mechanism is finding a fine balance between the depth of the trading details you take into consideration and the time and effort needed for analyzing them. From personal experience, I can tell you that you may fail to have a useful mechanism if you are too superficial. You might as well get lost in “analysis paralysis” as well as if you go too deep. That level of needed compromise is somehow personal. You know you’ve reached it when it can answer the following questions:
1. Is your selection technique giving you enough opportunities per your time frame?
2. Are your entries able to give you the price moves you want?
3. Are your exit techniques able to cut your losers short and let the winners run?
If the answer is “No” to any of these questions then you need to ask the next question “Why?” and dissect the effectiveness of that particular technique. Be ready to do the required adjustments if necessary.
There is a point in a trader’s career when being able to answer these questions alone will be more useful than an advice from the mentor. From that point on you can be on your own.

Do not gamble on earnings This stock is a perfect example of why you shouldn't yolo trades on earnings. The pattern looked great, and the stock is very bullish and also in a great sector. However, something happened on earnings. I don't really care what happened all I know is it effected the stock price severely. The thing about earning is that a company could come out with the best possible news but end up still tanking the stock price. Why? I have no idea and neither do you. best bet is to not trade earnings .

Trading Psychology 101: DevotionYour beliefs shape the way you live life. Change your beliefs, change your life.

UPDATE: XAUUSD DEMAND ZONE REJECTIONAs posted last night in my analysis. We saw an amazing rejection off the 4h zone. Amazing 1:4 risk reward. Key levels are the most important

UPDATE: GBPJPY 4h Zone RejectionAs posted last night in my analysis. We saw an amazing rejection off the 4h zone. Amazing 1:5 risk reward. Key levels are the most important

XAUUSD GOLD SUPPLY AND DEMAND ZONESXAUUSD GOLD SUPPLY AND DEMAND ZONES. Identifying high volume levels is very important. The reason behind this is because in high volume levels there are unfilled orders from the banks which are pending to be activated once price returns to that area. My trading is based off 4h with high level zones.

RVI TUTORIAL OIL EXAMPLE 5/5 WINNERSSo I am going to breakdown an indicator that I have featured alot in my trades, so if we look at the crude oil chart here, we can see that in total we have 5 notable crosses of the rvi indicator, 3 bearish trades and 2 bullish trades for a total of 510 pips, 5 winners out of 5. Now the magic of the indicator is that it is both an entry signal and an exit signal, enter on cross exit on cross to maintain maximum pips. Personally i find relative vigor index very useful when used in conjunction with good trading ideas and good structure analysis

UPDATE: GBPJPY REJECTS AND SHOOTS OFF FROM DEMAND ZONEUPDATE: GBPJPY ANALYSIS REJECTION. Beautiful trade today with an easy R:R of 1:4. This zone had formed on Wednesday and we had waited for price to return to this area. As you can see it was a really power zone sending the price back up.

Predict your future profits with EXPECTANCY formulaEXPECTANCY is a formula you use to determine how reliable your system is.
You should measure all your trades that were winners versus losers, then determine how PROFITABLE your winning trades were versus how much your losing trades lost.

Risk-To-Reward-Calculation with Key-Components.________________________________________________________________________________________________________________________________________
Hello Traders Investors And Community.
Welcome to this educational idea about the risk-reward-calculation in position trading with the 5-Key-Components determined. Today's markets constantly
changing and adapting and in such environments, we need to stick to a systematic trading approach to have the long term goals realized and do not fall
apart of market-making and smart money operators, when considering position-trading there are some important steps in acquiring the long-term-success
we should take apart when calculating the right risk in comparison to our capital and other key-steps to measure what trading is the best for ones
individual trading-system to achieve the aims we desire.
Therefore I contributed the 5-Key-Components inevitable to measure one's risk-to-reward in the market and best applied in a functional trading-system.
1.) The 5 Key Position-Trading Rules
2.) Acknowledging Risk Aversion
3.) Risk-To-Reward-Calculation
4.) Risk-Reward-Ratio vs. Winrate
5.) Possibilities of Success and Ruin
________________________________________________________________________________________________________________________________________
1.) The 5 Key Position-Trading Rules
1. First Rule: Do not hold the position longer than necessary:
It is important to choose a trading-system which has good entry timing and the right opportunities to exit therefore it is the best to be in the market when
volatility increases and takes profit at the important levels to not hold the position unnecessarily longer.
2. Second Rule: Aim to make as much as possible by risking as little as possible:
When trading we should advance by making the most of what we have at hand, today's markets offer options with leveraged trading which can work also
with smaller percentages of the deposit at hand, in this case, the leverage should be calculated right.
3. Third Rule: Only risk a small amount of capital on any trade executed:
It is commonly under beginner traders to risk a high percentage of the total deposit, this is a fatal mistake as the risk grows exponentially, to achieve security
of the deposit in the long-run, the maximum risk per trade should not be more than 10% from the deposit, best is 0.5-2%.
4. Fourth Rule: Don't come to the situation to meet margin calls:
This means you should avoid being marginally called on any occasions, when this happens there is evidence that the trade was too risky and the stop-loss
better be placed before the margin call, when it happens, it should be a time to review your trading-system.
5. Determine the maximum drawdown for every trade in advance
Before every trade you should measure how your position size with the stop-loss will possibly take a drawdown in the deposit. When the risk is too high
then the smaller position should be preferred, when it is still too risky than a bigger account will be a good option.
________________________________________________________________________________________________________________________________________
2.) Acknowledging Risk Aversion
This is a very important step in determining ones individual trading-systems, as traders act differently to circumstances some traders are risk-averse and
others are risk-seeking, this means how the trader is reacting to risk and how much the individual would risk receiving a return.
In the graph, you can see that the lesser your capital is the higher your risk-seeking, you are more ready to risk something averagely when your capital
is lower, this diminishes the higher your capital is, there are different risk preferences reaching from extreme risk averter to extreme risk seeker.
________________________________________________________________________________________________________________________________________
3.) Risk-To-Reward-Calculation
In the big table in my chart you can see the risk-to-reward calculation and the values in it, the first value is the risk meaning how much you want to risk
in the particular trade coming to the second value, the return is what you get in return on your trade.
For example, you want to buy bitcoin at 15000 and have set the target at 15010, by the technical analysis you have determine a stop-loss at 14500, this will
be a highly risky trade as you are risking to lose 500 points comparison to 10 points.
The best trades are in the green section on the table beginning with trades where you gain 2 and risk 1, these trades should be the aim and preferred,
the breakeven ratio determines how much trades need to go in breakeven to be long-time profitable.
________________________________________________________________________________________________________________________________________
4.) Risk-Reward-Ratio vs. Winrate
This rate is showing you how your trading develops by time, when you have a good winrate this means you are closing many of your positions in a profit
on the other side when this winrate is low you closing too many positions in a loss and often be unprofitable in the long-run.
What determines an excellent trader now as it is marked in the chart is when the average risk-reward ratio is high and the winrate also, this means you close
many of your positions in a profit and also with the proper risk-reward-ratio.
On the middle of the chart is the threshold determining low and high, you can also be profitable when your risk-reward is high and your win rate low or in
reverse, what should definitely be avoided is when both the winrate and ratio are lows this means you have to adapt your trading-system for sure.
________________________________________________________________________________________________________________________________________
5. Determine the maximum drawdown for every trade in advance
This is a simple but very effective and important graphic showing the likelihood traders have for a point of ruin and how much the risk of ruin in
comparison to it is, meaning when your deposit is at a level on which there is no longer possibility to continue.
This graphic shows that when your capital is more your risk of losing it diminishes, on the other side when it is low the possibility for losses is more as
the capital is not big to stand the losses, this is a groundstone knowledge in determining the trading-system together with risk.
The graphic shows that the higher your deposit is the better you can take the risks in comparison and the lower it is the higher is the risk of losing more,
this is why it is important to combine the risk together with a solid portfolio.
_______________________________________________________________________________________________________________________________________
Alright, these where the 5 key-components to determine risk in markets accordingly, traders should always look for the individual situation and where the
journeys should lead, therefore it is important to determine the risks in comparison to rewards which I bundled into the 5 Key-components necessary
determining the risk-management in ones trading-system, these components can be combined applied, or single integrated into ones trading-system.
_______________________________________________________________________________________________________________________________________
In this manner, thank you for watching , support for more tutorials and a good day!
"Good luck is when opportunity meets preparation."
Information provided is only educational and should not be used to take action in the markets.
________________________________________________________________________________________________________________________________________
