DJIA via /YM short opportunity on next leg upGood odds short setting up soon, on resistance line of wedge.
Ym

Why an early fail can actually HELP a breakoutThis is a great example for traders of all timeframes to study. I don't really have time for people basing trades on wide zones - that's fine for analysis, but for a TRADE, you've got to see the fight at a specific level. When you draw these correctly, you can get a really great picture of evolving sentiment and balance of power shifts.
Most traders treat breakouts way too lazily. You don't just enter at a new High/Low. You NEED buildup.
Any naked attack from distance is likely to fail. But what if it only pauses, instead of crashing?
Do you redraw the level? Do you avoid the trade completely?
What works for me:
Talk out the developing scenario. A fail failed? Ooh, interesting. Maybe there's more power on the original side than expected.
Once the breakout's happened, how is the other side thinking? I was biased long, getting everything I wanted to see....but what would the Bears want to see? Probably a close back under the grey/yellow boxes, right?
But wait, now that we created another temporary level during the failed probe, there's another level price needs to break through before even attempting the yellow level and then grey boxes!
--> this makes for a likely bounce point, and creates several chances for late entries. Best of all, it means a breakout entry at the original level will be protected by that bounce and your trade stays green.

Dow Futures Elliott Wave View: Pullback Should Find SupportHello Traders,
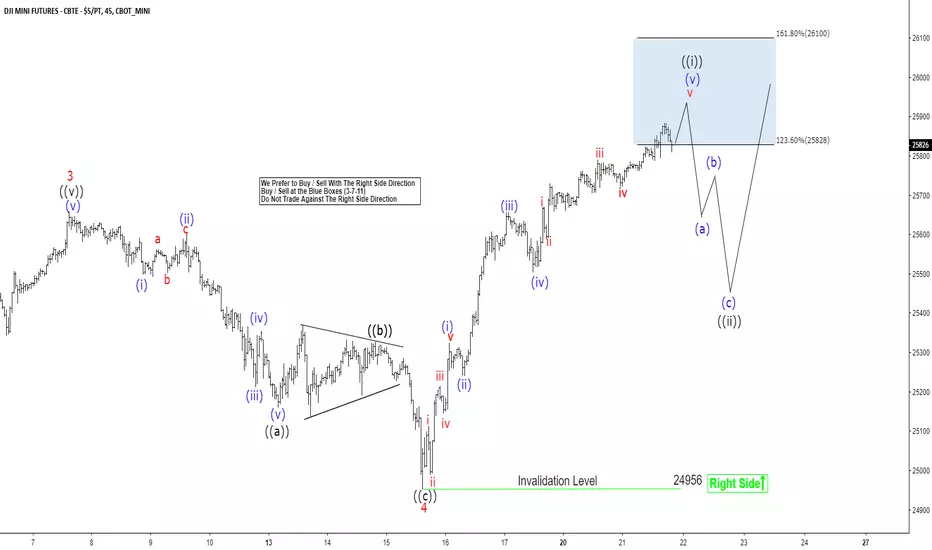
Short-term Elliott Wave view on YM_F (Dow Futures ) suggests that the pullback to 24956 low ended red wave 4. Up from there, Index is rallying within red wave 5 to end a 5 waves up from 4/2/2018 low. Black wave ((i)) of 5 is currently in progress with internal subdivision as an impulse structure, This suggests lesser degree cycles in the direction of trend should unfold in 5 waves structure, i.e blue wave (i), ( iii) & (v). On the other hand, the sub-division of lesser degree cycles against the trend should unfold in 3 waves corrective sequence, i.e. blue wave (ii) & (iv).
Up from 24956, blue wave (i) ended at 25326, blue wave (ii) ended at 25243, blue wave (iii) ended at 25657, blue wave (iv) ended at 25506, and blue wave (v) remains in progress but it is in the area where it can end soon. Consequently, the move higher should complete black wave ((i)). The Index should then pullback in black wave ((ii)) to correct cycle from 8/15/2018 low before the rally resumes. We don’t like selling the proposed pullback and expect dips to find support in 3, 7, or 11 swing as far as pivot at 24956 low stays intact.
Looking back at the YM level from last nightTradingview won't let me post the timeframes I'd like to, so please do check out the 5m for a beautiful picture of the breakout failure @ A and the subsequent recovery + breakout @ B soon after.
Hit me up with any questions.

Important YM level test coming upNot a grade A setup, but potential momentum BO trade opportunity.
Update tomorrow.

Dow Futures Elliott Wave View: Reacting Higher From Blue BoxHello Traders,
Dow Futures short-term Elliott wave view suggests that the rally from 6/28/2018 low cycle to 25572 high on 7/27/2018 peak ended red wave 1. The internals of that rally higher took place as an impulse structure with sub-division of 5 waves structure in each leg higher. Down from there, the index corrected the 6/28/2018 cycle in 3 swings pullback & ended red wave 2 at 25086 low.
The internals of that pullback unfolded as Elliott wave Zigzag correction with the sub-division of 5-3-5 structure in black wave ((a)), ((b)), ((c)). Down from 7/27 peak, the decline to 25264 low ended black wave ((a)) in 5 waves structure. From there, the rally to 25486 high ended black wave ((b)) and the subsequent move lower to 25086 low ended black wave ((c)) of 2 in 5 waves structure. Red wave 2 ended within the 25174 – 25100 area, which is 100%-123.6% Fibonacci extension of ((a))-((b)), as indicated by the blue box.
Up from 25086, the index is reacting higher in 3 swings so far and longs from blue box area should be risk-free (stop loss at break even) already. The right side tag, combined with the blue box, help to identify the right trading strategy. Near-term, as far as dips remain above 25086 low, the right side of the market remains to the upside. Expect the Index to resume the next extension higher in red wave 3. We don’t like selling it.

DOW / DIA / YM - Bullish pinbar setting up for a blastoffA bullish pinbar formed yesterday in the daily candlestick chart. This pinbar occurred from a small pullback, off of near term support. Bullish pinbars are patterns that show a false break lower, where there are now traders to went short as it dropped, but when price got pulled back up those traders are now trapped in losing positions. This signals a market that wants to go higher, and potentially a large amount of shorts that will really start becoming squeezed if price marches higher. Short traders that begin escaping losing positions are what fuels the aggressive move higher. Regardless of the quality of this setup and it's higher than 50/50 probability of success, traders should still exercise normal risk management. That means to risk a reasonable amount that will not cause major damage to your account balance if it does not work out. Remember, trading is a marathon not a sprint, so trade accordingly.

E-mini Dow Futures | TriangleMarkets have been pushing to new highs despite ongoing trade issues and technology firm earnings concerns. In a strong bull market, all boats float with the tide. Stocks and bonds will move up in anticipation of a positive outlook. A healthy market also has meaningful corrections based on business cycles and fed policy decisions. Given the long run in equities, it makes sense to start to look for technical signals and possible exhaustion points for the major indexes.

Dow - Short-Term bias flips to shortFOMC Hawkishness and the prospect of another rate hike in 2018 is
pulling down equities. This is a much clearer/logical reaction
compared to FX markets.

Dow - Bias still Long after Trump/Kim meetingRisk appetite is still sound today, after the Trump/Kim meeting ended on a positive note.
History is being made. Long bias remains on Dow, key support highlighted.

Dow Jones - Bias Shifts LongAhead of key market moving events this week, participants are buying risk.
While this may change, the current line of least resistance is up.

US Markets are throwing out some very bullish signalsWhile I am personally trading the SPY due to it's great stock and options liquidity there have been a number of great bullish signals being through in multiple index and futures markets. Today I focus on the NASDAQ 100 futures and point out a nice inside bar/2 bar reversal pattern that as already broken out to the upside as well as an inside bar/ false break pattern that is currently forming in the daily. I will be watching where the markets are going into the close but a pinbar does end up forming on the /YM futures I believe that could set us up for our next bullish move. As always with price action, price must break out of the pattern before it is confirmed. In the case of the inside bar/ false break pattern, if we do end the day with that pattern then a breakout of the inside bar pattern would still need to occur for this new signal to be trad-able. Those who jump in early to make a few extra bucks are doing so at the risk of a far less probably trade. When the patterns do break out the probably of success goes way up.

ES - Inside bar pattern breakout trade!An inside bar has formed on a number of charts including the /ES, /YM, XLF -0.42% and others. These are all following a strong trend which signals that the market is taking a short breather. Generally in periods of price consolidation after a long move we want to look for opportunities to get in the market on the next up move. In these cases we would be looking to enter the trade on an upside break of the inside bar pattern (2731). A stop loss can be placed at 2700 for an attractive risk/reward setup.

YM - Inside bar formation potential bullish setupAn inside bar has formed on the Dow Jones after a strong up move over the past week. This price consolidation represents the market take a breather (taking profits) and a break of the high of the inside bar pattern generally triggers the next up move. A break of the high of the pattern (24,800) will validate the pattern and trigger a potential long setup. A stop loss just below the low of the inside bar is generally used (24,629). If price breaks below the inside bar and holds then the pattern will be invalidated.

DJI - Inside Bar formation waiting for bullish breakoutAn inside bar has formed on the Dow Jones after a strong up move over the past week. This price consolidation represents the market take a breather (taking profits) and a break of the high of the inside bar pattern generally triggers the next up move. A break of the high of the pattern (24,800) will validate the pattern and trigger a potential long setup. A stop loss just below the low of the inside bar is generally used (24,629). If price breaks below the inside bar and holds then the pattern will be invalidated.

buy ym at 23821 up up upwe hit today the trend line and we where not able to break it. so i will get in to the upside when hits again tomorrow, on a 15 min candle stick formation.

going up because earnings sesson its greatWe are at a bull flag, i went short on dow today make good money, but ill try to get the bottom of this bull flag and ride it all the way to the top.
#futures alerts

short Ym all the way to 24607the Ym is pulling back from todays hi, it will pullback all the way to 2407 after that i will look to enter long all the way to the 38 fib. retracement from feb huge drop.

buying YM dow jonesi like to go long on YM at the price of 24192, as a target i like the posible touch of the daily trendline at 24590
#futures
#futurestrading
#futuresalerts

looking to short the dow(YM)I see a retest of the 24264 the hi of the last trading day. If it breaks and hold will go all the way up to 24430, level that i think it will hold, and will bring the index all the way down to 23735.
i will look forward to take this all the way down from this levels

VIX Spike - Here we go! Stocks, Indexes, ES, NQ, YM Elliot RightPeople lot smarter than me saying this - this is what I see. Merrill lynch two Fridays ago said correction is on.


Stocks look heavy to end the week. Seeing divergence form. Stocks look heavy. Watch how we close today, buy im taking a short trade here
