The 10 probabilistic outcomes of any given trade ideaOutlined below, I have come to the conclusion that there are 10, most probable trade outcomes of any given trade idea.
After seeing these outcomes, one can see what outcome is the most challenging for a trader to handle. Everyone is different and can tolerate different scenarios.

ES1, NQ1 & YM1 Daily Trade SetupsIn this update we review the recent price action in the emini S&P SP500, Nasdaq & DowJones futures contracts and identify the next high-probability trading opportunities and price objectives to target. To review today's video analysis, click here!

Support and resistance zone: 42278-42321
Hello, traders.
If you "Follow", you can always get new information quickly.
Have a nice day today.
-------------------------------------
(YM1! Chart)
OBV High indicator point: 42321
OBV Low indicator point: 42278
Accordingly, if it falls below 42278, it is highly likely to fall again around 4

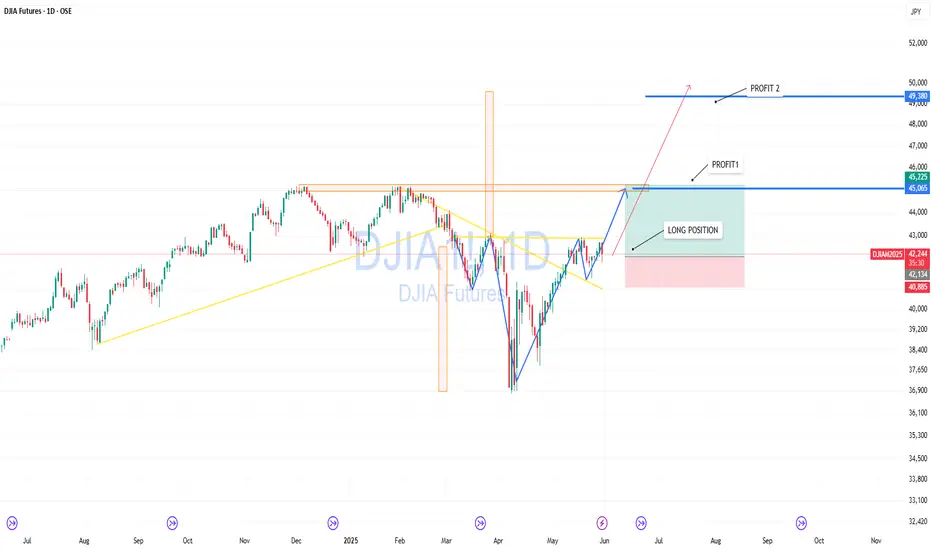
DJIA — Setting Up for Breakout and New ImpulseThe Dow Jones Index is approaching a critical resistance zone. After a deep V-shaped recovery and clear bullish structure, price is preparing for a breakout.
Chart shows a clean long entry with a stop below the recent consolidation. A break and hold above 45,000 could lead to a move toward 46,000,
Dow Futures (YM) Set to Wrap Up Wave 3 SoonSince reaching its low on April 7, 2025, Dow Futures (YM) has shown signs of recovery. The Index has initiated a rally that requires further development to confirm whether the April 7 low will hold as a significant bottom. To establish this, the Index needs to either achieve a new all-time high or c

Dow Industrials Monthly ButterflyThis one is better than Nasdaq, has indicator divergence as well and is earlier
Possibility for +20% correction from here


Dow Jones Short Trade Idea 8:1 1000 tick OpportunityI am currently short Dow Jones aiming for a home run trade that I have been waiting to set up for days now.
My thesis:
Rising wedge into the 80% pullback of the Daily Doji bar
Mean Reversion around March FOMC of 41,155
Break of the support zone of 42,000
If today will be the day it engulfs

June Gameplan Rough Estimation Dow Jones Island ReversalThis is just my rough draft estimation on what I am thinking Dow Jones will do in June.
I am going to sit out the first week to gather data and let the market show its hand to me first.
I have two key levels marked using the weekly candle of April 7th.
The 80% retracement and the candle open.

Bullish Pullback End of Month BuyAfter I thought we would see a sell continuation off of the March FOMC level of 42,155, price continued bullish.
I am using Thursday and Friday's opening price as support for a pullback. 41,912-41,968
I am expecting Wednesday and Thursday to be profit taking, pullback days in an upward trending b

See all ideas
A representation of what an asset is worth today and what the market thinks it will be worth in the future.
Displays a symbol's price movements over previous years to identify recurring trends.
Related futures
Frequently Asked Questions
The nearest expiration date for E-mini Dow Jones Industrial Average Index Futures (Jun 2018) is Jun 15, 2018.
Traders prefer to sell futures contracts when they've already made money on the investment, but still have plenty of time left before the expiration date. Thus, many consider it a good option to sell E-mini Dow Jones Industrial Average Index Futures (Jun 2018) before Jun 15, 2018.