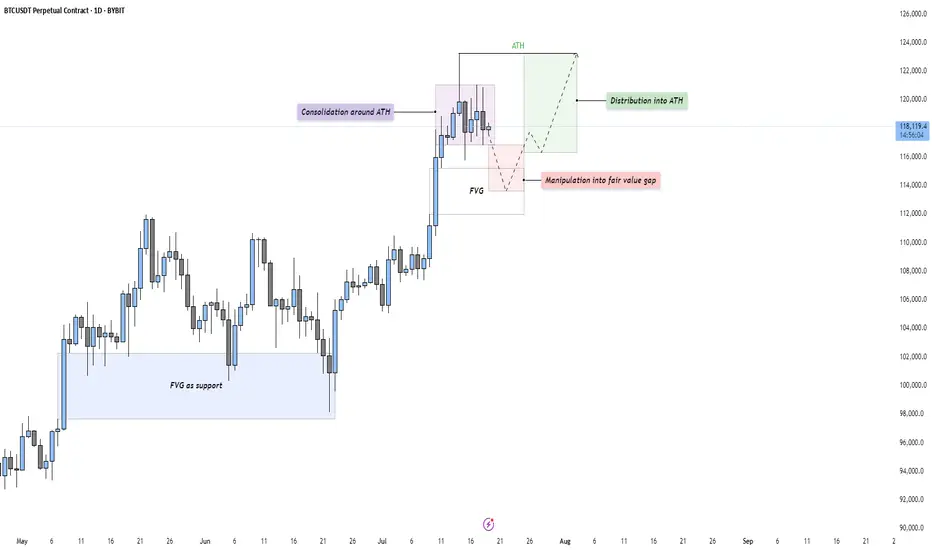
BTC - Consolidation, Manipulation & DistributionMarket Context
After a strong impulsive rally, Bitcoin is currently consolidating just beneath its All-Time High (ATH). This type of consolidation following an extended move higher often indicates indecision in the market — a pause that either leads to continuation or reversal. The current structur
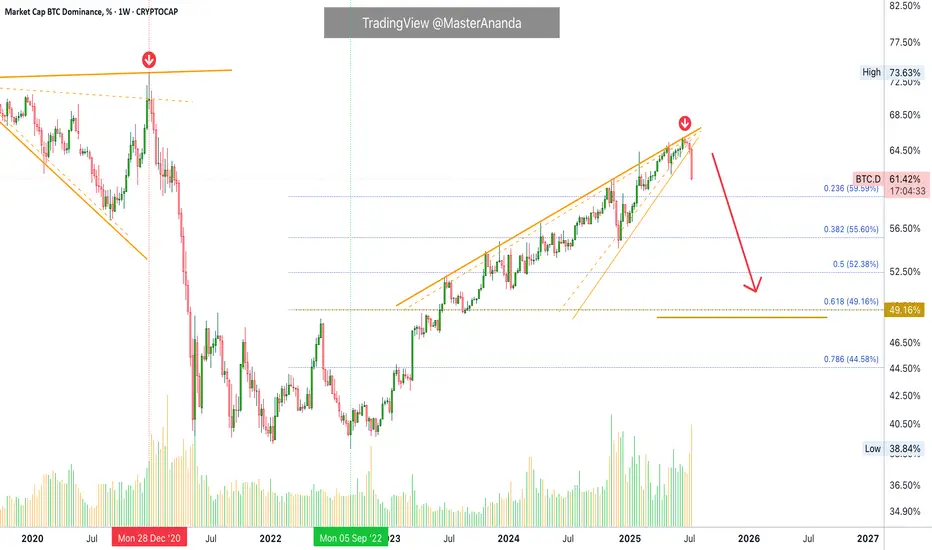
Crypto market
Bitcoin Dominance Weekly · Highest Bearish Volume in YearsThis week Bitcoin Dominance Index is producing the highest bearish volume session since February 2021. More than 4.5 years.
This week we have the strongest bearish action since June 2022. We can say that the altcoins market bull market is not only fully confirmed but already underway. We are alread
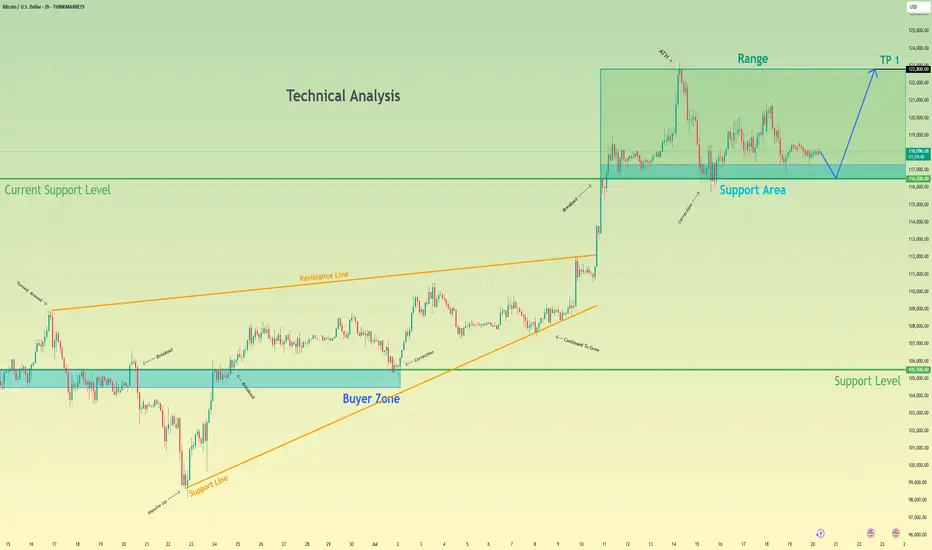
Bitcoin may bounce up from support area to 122800 pointsHello traders, I want share with you my opinion about Bitcoin. Analyzing the broader market context on the BTC chart, the past price action has carved out two significant technical structures: a wide trading range and a larger upward wedge pattern. The formation of this wedge indicates a generally p
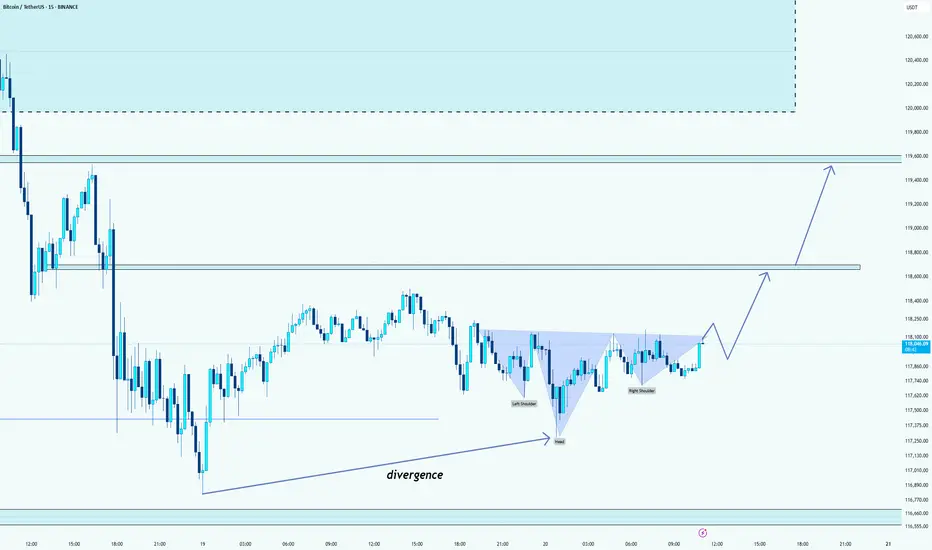
BTC: a Head and shoulders patternHello guys!
As you can see, a Head and shoulders and a divergence formed!
We can expect the price to rise until those two levels that I pointed out!
If the neckline breakout gets a long in retracements!
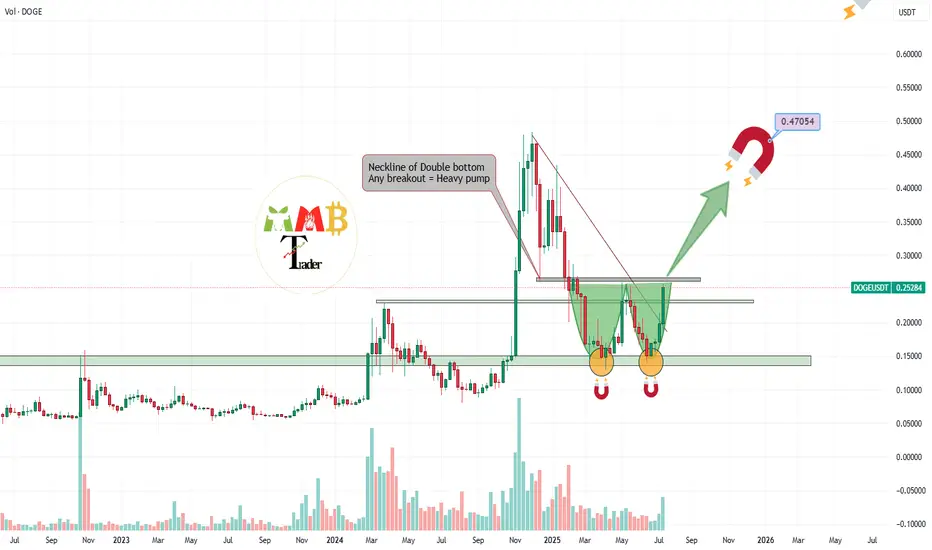
DOGEUSDT double bottom pattern or my Magnet pattern???So many of Traders around the world sees weekly Strong reversal pattern which is double Bottom and they are waiting for breakout of neckline which is last major resistance of 0.26$ and i think soon it can break the resistance and heavy pump ahead after breakout is expected.
But you may be wrong the
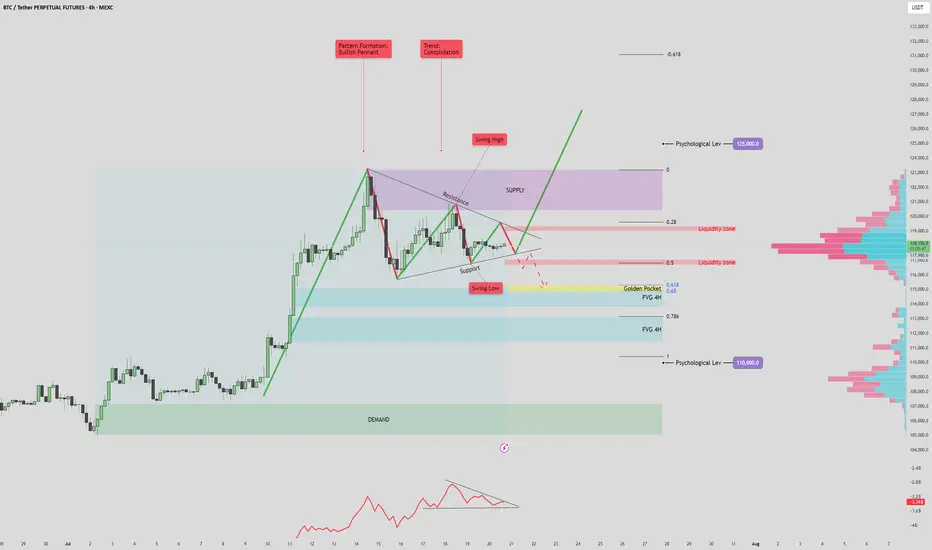
BTC/USDT 125k? or 110k fall again?BTC/USDT 4H Analysis – July 20, 2025
The current market structure shows a bullish pennant forming after a strong impulsive move upward, with price consolidating between key support and resistance levels. This pattern, combined with volume signals and key price zones, suggests a potential for a hig
BITCOIN → Consolidation, retest of 120K. Correction of dominanceBINANCE:BTCUSDT , after a rapid rally and touching 123K, rolled back and entered consolidation, giving altcoins a chance. At the same time, Trump signed new crypto laws, but will these laws open new doors?
On June 18, the GENIUS Act was signed. Information can be found in the sources, but ther

TradeCityPro | ICP Eyes Breakout as Altseason Speculation Grows 👋 Welcome to TradeCity Pro!
In this analysis, I want to review the ICP coin for you—one of the DePIN and AI-related coins, ranked 37 on CoinMarketCap with a market cap of 3.11 billion.
📅 Daily timeframe
As you can see on the daily timeframe, a ranging box has formed around the key support at 4.648,

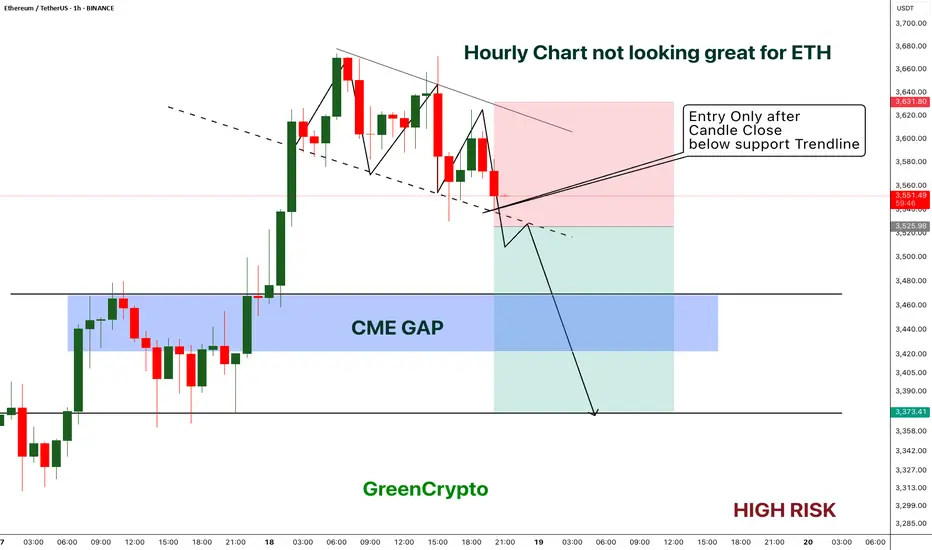
ETH - Short Trade with HIGH RISK- ETH got reject from resistance multiple times on 1H timeframe and now the price is playing near the support.
- I'm expecting overall market to cooldown this weekend, this could push the ETH to break the support
- ETH has CME gap around 3422 - 3467 range, im expecting this CME gap to be filled soo
Bitcoin: 130K AREA Upon Triangle Break Out.Bitcoin consolidating in a sub wave 4 and poised to break out (see triangle formation on chart). This breakout would be the sub wave 5 which can take price as high as the 133K to 134K area. In my opinion, this can be the completion of the broadest impulse wave (5th of the 5th). Wave counts aside, th

See all popular ideas
Community trends
Crypto collections
All coinsTotal value locked rankDeFi coinsGainersLosersLarge-capSmall-capMost tradedMost addresses with balanceMost daily active addressesMost transactionsHighest transaction volumeLowest supplyHighest supplyMost expensiveMost volatileDevelopment activityAll-time highAll-time low52-week high52-week lowSee all