WCWebhookLibraryLibrary "WCWebhookLibrary"
The webhook message library provides several functions for building JSON payloads
method buildWebhookJson(msg, constants)
Builds the final JSON payload from a webhookMessage type.
Namespace types: webhookMessage
Parameters:
msg (webhookMessage) : (webhookMessage) A prepared webhookMessage.
constants (CONSTANTS)
Returns: A JSON Payload.
method buildTakeProfitJson(msg)
Builds the takeProfit JSON message to be used in a webhook message.
Namespace types: takeProfitMessage
Parameters:
msg (takeProfitMessage) : (takeProfitMessage)
Returns: A JSON takeProfit payload.
method buildStopLossJson(msg, constants)
Builds the stopLoss JSON message to be used in a webhook message.
Namespace types: stopLossMessage
Parameters:
msg (stopLossMessage) : (stopLossMessage)
constants (CONSTANTS)
Returns: A JSON stopLoss payload.
CONSTANTS
Constants for payload values.
Fields:
ACTION_BUY (series string)
ACTION_SELL (series string)
ACTION_EXIT (series string)
ACTION_CANCEL (series string)
ACTION_ADD (series string)
SENTIMENT_BULLISH (series string)
SENTIMENT_BEARISH (series string)
SENTIMENT_LONG (series string)
SENTIMENT_SHORT (series string)
SENTIMENT_FLAT (series string)
STOP_LOSS_TYPE_STOP (series string)
STOP_LOSS_TYPE_STOP_LIMIT (series string)
STOP_LOSS_TYPE_TRAILING_STOP (series string)
EXTENDED_HOURS (series bool)
webhookMessage
Final webhook message.
Fields:
ticker (series string)
action (series string)
sentiment (series string)
price (series float)
quantity (series int)
takeProfit (series string)
stopLoss (series string)
extended_hours (series bool)
takeProfitMessage
Take profit message.
Fields:
limitPrice (series float)
percent (series float)
amount (series float)
stopLossMessage
Stop loss message.
Fields:
type (series string)
percent (series float)
amount (series float)
stopPrice (series float)
limitPrice (series float)
trailPrice (series float)
trailPercent (series float)
Indicators and strategies

ZigZagLibrary "ZigZag"
method lastPivot(this)
Retrieves the last `Pivot` object's reference from a `ZigZag` object's `pivots`
array if it contains at least one element, or `na` if the array is empty.
Callable as a method or a function.
Namespace types: ZigZag
Parameters:
this (ZigZag) : (series ZigZag) The `ZigZag` object's reference.
Returns: (Pivot) The reference of the last `Pivot` instance in the `ZigZag` object's
`pivots` array, or `na` if the array is empty.
method update(this, sourceHigh, sourceLow)
Updates a `ZigZag` object's pivot information, volume data, lines, and
labels when it detects new pivot points.
NOTE: This function requires a single execution on each bar for accurate
calculations.
Callable as a method or a function.
Namespace types: ZigZag
Parameters:
this (ZigZag) : (series ZigZag) The `ZigZag` object's reference.
sourceHigh (float) : (series float) The data series to analyze for high pivot points.
sourceLow (float) : (series float) The data series to analyze for low pivot points.
Returns: (bool) `true` if the function detects a new pivot point and updates the
`ZigZag` object's data, `false` otherwise.
newInstance(settings)
Creates a new `ZigZag` instance with optional settings.
Parameters:
settings (Settings) : (series Settings) Optional. A `Settings` object's reference for the new
`ZigZag` instance's `settings` field. If `na`, the `ZigZag` instance
uses a new `Settings` object with default properties. The default is `na`.
Returns: (ZigZag) A new `ZigZag` object's reference.
Settings
A structure for objects that store calculation and display properties for `ZigZag` instances.
Fields:
devThreshold (series float) : The minimum percentage deviation from a previous pivot point required to change the Zig Zag's direction.
depth (series int) : The number of bars required for pivot point detection.
lineColorUp (series color) : The color of each line in the Zig Zag drawing that connects pivot highs.
lineColorDown (series color) : The color of each line in the Zig Zag drawing that connects pivot lows.
textUpColor (series color) : The color of the text in each label that shows a pivot high's price and volume.
textDownColor (series color) : The color of the text in each label that shows a pivot low's price and volume.
lineWidth (series int) : The width of the Zig Zag lines.
extendLast (series bool) : Specifies whether the Zig Zag drawing includes a line connecting the most recent pivot point to the latest bar's `close`.
displayReversalPrice (series bool) : Specifies whether the Zig Zag drawing shows pivot prices in its labels.
displayCumulativeVolume (series bool) : Specifies whether the Zig Zag drawing shows the cumulative volume between pivot points in its labels.
displayReversalPriceChange (series bool) : Specifies whether the Zig Zag drawing shows the reversal amount from the previous pivot point in each label.
differencePriceMode (series string) : The reversal amount display mode. Possible values: `"Absolute"` for price change or `"Percent"` for percentage change.
draw (series bool) : Specifies whether the Zig Zag drawing displays its lines and labels.
allowZigZagOnOneBar (series bool) : Specifies whether the Zig Zag calculation can register a pivot high *and* pivot low on the same bar.
drawSupportResistance (series bool) : Specifies whether the Zig Zag drawing includes support and resistance lines.
supportResistanceOffset (series int) : The number of bars to extend the support and resistance lines from the last pivot point.
supportResistanceWidth (series int) : The width of the support and resistance lines.
supportColor (series color) : The color of the support lines.
resistanceColor (series color) : The color of the resistance lines.
supportResistanceZoneWidth (series int) : The width of the support and resistance zones.
drawSupportResistanceZone (series bool) : Specifies whether the Zig Zag drawing includes support and resistance zones.
supportZoneColor (series color) : The color of the support zone.
resistanceZoneColor (series color) : The color of the resistance zone.
supportResistanceExtend (series bool) : Specifies whether the support and resistance lines extend to the right of the chart.
overlay (series bool) : Specifies whether the Zig Zag drawing appears on the main chart or in a separate pane.
zigZagLineStyle (series string) : The line style of the Zig Zag lines. Possible values: `line.style_solid`, `line.style_dotted`, `line.style_dashed`, `line.style_arrow_left`, `line.style_arrow_right`, or `line.style_arrow_both`.
supportResistanceLineStyle (series string) : The line style of the support and resistance lines. Possible values: `line.style_solid`, `line.style_dotted`, `line.style_dashed`, `line.style_arrow_left`, `line.style_arrow_right`, or `line.style_arrow_both`.
Pivot
A structure for objects that store chart point references, drawing references, and volume information for `ZigZag` instances.
Fields:
ln (series line) : References a `line` object that connects the coordinates from the `start` and `end` chart points.
lb (series label) : References a `label` object that displays pivot data at the `end` chart point's coordinates.
isHigh (series bool) : Specifies whether the pivot at the `end` chart point's coordinates is a pivot high.
vol (series float) : The cumulative volume across the bars between the `start` and `end` chart points.
start (chart.point) : References a `chart.point` object containing the coordinates of the previous pivot point.
end (chart.point) : References a `chart.point` object containing the coordinates of the current pivot point.
supportResistance (series line)
supportResistanceZone (series line)
ZigZag
A structure for objects that maintain Zig Zag drawing settings, pivots, and cumulative volume data.
Fields:
settings (Settings) : References a `Settings` object that specifies the Zig Zag drawing's calculation and display properties.
pivots (array) : References an array of `Pivot` objects that store pivot point, drawing, and volume information.
sumVol (series float) : The cumulative volume across bars covered by the latest `Pivot` object's line segment.
extend (Pivot) : References a `Pivot` object that projects a line from the last confirmed pivot point to the current bar's `close`.


TimeframeInputToStringMaps a worded string for timeframes useful when working with the input.timeframe settings input. Use like timeframeToString("120") and the output will be "2 hour"
FastMetrixLibrary "FastMetrix"
This is a library I've been tweaking and working with for a while and I find it useful to get valuable technical analysis metrics faster (why its called FastMetrix). A lot of is personal to my trading style, so sorry if it does not have everything you want. The way I get my variables from library to script is by copying the return function into my new script.
TODO: Volatility and short term price analysis functions
slope(source, smoothing)
Parameters:
source (float)
smoothing (int)
integral(topfunction, bottomfunction, start, end)
Parameters:
topfunction (float)
bottomfunction (float)
start (int)
end (int)
deviation(x, y)
Parameters:
x (float)
y (float)
getema(len)
TODO: return important exponential long term moving averages and derivatives/variables
Parameters:
len (simple int)
getsma(len)
TODO: return requested sma
Parameters:
len (int)
kc(mult, len)
TODO: Return Keltner Channels variables and calculations
Parameters:
mult (simple float)
len (simple int)
bollinger(len, mult)
TODO: returns bollinger bands with optimal settings
Parameters:
len (int)
mult (simple float)
volatility(atrlen, smoothing)
TODO: Returns volatility indicators based on atr
Parameters:
atrlen (simple int)
smoothing (int)
premarketfib()
countinday(xcondition)
Parameters:
xcondition (bool)
countinsession(condition, n)
Parameters:
condition (bool)
n (int)
MathConstantsSolarSystemLibrary "MathConstantsSolarSystem"
Properties and data for the celestial objects in the Solar System.

LoggersLibrary "Loggers"
helper functions for easily logging debug info into the console and for coloring them dynamically according to their meaning.
fun(x)
TODO: add function description here
Parameters:
x (float) : TODO: add parameter x description here
Returns: TODO: add what function returns
loginfo(name, value, unit)
Parameters:
name (string)
value (float)
unit (string)
loginfo(name, value, unit)
Parameters:
name (string)
value (bool)
unit (string)
loginfo(name, value, unit)
Parameters:
name (string)
value (int)
unit (string)
logwarning(name, value, unit)
Parameters:
name (string)
value (float)
unit (string)
logwarning(name, value, unit)
Parameters:
name (string)
value (bool)
unit (string)
logwarning(name, value, unit)
Parameters:
name (string)
value (int)
unit (string)
logerror(name, value, unit)
Parameters:
name (string)
value (float)
unit (string)
logerror(name, value, unit)
Parameters:
name (string)
value (bool)
unit (string)
logerror(name, value, unit)
Parameters:
name (string)
value (int)
unit (string)
logdynamic_lowbad(name, value, unit, treshold_yellow, treshold_red)
Parameters:
name (string)
value (float)
unit (string)
treshold_yellow (float)
treshold_red (float)
logdynamic_lowbad(name, value, unit, treshold_yellow, treshold_red)
Parameters:
name (string)
value (int)
unit (string)
treshold_yellow (float)
treshold_red (float)
logdynamic_highbad(name, value, unit, treshold_yellow, treshold_red)
Parameters:
name (string)
value (float)
unit (string)
treshold_yellow (float)
treshold_red (float)
logdynamic_highbad(name, value, unit, treshold_yellow, treshold_red)
Parameters:
name (string)
value (int)
unit (string)
treshold_yellow (float)
treshold_red (float)
logdynamic_falsebad(name, value, unit)
Parameters:
name (string)
value (bool)
unit (string)
logdynamic_truebad(name, value, unit)
Parameters:
name (string)
value (bool)
unit (string)

RifleShooterLibLibrary "RifleShooterLib"
Provides a collection of helper functions in support of the Rifle Shooter Indicators.
Functions support the key components of the Rifle Trade algorithm including
* measuring momentum
* identifying paraboloic price action (to disable the algorthim during such time)
* determine the lookback criteria of X point movement in last N minutes
* processing and navigating between the 23/43/73 levels
* maintaining a status table of algorithm progress
toStrRnd(val, digits)
Parameters:
val (float)
digits (int)
_isValidTimeRange(startTimeInput, endTimeInput)
Parameters:
startTimeInput (string)
endTimeInput (string)
_normalize(_src, _min, _max)
_normalize Normalizes series with unknown min/max using historical min/max.
Parameters:
_src (float) : Source series to normalize
_min (float) : minimum value of the rescaled series
_max (float) : maximum value of the rescaled series
Returns: The series scaled with values between min and max
arrayToSeries(arrayInput)
arrayToSeries Return an array from the provided series.
Parameters:
arrayInput (array) : Source array to convert to a series
Returns: The array as a series datatype
f_parabolicFiltering(_activeCount, long, shooterRsi, shooterRsiLongThreshold, shooterRsiShortThreshold, fiveMinuteRsi, fiveMinRsiLongThreshold, fiveMinRsiShortThreshold, shooterRsiRoc, shooterRsiRocLongThreshold, shooterRsiRocShortThreshold, quickChangeLookbackBars, quckChangeThreshold, curBarChangeThreshold, changeFromPrevBarThreshold, maxBarsToholdParabolicMoveActive, generateLabels)
f_parabolicFiltering Return true when price action indicates a parabolic active movement based on the provided inputs and thresholds.
Parameters:
_activeCount (int)
long (bool)
shooterRsi (float)
shooterRsiLongThreshold (float)
shooterRsiShortThreshold (float)
fiveMinuteRsi (float)
fiveMinRsiLongThreshold (float)
fiveMinRsiShortThreshold (float)
shooterRsiRoc (float)
shooterRsiRocLongThreshold (float)
shooterRsiRocShortThreshold (float)
quickChangeLookbackBars (int)
quckChangeThreshold (int)
curBarChangeThreshold (int)
changeFromPrevBarThreshold (int)
maxBarsToholdParabolicMoveActive (int)
generateLabels (bool)
rsiValid(rsi, buyThreshold, sellThreshold)
rsiValid Returns true if the provided RSI value is withing the associated threshold. For the unused threshold set it to na
Parameters:
rsi (float)
buyThreshold (float)
sellThreshold (float)
squezeBands(source, length)
squezeBands Returns the squeeze bands momentum color of current source series input
Parameters:
source (float)
length (int)
f_momentumOscilator(source, length, transperency)
f_momentumOscilator Returns the squeeze pro momentum value and bar color states of the series input
Parameters:
source (float)
length (int)
transperency (int)
f_getLookbackExtreme(lowSeries, highSeries, lbBars, long)
f_getLookbackExtreme Return the highest high or lowest low over the look back window
Parameters:
lowSeries (float)
highSeries (float)
lbBars (int)
long (bool)
f_getInitialMoveTarget(lbExtreme, priveMoveOffset, long)
f_getInitialMoveTarget Return the point delta required to achieve an initial rifle move (X points over Y lookback)
Parameters:
lbExtreme (float)
priveMoveOffset (int)
long (bool)
isSymbolSupported(sym)
isSymbolSupported Return true if provided symbol is one of the supported DOW Rifle Indicator symbols
Parameters:
sym (string)
getBasePrice(price)
getBasePrice Returns integer portion of provided float
Parameters:
price (float)
getLastTwoDigitsOfPrice(price)
getBasePrice Returns last two integer numerals of provided float value
Parameters:
price (float)
getNextLevelDown(price, lowestLevel, middleLevel, highestLevel)
getNextLevelDown Returns the next level above the provided price value
Parameters:
price (float)
lowestLevel (float)
middleLevel (float)
highestLevel (float)
getNextLevelUp(price, lowestLevel, middleLevel, highestLevel)
getNextLevelUp Returns the next level below the provided price value
Parameters:
price (float)
lowestLevel (float)
middleLevel (float)
highestLevel (float)
isALevel(price, lowestLevel, middleLevel, highestLevel)
isALevel Returns true if the provided price is onve of the specified levels
Parameters:
price (float)
lowestLevel (float)
middleLevel (float)
highestLevel (float)
getClosestLevel(price, lowestLevel, middleLevel, highestLevel)
getClosestLevel Returns the level closest to the price value provided
Parameters:
price (float)
lowestLevel (float)
middleLevel (float)
highestLevel (float)
f_fillSetupTableCell(_table, _col, _row, _text, _bgcolor, _txtcolor, _text_size)
f_fillSetupTableCell Helper function to fill a setup table celll
Parameters:
_table (table)
_col (int)
_row (int)
_text (string)
_bgcolor (color)
_txtcolor (color)
_text_size (string)
f_fillSetupTableRow(_table, _row, _col0Str, _col1Str, _col2Str, _bgcolor, _textColor, _textSize)
f_fillSetupTableRow Helper function to fill a setup table row
Parameters:
_table (table)
_row (int)
_col0Str (string)
_col1Str (string)
_col2Str (string)
_bgcolor (color)
_textColor (color)
_textSize (string)
f_addBlankRow(_table, _row)
f_addBlankRow Helper function to fill a setup table row with empty values
Parameters:
_table (table)
_row (int)
f_updateVersionTable(versionTable, versionStr, versionDateStr)
f_updateVersionTable Helper function to fill the version table with provided values
Parameters:
versionTable (table)
versionStr (string)
versionDateStr (string)
f_updateSetupTable(_table, parabolicMoveActive, initialMoveTargetOffset, initialMoveAchieved, shooterRsi, shooterRsiValid, rsiRocEnterThreshold, shooterRsiRoc, fiveMinuteRsi, fiveMinuteRsiValid, requireValid5MinuteRsiForEntry, stallLevelOffset, stallLevelExceeded, stallTargetOffset, recoverStallLevelValid, curBarChangeValid, volumeRoc, volumeRocThreshold, enableVolumeRocForTrigger, tradeActive, entryPrice, curCloseOffset, curSymCashDelta, djiCashDelta, showDjiDelta, longIndicator, fontSize)
f_updateSetupTable Manages writing current data to the setup table
Parameters:
_table (table)
parabolicMoveActive (bool)
initialMoveTargetOffset (float)
initialMoveAchieved (bool)
shooterRsi (float)
shooterRsiValid (bool)
rsiRocEnterThreshold (float)
shooterRsiRoc (float)
fiveMinuteRsi (float)
fiveMinuteRsiValid (bool)
requireValid5MinuteRsiForEntry (bool)
stallLevelOffset (float)
stallLevelExceeded (bool)
stallTargetOffset (float)
recoverStallLevelValid (bool)
curBarChangeValid (bool)
volumeRoc (float)
volumeRocThreshold (float)
enableVolumeRocForTrigger (bool)
tradeActive (bool)
entryPrice (float)
curCloseOffset (float)
curSymCashDelta (float)
djiCashDelta (float)
showDjiDelta (bool)
longIndicator (bool)
fontSize (string)
Color█ OVERVIEW
This library is a Pine Script® programming tool for advanced color processing. It provides a comprehensive set of functions for specifying and analyzing colors in various color spaces, mixing and manipulating colors, calculating custom gradients and schemes, detecting contrast, and converting colors to or from hexadecimal strings.
█ CONCEPTS
Color
Color refers to how we interpret light of different wavelengths in the visible spectrum . The colors we see from an object represent the light wavelengths that it reflects, emits, or transmits toward our eyes. Some colors, such as blue and red, correspond directly to parts of the spectrum. Others, such as magenta, arise from a combination of wavelengths to which our minds assign a single color.
The human interpretation of color lends itself to many uses in our world. In the context of financial data analysis, the effective use of color helps transform raw data into insights that users can understand at a glance. For example, colors can categorize series, signal market conditions and sessions, and emphasize patterns or relationships in data.
Color models and spaces
A color model is a general mathematical framework that describes colors using sets of numbers. A color space is an implementation of a specific color model that defines an exact range (gamut) of reproducible colors based on a set of primary colors , a reference white point , and sometimes additional parameters such as viewing conditions.
There are numerous different color spaces — each describing the characteristics of color in unique ways. Different spaces carry different advantages, depending on the application. Below, we provide a brief overview of the concepts underlying the color spaces supported by this library.
RGB
RGB is one of the most well-known color models. It represents color as an additive mixture of three primary colors — red, green, and blue lights — with various intensities. Each cone cell in the human eye responds more strongly to one of the three primaries, and the average person interprets the combination of these lights as a distinct color (e.g., pure red + pure green = yellow).
The sRGB color space is the most common RGB implementation. Developed by HP and Microsoft in the 1990s, sRGB provided a standardized baseline for representing color across CRT monitors of the era, which produced brightness levels that did not increase linearly with the input signal. To match displays and optimize brightness encoding for human sensitivity, sRGB applied a nonlinear transformation to linear RGB signals, often referred to as gamma correction . The result produced more visually pleasing outputs while maintaining a simple encoding. As such, sRGB quickly became a standard for digital color representation across devices and the web. To this day, it remains the default color space for most web-based content.
TradingView charts and Pine Script `color.*` built-ins process color data in sRGB. The red, green, and blue channels range from 0 to 255, where 0 represents no intensity, and 255 represents maximum intensity. Each combination of red, green, and blue values represents a distinct color, resulting in a total of 16,777,216 displayable colors.
CIE XYZ and xyY
The XYZ color space, developed by the International Commission on Illumination (CIE) in 1931, aims to describe all color sensations that a typical human can perceive. It is a cornerstone of color science, forming the basis for many color spaces used today. XYZ, and the derived xyY space, provide a universal representation of color that is not tethered to a particular display. Many widely used color spaces, including sRGB, are defined relative to XYZ or derived from it.
The CIE built the color space based on a series of experiments in which people matched colors they perceived from mixtures of lights. From these experiments, the CIE developed color-matching functions to calculate three components — X, Y, and Z — which together aim to describe a standard observer's response to visible light. X represents a weighted response to light across the color spectrum, with the highest contribution from long wavelengths (e.g., red). Y represents a weighted response to medium wavelengths (e.g., green), and it corresponds to a color's relative luminance (i.e., brightness). Z represents a weighted response to short wavelengths (e.g., blue).
From the XYZ space, the CIE developed the xyY chromaticity space, which separates a color's chromaticity (hue and colorfulness) from luminance. The CIE used this space to define the CIE 1931 chromaticity diagram , which represents the full range of visible colors at a given luminance. In color science and lighting design, xyY is a common means for specifying colors and visualizing the supported ranges of other color spaces.
CIELAB and Oklab
The CIELAB (L*a*b*) color space, derived from XYZ by the CIE in 1976, expresses colors based on opponent process theory. The L* component represents perceived lightness, and the a* and b* components represent the balance between opposing unique colors. The a* value specifies the balance between green and red , and the b* value specifies the balance between blue and yellow .
The primary intention of CIELAB was to provide a perceptually uniform color space, where fixed-size steps through the space correspond to uniform perceived changes in color. Although relatively uniform, the color space has been found to exhibit some non-uniformities, particularly in the blue part of the color spectrum. Regardless, modern applications often use CIELAB to estimate perceived color differences and calculate smooth color gradients.
In 2020, a new LAB-oriented color space, Oklab , was introduced by Björn Ottosson as an attempt to rectify the non-uniformities of other perceptual color spaces. Similar to CIELAB, the L value in Oklab represents perceived lightness, and the a and b values represent the balance between opposing unique colors. Oklab has gained widespread adoption as a perceptual space for color processing, with support in the latest CSS Color specifications and many software applications.
Cylindrical models
A cylindrical-coordinate model transforms an underlying color model, such as RGB or LAB, into an alternative expression of color information that is often more intuitive for the average person to use and understand.
Instead of a mixture of primary colors or opponent pairs, these models represent color as a hue angle on a color wheel , with additional parameters that describe other qualities such as lightness and colorfulness (a general term for concepts like chroma and saturation). In cylindrical-coordinate spaces, users can select a color and modify its lightness or other qualities without altering the hue.
The three most common RGB-based models are HSL (Hue, Saturation, Lightness), HSV (Hue, Saturation, Value), and HWB (Hue, Whiteness, Blackness). All three define hue angles in the same way, but they define colorfulness and lightness differently. Although they are not perceptually uniform, HSL and HSV are commonplace in color pickers and gradients.
For CIELAB and Oklab, the cylindrical-coordinate versions are CIELCh and Oklch , which express color in terms of perceived lightness, chroma, and hue. They offer perceptually uniform alternatives to RGB-based models. These spaces create unique color wheels, and they have more strict definitions of lightness and colorfulness. Oklch is particularly well-suited for generating smooth, perceptual color gradients.
Alpha and transparency
Many color encoding schemes include an alpha channel, representing opacity . Alpha does not help define a color in a color space; it determines how a color interacts with other colors in the display. Opaque colors appear with full intensity on the screen, whereas translucent (semi-opaque) colors blend into the background. Colors with zero opacity are invisible.
In Pine Script, there are two ways to specify a color's alpha:
• Using the `transp` parameter of the built-in `color.*()` functions. The specified value represents transparency (the opposite of opacity), which the functions translate into an alpha value.
• Using eight-digit hexadecimal color codes. The last two digits in the code represent alpha directly.
A process called alpha compositing simulates translucent colors in a display. It creates a single displayed color by mixing the RGB channels of two colors (foreground and background) based on alpha values, giving the illusion of a semi-opaque color placed over another color. For example, a red color with 80% transparency on a black background produces a dark shade of red.
Hexadecimal color codes
A hexadecimal color code (hex code) is a compact representation of an RGB color. It encodes a color's red, green, and blue values into a sequence of hexadecimal ( base-16 ) digits. The digits are numerals ranging from `0` to `9` or letters from `a` (for 10) to `f` (for 15). Each set of two digits represents an RGB channel ranging from `00` (for 0) to `ff` (for 255).
Pine scripts can natively define colors using hex codes in the format `#rrggbbaa`. The first set of two digits represents red, the second represents green, and the third represents blue. The fourth set represents alpha . If unspecified, the value is `ff` (fully opaque). For example, `#ff8b00` and `#ff8b00ff` represent an opaque orange color. The code `#ff8b0033` represents the same color with 80% transparency.
Gradients
A color gradient maps colors to numbers over a given range. Most color gradients represent a continuous path in a specific color space, where each number corresponds to a mix between a starting color and a stopping color. In Pine, coders often use gradients to visualize value intensities in plots and heatmaps, or to add visual depth to fills.
The behavior of a color gradient depends on the mixing method and the chosen color space. Gradients in sRGB usually mix along a straight line between the red, green, and blue coordinates of two colors. In cylindrical spaces such as HSL, a gradient often rotates the hue angle through the color wheel, resulting in more pronounced color transitions.
Color schemes
A color scheme refers to a set of colors for use in aesthetic or functional design. A color scheme usually consists of just a few distinct colors. However, depending on the purpose, a scheme can include many colors.
A user might choose palettes for a color scheme arbitrarily, or generate them algorithmically. There are many techniques for calculating color schemes. A few simple, practical methods are:
• Sampling a set of distinct colors from a color gradient.
• Generating monochromatic variants of a color (i.e., tints, tones, or shades with matching hues).
• Computing color harmonies — such as complements, analogous colors, triads, and tetrads — from a base color.
This library includes functions for all three of these techniques. See below for details.
█ CALCULATIONS AND USE
Hex string conversion
The `getHexString()` function returns a string containing the eight-digit hexadecimal code corresponding to a "color" value or set of sRGB and transparency values. For example, `getHexString(255, 0, 0)` returns the string `"#ff0000ff"`, and `getHexString(color.new(color.red, 80))` returns `"#f2364533"`.
The `hexStringToColor()` function returns the "color" value represented by a string containing a six- or eight-digit hex code. The `hexStringToRGB()` function returns a tuple containing the sRGB and transparency values. For example, `hexStringToColor("#f23645")` returns the same value as color.red .
Programmers can use these functions to parse colors from "string" inputs, perform string-based color calculations, and inspect color data in text outputs such as Pine Logs and tables.
Color space conversion
All other `get*()` functions convert a "color" value or set of sRGB channels into coordinates in a specific color space, with transparency information included. For example, the tuple returned by `getHSL()` includes the color's hue, saturation, lightness, and transparency values.
To convert data from a color space back to colors or sRGB and transparency values, use the corresponding `*toColor()` or `*toRGB()` functions for that space (e.g., `hslToColor()` and `hslToRGB()`).
Programmers can use these conversion functions to process inputs that define colors in different ways, perform advanced color manipulation, design custom gradients, and more.
The color spaces this library supports are:
• sRGB
• Linear RGB (RGB without gamma correction)
• HSL, HSV, and HWB
• CIE XYZ and xyY
• CIELAB and CIELCh
• Oklab and Oklch
Contrast-based calculations
Contrast refers to the difference in luminance or color that makes one color visible against another. This library features two functions for calculating luminance-based contrast and detecting themes.
The `contrastRatio()` function calculates the contrast between two "color" values based on their relative luminance (the Y value from CIE XYZ) using the formula from version 2 of the Web Content Accessibility Guidelines (WCAG) . This function is useful for identifying colors that provide a sufficient brightness difference for legibility.
The `isLightTheme()` function determines whether a specified background color represents a light theme based on its contrast with black and white. Programmers can use this function to define conditional logic that responds differently to light and dark themes.
Color manipulation and harmonies
The `negative()` function calculates the negative (i.e., inverse) of a color by reversing the color's coordinates in either the sRGB or linear RGB color space. This function is useful for calculating high-contrast colors.
The `grayscale()` function calculates a grayscale form of a specified color with the same relative luminance.
The functions `complement()`, `splitComplements()`, `analogousColors()`, `triadicColors()`, `tetradicColors()`, `pentadicColors()`, and `hexadicColors()` calculate color harmonies from a specified source color within a given color space (HSL, CIELCh, or Oklch). The returned harmonious colors represent specific hue rotations around a color wheel formed by the chosen space, with the same defined lightness, saturation or chroma, and transparency.
Color mixing and gradient creation
The `add()` function simulates combining lights of two different colors by additively mixing their linear red, green, and blue components, ignoring transparency by default. Users can calculate a transparency-weighted mixture by setting the `transpWeight` argument to `true`.
The `overlay()` function estimates the color displayed on a TradingView chart when a specific foreground color is over a background color. This function aids in simulating stacked colors and analyzing the effects of transparency.
The `fromGradient()` and `fromMultiStepGradient()` functions calculate colors from gradients in any of the supported color spaces, providing flexible alternatives to the RGB-based color.from_gradient() function. The `fromGradient()` function calculates a color from a single gradient. The `fromMultiStepGradient()` function calculates a color from a piecewise gradient with multiple defined steps. Gradients are useful for heatmaps and for coloring plots or drawings based on value intensities.
Scheme creation
Three functions in this library calculate palettes for custom color schemes. Scripts can use these functions to create responsive color schemes that adjust to calculated values and user inputs.
The `gradientPalette()` function creates an array of colors by sampling a specified number of colors along a gradient from a base color to a target color, in fixed-size steps.
The `monoPalette()` function creates an array containing monochromatic variants (tints, tones, or shades) of a specified base color. Whether the function mixes the color toward white (for tints), a form of gray (for tones), or black (for shades) depends on the `grayLuminance` value. If unspecified, the function automatically chooses the mix behavior with the highest contrast.
The `harmonyPalette()` function creates a matrix of colors. The first column contains the base color and specified harmonies, e.g., triadic colors. The columns that follow contain tints, tones, or shades of the harmonic colors for additional color choices, similar to `monoPalette()`.
█ EXAMPLE CODE
The example code at the end of the script generates and visualizes color schemes by processing user inputs. The code builds the scheme's palette based on the "Base color" input and the additional inputs in the "Settings/Inputs" tab:
• "Palette type" specifies whether the palette uses a custom gradient, monochromatic base color variants, or color harmonies with monochromatic variants.
• "Target color" sets the top color for the "Gradient" palette type.
• The "Gray luminance" inputs determine variation behavior for "Monochromatic" and "Harmony" palette types. If "Auto" is selected, the palette mixes the base color toward white or black based on its brightness. Otherwise, it mixes the color toward the grayscale color with the specified relative luminance (from 0 to 1).
• "Harmony type" specifies the color harmony used in the palette. Each row in the palette corresponds to one of the harmonious colors, starting with the base color.
The code creates a table on the first bar to display the collection of calculated colors. Each cell in the table shows the color's `getHexString()` value in a tooltip for simple inspection.
Look first. Then leap.
█ EXPORTED FUNCTIONS
Below is a complete list of the functions and overloads exported by this library.
getRGB(source)
Retrieves the sRGB red, green, blue, and transparency components of a "color" value.
getHexString(r, g, b, t)
(Overload 1 of 2) Converts a set of sRGB channel values to a string representing the corresponding color's hexadecimal form.
getHexString(source)
(Overload 2 of 2) Converts a "color" value to a string representing the sRGB color's hexadecimal form.
hexStringToRGB(source)
Converts a string representing an sRGB color's hexadecimal form to a set of decimal channel values.
hexStringToColor(source)
Converts a string representing an sRGB color's hexadecimal form to a "color" value.
getLRGB(r, g, b, t)
(Overload 1 of 2) Converts a set of sRGB channel values to a set of linear RGB values with specified transparency information.
getLRGB(source)
(Overload 2 of 2) Retrieves linear RGB channel values and transparency information from a "color" value.
lrgbToRGB(lr, lg, lb, t)
Converts a set of linear RGB channel values to a set of sRGB values with specified transparency information.
lrgbToColor(lr, lg, lb, t)
Converts a set of linear RGB channel values and transparency information to a "color" value.
getHSL(r, g, b, t)
(Overload 1 of 2) Converts a set of sRGB channels to a set of HSL values with specified transparency information.
getHSL(source)
(Overload 2 of 2) Retrieves HSL channel values and transparency information from a "color" value.
hslToRGB(h, s, l, t)
Converts a set of HSL channel values to a set of sRGB values with specified transparency information.
hslToColor(h, s, l, t)
Converts a set of HSL channel values and transparency information to a "color" value.
getHSV(r, g, b, t)
(Overload 1 of 2) Converts a set of sRGB channels to a set of HSV values with specified transparency information.
getHSV(source)
(Overload 2 of 2) Retrieves HSV channel values and transparency information from a "color" value.
hsvToRGB(h, s, v, t)
Converts a set of HSV channel values to a set of sRGB values with specified transparency information.
hsvToColor(h, s, v, t)
Converts a set of HSV channel values and transparency information to a "color" value.
getHWB(r, g, b, t)
(Overload 1 of 2) Converts a set of sRGB channels to a set of HWB values with specified transparency information.
getHWB(source)
(Overload 2 of 2) Retrieves HWB channel values and transparency information from a "color" value.
hwbToRGB(h, w, b, t)
Converts a set of HWB channel values to a set of sRGB values with specified transparency information.
hwbToColor(h, w, b, t)
Converts a set of HWB channel values and transparency information to a "color" value.
getXYZ(r, g, b, t)
(Overload 1 of 2) Converts a set of sRGB channels to a set of XYZ values with specified transparency information.
getXYZ(source)
(Overload 2 of 2) Retrieves XYZ channel values and transparency information from a "color" value.
xyzToRGB(x, y, z, t)
Converts a set of XYZ channel values to a set of sRGB values with specified transparency information
xyzToColor(x, y, z, t)
Converts a set of XYZ channel values and transparency information to a "color" value.
getXYY(r, g, b, t)
(Overload 1 of 2) Converts a set of sRGB channels to a set of xyY values with specified transparency information.
getXYY(source)
(Overload 2 of 2) Retrieves xyY channel values and transparency information from a "color" value.
xyyToRGB(xc, yc, y, t)
Converts a set of xyY channel values to a set of sRGB values with specified transparency information.
xyyToColor(xc, yc, y, t)
Converts a set of xyY channel values and transparency information to a "color" value.
getLAB(r, g, b, t)
(Overload 1 of 2) Converts a set of sRGB channels to a set of CIELAB values with specified transparency information.
getLAB(source)
(Overload 2 of 2) Retrieves CIELAB channel values and transparency information from a "color" value.
labToRGB(l, a, b, t)
Converts a set of CIELAB channel values to a set of sRGB values with specified transparency information.
labToColor(l, a, b, t)
Converts a set of CIELAB channel values and transparency information to a "color" value.
getOKLAB(r, g, b, t)
(Overload 1 of 2) Converts a set of sRGB channels to a set of Oklab values with specified transparency information.
getOKLAB(source)
(Overload 2 of 2) Retrieves Oklab channel values and transparency information from a "color" value.
oklabToRGB(l, a, b, t)
Converts a set of Oklab channel values to a set of sRGB values with specified transparency information.
oklabToColor(l, a, b, t)
Converts a set of Oklab channel values and transparency information to a "color" value.
getLCH(r, g, b, t)
(Overload 1 of 2) Converts a set of sRGB channels to a set of CIELCh values with specified transparency information.
getLCH(source)
(Overload 2 of 2) Retrieves CIELCh channel values and transparency information from a "color" value.
lchToRGB(l, c, h, t)
Converts a set of CIELCh channel values to a set of sRGB values with specified transparency information.
lchToColor(l, c, h, t)
Converts a set of CIELCh channel values and transparency information to a "color" value.
getOKLCH(r, g, b, t)
(Overload 1 of 2) Converts a set of sRGB channels to a set of Oklch values with specified transparency information.
getOKLCH(source)
(Overload 2 of 2) Retrieves Oklch channel values and transparency information from a "color" value.
oklchToRGB(l, c, h, t)
Converts a set of Oklch channel values to a set of sRGB values with specified transparency information.
oklchToColor(l, c, h, t)
Converts a set of Oklch channel values and transparency information to a "color" value.
contrastRatio(value1, value2)
Calculates the contrast ratio between two colors values based on the formula from version 2 of the Web Content Accessibility Guidelines (WCAG).
isLightTheme(source)
Detects whether a background color represents a light theme or dark theme, based on the amount of contrast between the color and the white and black points.
grayscale(source)
Calculates the grayscale version of a color with the same relative luminance (i.e., brightness).
negative(source, colorSpace)
Calculates the negative (i.e., inverted) form of a specified color.
complement(source, colorSpace)
Calculates the complementary color for a `source` color using a cylindrical color space.
analogousColors(source, colorSpace)
Calculates the analogous colors for a `source` color using a cylindrical color space.
splitComplements(source, colorSpace)
Calculates the split-complementary colors for a `source` color using a cylindrical color space.
triadicColors(source, colorSpace)
Calculates the two triadic colors for a `source` color using a cylindrical color space.
tetradicColors(source, colorSpace, square)
Calculates the three square or rectangular tetradic colors for a `source` color using a cylindrical color space.
pentadicColors(source, colorSpace)
Calculates the four pentadic colors for a `source` color using a cylindrical color space.
hexadicColors(source, colorSpace)
Calculates the five hexadic colors for a `source` color using a cylindrical color space.
add(value1, value2, transpWeight)
Additively mixes two "color" values, with optional transparency weighting.
overlay(fg, bg)
Estimates the resulting color that appears on the chart when placing one color over another.
fromGradient(value, bottomValue, topValue, bottomColor, topColor, colorSpace)
Calculates the gradient color that corresponds to a specific value based on a defined value range and color space.
fromMultiStepGradient(value, steps, colors, colorSpace)
Calculates a multi-step gradient color that corresponds to a specific value based on an array of step points, an array of corresponding colors, and a color space.
gradientPalette(baseColor, stopColor, steps, strength, model)
Generates a palette from a gradient between two base colors.
monoPalette(baseColor, grayLuminance, variations, strength, colorSpace)
Generates a monochromatic palette from a specified base color.
harmonyPalette(baseColor, harmonyType, grayLuminance, variations, strength, colorSpace)
Generates a palette consisting of harmonious base colors and their monochromatic variants.

AdvancedOFPIAnalyzerLibrary "AdvancedOFPIAnalyzer"
Advanced Order Flow Pressure Index Analyzer Library
Implements sophisticated volume distribution analysis with candle microstructure
Provides comprehensive order flow assessment for institutional activity detection
analyzeAdvancedOrderFlow(priceOpen, priceHigh, priceLow, priceClose, volumeData, analysisWindow, institutionalSensitivity)
Performs comprehensive order flow analysis with advanced institutional detection
Parameters:
priceOpen (float) : float Opening price for analysis
priceHigh (float) : float High price for range calculation
priceLow (float) : float Low price for support detection
priceClose (float) : float Closing price for trend assessment
volumeData (float) : float Volume data for flow analysis
analysisWindow (int) : int Analysis window period
institutionalSensitivity (float) : float Institutional detection sensitivity
Returns: OFPI, momentum, institutional detected, strength, phase, overall strength, class, volume available, trend, efficiency, market structure
calculateMicrostructurePressure(priceOpen, priceHigh, priceLow, priceClose, volumeData, microWindow)
Calculates sophisticated order flow pressure with comprehensive candle microstructure analysis
Parameters:
priceOpen (float) : float Opening price for pressure calculation
priceHigh (float) : float High price for range analysis
priceLow (float) : float Low price for support detection
priceClose (float) : float Closing price for trend assessment
volumeData (float) : float Volume data for pressure analysis
microWindow (int) : int Microstructure analysis window
Returns: Pressure index, buying pressure, selling pressure, body ratio, upper wick ratio, lower wick ratio, microstructure confidence, volume confirmation, institutional pressure, pressure velocity, microstructure quality
generateInstitutionalAlerts(priceClose, volumeData, alertSensitivity, lookbackPeriod)
Generates sophisticated volume-weighted institutional activity alerts
Parameters:
priceClose (float) : float Close price for analysis
volumeData (float) : float Volume data for detection
alertSensitivity (float) : float Alert sensitivity threshold
lookbackPeriod (int) : int Analysis lookback period
Returns: Institutional detected, alert level, phase, strength, volume signature, pressure signature, time signature, absorption signature, impact signature, reliability, active methods, priority

EnhancedSignalGeneratorLibrary "EnhancedSignalGenerator"
Enhanced Signal Generator – clean v6 implementation (UDT-based)
generateAdvancedSignal(unifiedScore, trendComp, momInd, volFactor, qualScore, cyclePos, regime)
Generates advanced signal analysis with multi-pathway evaluation
Parameters:
unifiedScore (float) : Unified market score input
trendComp (float) : Trend component analysis factor
momInd (float) : Momentum indicator value
volFactor (float) : Volatility adjustment factor
qualScore (float) : Quality assessment metric
cyclePos (float) : Market cycle position (0.0-1.0, where 0.5 = neutral cycle phase)
regime (string) : Market regime classification string ("bull", "bear", "sideways", "volatile")
Returns: Signal Comprehensive signal analysis result
analyzePatternSignals(h, l, c, v, w, reg)
Analyzes pattern-based signal components with multi-dimensional price action evaluation
Parameters:
h (float) : High price value for range analysis
l (float) : Low price value for support/resistance detection
c (float) : Close price value for momentum assessment
v (float) : Volume data for confirmation analysis
w (int) : Analysis window period for pattern formation timeframe
reg (string) : Market regime string for context-aware pattern interpretation
Returns: Signal Pattern analysis signal with comprehensive technical evaluation
optimizeSignalParameters(s, p, w, m)
Optimizes signal generation parameters through advanced statistical analysis
Parameters:
s (array) : Signal array input for performance evaluation
p (array) : Parameter array input for optimization target values
w (int) : Window period for rolling optimization analysis
m (string) : Optimization method string ("sharpe", "sortino", "calmar", "variance")
Returns: float Optimization result score representing parameter fitness
Signal
Signal data structure for market analysis
Fields:
dir (series int) : Signal direction: +1 bull, -1 bear, 0 flat
strength (series float) : Signal strength magnitude (0-1)
conf (series float) : Confidence level (0-1)
rationale (series string) : Human-readable explanation
source (series string) : Signal source classification
quality (series float) : Blended quality assessment score

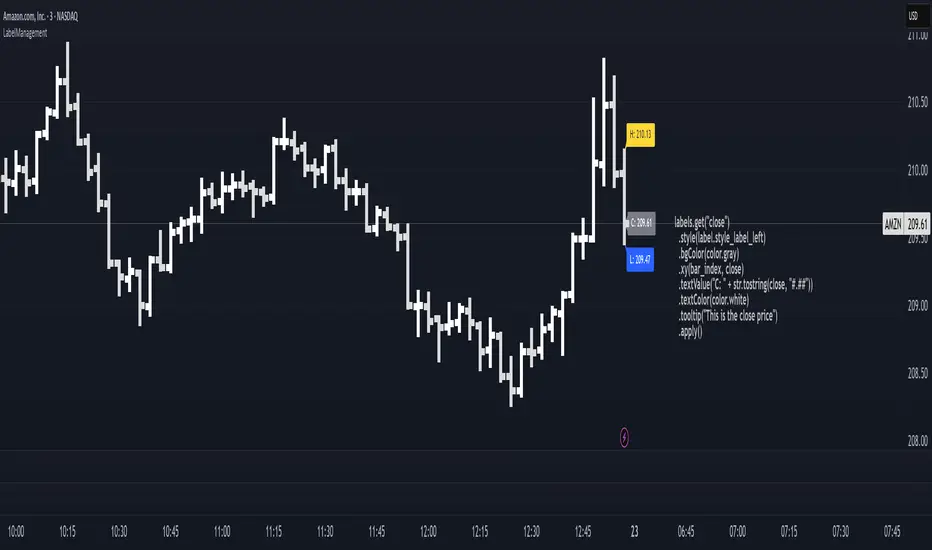
LabelManagementLabel management with fluent configuration, change tracking, and named registry
LabelManagement is a Pine Script library for creating and managing dynamic chart labels. Built with a fluent-style API , it simplifies label creation, styling, positioning, and content updates through method chaining and centralized control.
Manage 'sticky' labels easily across bars with expressive, readable code that reduces clutter and improves code clarity.
Example usage:
// Close label – to the right of the last bar
labels.get("close")
.style(label.style_label_left)
.bgColor(color.gray)
.xy(bar_index, close)
.textValue("C: " + str.tostring(close, "#.##"))
.textColor(color.white)
.tooltip("This is the close price")
.apply()
Key features:
Fluent API – Build and update labels using a chainable configuration flow
Named label registry – Access and manage labels by name, e.g., "entry", "stop", "target"
Change tracking – Update only when necessary to reduce redraws
Deferred application – Apply all changes in one efficient operation
Centralized control – Works well in modular or multi-label environments
This library is designed for Pine developers who want more control and less boilerplate when managing visual elements on the chart.
method clone(this)
Creates a new LabelConfig by copying all properties from this instance
Namespace types: LabelConfig
Parameters:
this (LabelConfig) : (LabelConfig) The LabelConfig instance
Returns: (LabelConfig) New LabelConfig instance with identical properties
method applyTo(this, target)
Applies configuration to specified label (required parameter)
Namespace types: LabelConfig
Parameters:
this (LabelConfig) : (LabelConfig) The LabelConfig instance
target (label) : (label) Label to apply config to
Returns: (LabelConfig) Self-reference for method chaining
method update(this, updates)
Creates a new LabelUpdater with change tracking for this label
Namespace types: series label
Parameters:
this (label) : (label) The label instance
updates (LabelConfig) : (LabelConfig) Optional existing config to apply and reuse (if provided, applies to label first)
Returns: (LabelUpdater) New LabelUpdater with blank configs for change tracking
method x(this, value)
Sets the X coordinate with change tracking (fluent interface)
Namespace types: LabelUpdater
Parameters:
this (LabelUpdater) : (LabelUpdater) The LabelUpdater instance
value (int) : (int) New X coordinate
Returns: (LabelUpdater) Self-reference for method chaining
method y(this, value)
Sets the Y coordinate with change tracking (fluent interface)
Namespace types: LabelUpdater
Parameters:
this (LabelUpdater) : (LabelUpdater) The LabelUpdater instance
value (float) : (float) New Y coordinate
Returns: (LabelUpdater) Self-reference for method chaining
method xy(this, x, y)
Sets both X and Y coordinates with change tracking (fluent interface)
Namespace types: LabelUpdater
Parameters:
this (LabelUpdater) : (LabelUpdater) The LabelUpdater instance
x (int) : (int) New X coordinate
y (float) : (float) New Y coordinate
Returns: (LabelUpdater) Self-reference for method chaining
method textValue(this, value)
Sets the text content with change tracking (fluent interface)
Namespace types: LabelUpdater
Parameters:
this (LabelUpdater) : (LabelUpdater) The LabelUpdater instance
value (string) : (string) New text content
Returns: (LabelUpdater) Self-reference for method chaining
method textColor(this, value)
Sets the text color with change tracking (fluent interface)
Namespace types: LabelUpdater
Parameters:
this (LabelUpdater) : (LabelUpdater) The LabelUpdater instance
value (color) : (color) New text color
Returns: (LabelUpdater) Self-reference for method chaining
method textSize(this, value)
Sets the text size with change tracking (fluent interface)
Namespace types: LabelUpdater
Parameters:
this (LabelUpdater) : (LabelUpdater) The LabelUpdater instance
value (string) : (string) New text size
Returns: (LabelUpdater) Self-reference for method chaining
method bgColor(this, value)
Sets the background color with change tracking (fluent interface)
Namespace types: LabelUpdater
Parameters:
this (LabelUpdater) : (LabelUpdater) The LabelUpdater instance
value (color) : (color) New background color
Returns: (LabelUpdater) Self-reference for method chaining
method style(this, value)
Sets the label style with change tracking (fluent interface)
Namespace types: LabelUpdater
Parameters:
this (LabelUpdater) : (LabelUpdater) The LabelUpdater instance
value (string) : (string) New style
Returns: (LabelUpdater) Self-reference for method chaining
method yloc(this, value)
Sets the Y location mode with change tracking (fluent interface)
Namespace types: LabelUpdater
Parameters:
this (LabelUpdater) : (LabelUpdater) The LabelUpdater instance
value (string) : (string) New yloc
Returns: (LabelUpdater) Self-reference for method chaining
method xloc(this, value)
Sets the X location mode with change tracking (fluent interface)
Namespace types: LabelUpdater
Parameters:
this (LabelUpdater) : (LabelUpdater) The LabelUpdater instance
value (string) : (string) New xloc
Returns: (LabelUpdater) Self-reference for method chaining
method tooltip(this, value)
Sets the tooltip content with change tracking (fluent interface)
Namespace types: LabelUpdater
Parameters:
this (LabelUpdater) : (LabelUpdater) The LabelUpdater instance
value (string) : (string) New tooltip content
Returns: (LabelUpdater) Self-reference for method chaining
method size(this, value)
Sets the text size with change tracking (fluent interface) - alias for textSize
Namespace types: LabelUpdater
Parameters:
this (LabelUpdater) : (LabelUpdater) The LabelUpdater instance
value (string) : (string) New text size
Returns: (LabelUpdater) Self-reference for method chaining
method size(this)
Gets the count of registered labels
Namespace types: LabelManager
Parameters:
this (LabelManager) : (LabelManager) The LabelManager instance
Returns: (int) Number of labels in the registry
method apply(this)
Applies pending changes to linked label and updates tracking
Namespace types: LabelUpdater
Parameters:
this (LabelUpdater) : (LabelUpdater) The LabelUpdater instance
Returns: (LabelUpdater) Self-reference for method chaining
method get(this, name)
Gets or creates a LabelUpdater for the specified name
Namespace types: LabelManager
Parameters:
this (LabelManager) : (LabelManager) The LabelManager instance
name (string) : (string) Unique identifier for the label
Returns: (LabelUpdater) Existing or newly created LabelUpdater for the name
method has(this, name)
Checks if a label with the specified name exists
Namespace types: LabelManager
Parameters:
this (LabelManager) : (LabelManager) The LabelManager instance
name (string) : (string) Name to check for existence
Returns: (bool) True if label exists, false otherwise
method remove(this, name)
Removes a label from the registry and deletes the underlying Pine Script label
Namespace types: LabelManager
Parameters:
this (LabelManager) : (LabelManager) The LabelManager instance
name (string) : (string) Name of the label to remove
Returns: (LabelManager) Self-reference for method chaining
method clear(this)
Removes all labels from registry and deletes all underlying Pine Script labels
Namespace types: LabelManager
Parameters:
this (LabelManager) : (LabelManager) The LabelManager instance
Returns: (LabelManager) Self-reference for method chaining
newManager()
Creates a new LabelManager with empty registry
Returns: (LabelManager) New LabelManager instance ready for use
LabelConfig
LabelConfig Configuration object for label appearance and positioning
Fields:
x (series int) : (series int) X-coordinate (na = unchanged)
y (series float) : (series float) Y-coordinate (na = unchanged)
style (series string) : (series string) Label style (na = unchanged)
yloc (series string) : (series string) Y-location type (na = unchanged)
xloc (series string) : (series string) X-location type (na = unchanged)
bgColor (series color) : (series color) Background color (na = unchanged)
textValue (series string) : (series string) Label text content (na = unchanged)
textSize (series string) : (series string) Text size (na = unchanged)
textColor (series color) : (series color) Text color (na = unchanged)
tooltip (series string) : (series string) Tooltip text (na = unchanged)
LabelUpdater
LabelUpdater Smart label updater with change tracking and minimal updates
Fields:
label (series label) : (label) Reference to the label being updated
latest (LabelConfig) : (LabelConfig) Current known state of the label
updates (LabelConfig) : (LabelConfig) Pending changes to apply
LabelManager
LabelManager Central registry for managing named labels with automatic creation
Fields:
registry (map) : (map) Internal storage mapping names to LabelUpdater instances
LMAsLibrary "LMAs"
Credits
Thank you to @QuantraSystems for dynamic calculations.
Introduction
This lightweight library offers dynamic implementations of popular moving averages that adapt their length automatically as new bars are added to the chart.
Each function is built on a dynamic length formula:
len = math.min(maxLength, bar_index + 1)
This approach ensures that calculations begin as early as the first bar, allowing for smoother initialization and more consistent behavior across all timeframes. It’s especially useful in custom scripts that run from bar 0 or when historical data is limited.
Usage
You can use this library as a drop-in replacement for standard moving averages. It provides more flexibility and stability in live or backtesting environments where fixed-length indicators may delay or fail to initialize properly.
Why Use This?
• Works from the very first bar
• Avoids na values during early bars
• Great for real-time indicators, strategies, and bar-replay
• Clean and efficient code with dynamic behavior
How to Use
Import the library into your script and call any of the included functions just like you would with their native counterparts.
Summary
A lightweight Pine Script™ library offering dynamic moving averages that work seamlessly from the very first bar. Ideal for strategies and indicators requiring robust initialization and adaptive behavior.
SMA(sourceData, maxLength)
Dynamic SMA
Parameters:
sourceData (float)
maxLength (int)
EMA(src, length)
Dynamic EMA
Parameters:
src (float)
length (int)
DEMA(src, length)
Dynamic DEMA
Parameters:
src (float)
length (int)
TEMA(src, length)
Dynamic TEMA
Parameters:
src (float)
length (int)
WMA(src, length)
Dynamic WMA
Parameters:
src (float)
length (int)
HMA(src, length)
Dynamic HMA
Parameters:
src (float)
length (int)
VWMA(src, volsrc, length)
Dynamic VWMA
Parameters:
src (float)
volsrc (float)
length (int)
SMMA(src, length)
Dynamic SMMA
Parameters:
src (float)
length (int)
LSMA(src, length, offset)
Dynamic LSMA
Parameters:
src (float)
length (int)
offset (int)
RMA(src, length)
Dynamic RMA
Parameters:
src (float)
length (int)
ALMA(src, length, offset_sigma, sigma)
Dynamic ALMA
Parameters:
src (float)
length (int)
offset_sigma (float)
sigma (float)
ZLSMA(src, length)
Dynamic ZLSMA
Parameters:
src (float)
length (int)
FRAMA(src, length)
Parameters:
src (float)
length (int)
KAMA(src, length)
Dynamic KAMA
Parameters:
src (float)
length (int)
JMA(src, length, phase)
Dynamic JMA
Parameters:
src (float)
length (int)
phase (float)
T3(src, length, volumeFactor)
Dynamic T3
Parameters:
src (float)
length (int)
volumeFactor (float)

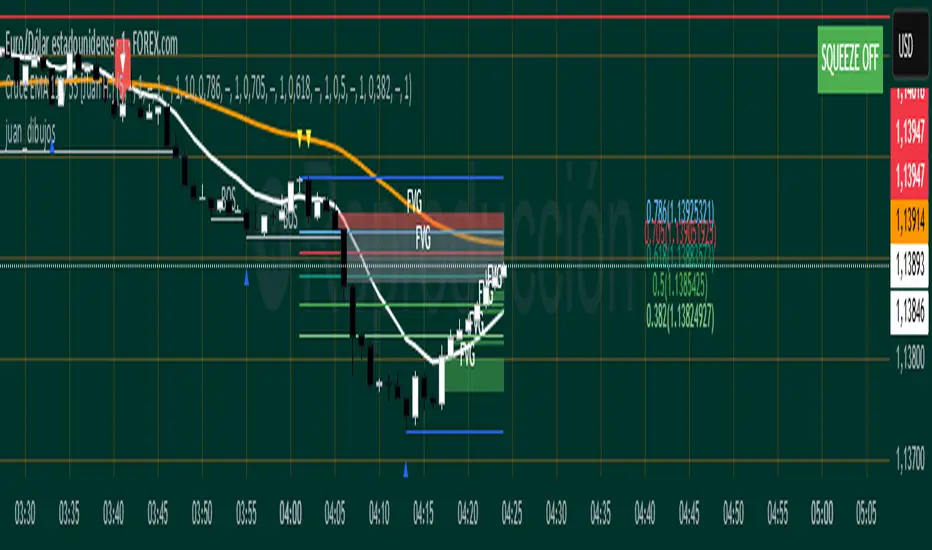
juan_dibujosLibrary "juan_dibujos"
extend_line(lineId, labelId)
: Extend specific line with its label
Parameters:
lineId (line)
labelId (label)
update_line_coordinates(lineId, labelId, x1, y1, x2, y2)
: Update specific line coordinates with its label
Parameters:
lineId (line)
labelId (label)
x1 (int)
y1 (float)
x2 (int)
y2 (float)
update_label_coordinates(labelId, value)
: Update coordinates of a label
Parameters:
labelId (label)
value (float)
delete_line(lineId, labelId)
: Delete specific line with its label
Parameters:
lineId (line)
labelId (label)
update_box_coordinates(boxId, labelId, left, top, right, bottom)
: Update specific box coordinates with its label
Parameters:
boxId (box)
labelId (label)
left (int)
top (float)
right (int)
bottom (float)
delete_box(boxId, labelId)
: Delete specific box with its label
Parameters:
boxId (box)
labelId (label)
lib_core_utilsLibrary "lib_core_utils"
Core utility functions for Pine Script strategies
Provides safe mathematical operations, array management, and basic helpers
Version: 1.0.0
Author: NQ Hybrid Strategy Team
Last Updated: 2025-06-18
===================================================================
safe_division(numerator, denominator)
safe_division
@description Performs division with safety checks for zero denominators and invalid values
Parameters:
numerator (float) : (float) The numerator value
denominator (float) : (float) The denominator value
Returns: (float) Result of division, or 0.0 if invalid
safe_division_detailed(numerator, denominator)
safe_division_detailed
@description Enhanced division with detailed result information
Parameters:
numerator (float) : (float) The numerator value
denominator (float) : (float) The denominator value
Returns: (SafeCalculationResult) Detailed calculation result
safe_multiply(a, b)
safe_multiply
@description Performs multiplication with safety checks for overflow and invalid values
Parameters:
a (float) : (float) First multiplier
b (float) : (float) Second multiplier
Returns: (float) Result of multiplication, or 0.0 if invalid
safe_add(a, b)
safe_add
@description Performs addition with safety checks
Parameters:
a (float) : (float) First addend
b (float) : (float) Second addend
Returns: (float) Result of addition, or 0.0 if invalid
safe_subtract(a, b)
safe_subtract
@description Performs subtraction with safety checks
Parameters:
a (float) : (float) Minuend
b (float) : (float) Subtrahend
Returns: (float) Result of subtraction, or 0.0 if invalid
safe_abs(value)
safe_abs
@description Safe absolute value calculation
Parameters:
value (float) : (float) Input value
Returns: (float) Absolute value, or 0.0 if invalid
safe_max(a, b)
safe_max
@description Safe maximum value calculation
Parameters:
a (float) : (float) First value
b (float) : (float) Second value
Returns: (float) Maximum value, handling NA cases
safe_min(a, b)
safe_min
@description Safe minimum value calculation
Parameters:
a (float) : (float) First value
b (float) : (float) Second value
Returns: (float) Minimum value, handling NA cases
safe_array_get(arr, index)
safe_array_get
@description Safely retrieves value from array with bounds checking
Parameters:
arr (array) : (array) The array to access
index (int) : (int) Index to retrieve
Returns: (float) Value at index, or na if invalid
safe_array_push(arr, value, max_size)
safe_array_push
@description Safely pushes value to array with size management
Parameters:
arr (array) : (array) The array to modify
value (float) : (float) Value to push
max_size (int) : (int) Maximum array size
Returns: (bool) True if push was successful
safe_array_unshift(arr, value, max_size)
safe_array_unshift
@description Safely adds value to beginning of array with size management
Parameters:
arr (array) : (array) The array to modify
value (float) : (float) Value to add at beginning
max_size (int) : (int) Maximum array size
Returns: (bool) True if unshift was successful
get_array_stats(arr, max_size)
get_array_stats
@description Gets statistics about an array
Parameters:
arr (array) : (array) The array to analyze
max_size (int) : (int) The maximum allowed size
Returns: (ArrayStats) Statistics about the array
cleanup_array(arr, target_size)
cleanup_array
@description Cleans up array by removing old elements if it's too large
Parameters:
arr (array) : (array) The array to cleanup
target_size (int) : (int) Target size after cleanup
Returns: (int) Number of elements removed
is_valid_price(price)
is_valid_price
@description Checks if a price value is valid for trading calculations
Parameters:
price (float) : (float) Price to validate
Returns: (bool) True if price is valid
is_valid_volume(vol)
is_valid_volume
@description Checks if a volume value is valid
Parameters:
vol (float) : (float) Volume to validate
Returns: (bool) True if volume is valid
sanitize_price(price, default_value)
sanitize_price
@description Sanitizes price value to ensure it's within valid range
Parameters:
price (float) : (float) Price to sanitize
default_value (float) : (float) Default value if price is invalid
Returns: (float) Sanitized price value
sanitize_percentage(pct)
sanitize_percentage
@description Sanitizes percentage value to 0-100 range
Parameters:
pct (float) : (float) Percentage to sanitize
Returns: (float) Sanitized percentage (0-100)
is_session_active(session_string, timezone)
Parameters:
session_string (string)
timezone (string)
get_session_progress(session_string, timezone)
Parameters:
session_string (string)
timezone (string)
format_price(price, decimals)
Parameters:
price (float)
decimals (int)
format_percentage(pct, decimals)
Parameters:
pct (float)
decimals (int)
bool_to_emoji(condition, true_emoji, false_emoji)
Parameters:
condition (bool)
true_emoji (string)
false_emoji (string)
log_debug(message, level)
Parameters:
message (string)
level (string)
benchmark_start()
benchmark_end(start_time)
Parameters:
start_time (int)
get_library_info()
get_library_version()
SafeCalculationResult
SafeCalculationResult
Fields:
value (series float) : (float) The calculated value
is_valid (series bool) : (bool) Whether the calculation was successful
error_message (series string) : (string) Error description if calculation failed
ArrayStats
ArrayStats
Fields:
size (series int) : (int) Current array size
max_size (series int) : (int) Maximum allowed size
is_full (series bool) : (bool) Whether array has reached max capacity

TAIndicatorsThis library offers a comprehensive suite of enhanced technical indicator functions, building upon TradingView's built-in indicators. The primary advantage of this library is its expanded flexibility, allowing you to select from a wider range of moving average types for calculations and smoothing across various indicators.
The core difference between these functions and TradingView's standard ones is the ability to specify different moving average types beyond the default. While a standard ta.rsi() is fixed, the rsi() in this library, for example, can be smoothed by an 'SMMA (RMA)', 'WMA', 'VWMA', or others, giving you greater control over your analysis.
█ FEATURES
This library provides enhanced versions of the following popular indicators:
Moving Average (ma): A versatile MA function that includes optional secondary smoothing and Bollinger Bands.
RSI (rsi): Calculate RSI with an optional smoothed signal line using various MA types, plus built-in divergence detection.
MACD (macd): A MACD function where you can define the MA type for both the main calculation and the signal line.
ATR (atr): An ATR function that allows for different smoothing types.
VWAP (vwap): A comprehensive anchored VWAP with multiple configurable bands.
ADX (adx): A standard ADX calculation.
Cumulative Volume Delta (cvd): Provides CVD data based on a lower timeframe.
Bollinger Bands (bb): Create Bollinger Bands with a customizable MA type for the basis line.
Keltner Channels (kc): Keltner Channels with selectable MA types and band styles.
On-Balance Volume (obv): An OBV indicator with an optional smoothed signal line using various MA types.
... and more to come! This library will be actively maintained, with new useful indicator functions added over time.
█ HOW TO USE
To use this library in your scripts, import it using its publishing link. You can then call the functions directly.
For example, to calculate a Weighted Moving Average (WMA) and then smooth it with a Simple Moving Average (SMA) :
import ActiveQuants/TAIndicators/1 as tai
// Calculate a 20-period WMA of the close
// Then, smooth the result with a 10-period SMA
= tai.ma("WMA", close, 20, "SMA", 10)
plot(myWma, color = color.blue)
plot(smoothedWma, color = color.orange)
█ Why Choose This Library?
If you're looking for more control and customization than what's offered by the standard built-in functions, this library is for you. By allowing for a variety of smoothing methods across multiple indicators, it enables a more nuanced and personalized approach to technical analysis. Fine-tune your indicators to better fit your trading style and strategies.

BackTestLibLibrary "BackTestLib"
Allows backtesting indicator performance. Tracks typical metrics such as won/loss, profit factor, draw down, etc. Trading View strategy library provides similar (and more comprehensive)
functionality but only works with strategies. This libary was created to address performance tracking within indicators.
Two primary outputs are generated:
1. Summary Table: Displays overall performance metrics for the indicator over the chart's loaded timeframe and history
2. Details Table: Displays a table of individual trade entries and exits. This table can grow larger than the available chart space. It does have a max number of rows supported. I haven't
found a way to add scroll bars or scroll bar equivalents yet.
f_init(data, _defaultStopLoss, _defaultTakeProfit, _useTrailingStop, _useTraingStopToBreakEven, _trailingStopActivation, _trailingStopOffset)
f_init Initialize the backtest data type. Called prior to using the backtester functions
Parameters:
data (backtesterData) : backtesterData to initialize
_defaultStopLoss (float) : Default trade stop loss to apply
_defaultTakeProfit (float) : Default trade take profit to apply
_useTrailingStop (bool) : Trailing stop enabled
_useTraingStopToBreakEven (bool) : When trailing stop active, trailing stop will increase no further than the entry price
_trailingStopActivation (int) : When trailing stop active, trailing will begin once price exceeds base stop loss by this number of points
_trailingStopOffset (int) : When trailing stop active, it will trail the max price achieved by this number of points
Returns: Initialized data set
f_buildResultStr(_resultType, _price, _resultPoints, _numWins, _pointsWon, _numLoss, _pointsLost)
f_buildResultStr Helper function to construct a string of resutling data for exit tooltip labels
Parameters:
_resultType (string)
_price (float)
_resultPoints (float)
_numWins (int)
_pointsWon (float)
_numLoss (int)
_pointsLost (float)
f_buildResultLabel(data, labelVertical, labelOffset, long)
f_buildResultLabel Helper function to construct an Exit label for display on the chart
Parameters:
data (backtesterData)
labelVertical (bool)
labelOffset (int)
long (bool)
f_updateTrailingStop(_entryPrice, _curPrice, _sl, _tp, trailingStopActivationInput, trailingStopOffsetInput, useTrailingStopToBreakEven)
f_updateTrailingStop Helper function to advance the trailing stop as price action dictates
Parameters:
_entryPrice (float)
_curPrice (float)
_sl (float)
_tp (float)
trailingStopActivationInput (float)
trailingStopOffsetInput (float)
useTrailingStopToBreakEven (bool)
Returns: Updated stop loss for current price action
f_enterShort(data, entryPrice, fixedStopLoss)
f_enterShort Helper function to enter a short and collect data necessary for tracking the trade entry
Parameters:
data (backtesterData)
entryPrice (float)
fixedStopLoss (float)
Returns: Updated backtest data
f_enterLong(data, entryPrice, fixedStopLoss)
f_enterLong Helper function to enter a long and collect data necessary for tracking the trade entry
Parameters:
data (backtesterData)
entryPrice (float)
fixedStopLoss (float)
Returns: Updated backtest data
f_exitTrade(data)
f_enterLong Helper function to exit a trade and update/reset tracking data
Parameters:
data (backtesterData)
Returns: Updated backtest data
f_checkTradeConditionForExit(data, condition, curPrice, enableRealTime)
f_checkTradeConditionForExit Helper function to determine if provided condition indicates an exit
Parameters:
data (backtesterData)
condition (bool) : When true trade will exit
curPrice (float)
enableRealTime (bool) : When true trade will evaluate if barstate is relatime or barstate is confirmed; otherwise just checks on is confirmed
Returns: Updated backtest data
f_checkTrade(data, curPrice, curLow, curHigh, enableRealTime)
f_checkTrade Helper function to determine if current price action dictates stop loss or take profit exit
Parameters:
data (backtesterData)
curPrice (float)
curLow (float)
curHigh (float)
enableRealTime (bool) : When true trade will evaluate if barstate is relatime or barstate is confirmed; otherwise just checks on is confirmed
Returns: Updated backtest data
f_fillCell(_table, _column, _row, _title, _value, _bgcolor, _txtcolor, _text_size)
f_fillCell Helper function to construct result table cells
Parameters:
_table (table)
_column (int)
_row (int)
_title (string)
_value (string)
_bgcolor (color)
_txtcolor (color)
_text_size (string)
Returns: Table cell
f_prepareStatsTable(data, drawTesterSummary, drawTesterDetails, summaryTableTextSize, detailsTableTextSize, displayRowZero, summaryTableLocation, detailsTableLocation)
f_fillCell Helper function to populate result table
Parameters:
data (backtesterData)
drawTesterSummary (bool)
drawTesterDetails (bool)
summaryTableTextSize (string)
detailsTableTextSize (string)
displayRowZero (bool)
summaryTableLocation (string)
detailsTableLocation (string)
Returns: Updated backtest data
backtesterData
backtesterData - container for backtest performance metrics
Fields:
tradesArray (array) : Array of strings with entries for each individual trade and its results
pointsBalance (series float) : Running sum of backtest points won/loss results
drawDown (series float) : Running sum of backtest total draw down points
maxDrawDown (series float) : Running sum of backtest total draw down points
maxRunup (series float) : Running sum of max points won over the backtest
numWins (series int) : Number of wins of current backtes set
numLoss (series int) : Number of losses of current backtes set
pointsWon (series float) : Running sum of points won to date
pointsLost (series float) : Running sum of points lost to date
entrySide (series string) : Current entry long/short
tradeActive (series bool) : Indicates if a trade is currently active
tradeComplete (series bool) : Indicates if a trade just exited (due to stop loss or take profit)
entryPrice (series float) : Current trade entry price
entryTime (series int) : Current trade entry time
sl (series float) : Current trade stop loss
tp (series float) : Current trade take profit
defaultStopLoss (series float) : Default trade stop loss to apply
defaultTakeProfit (series float) : Default trade take profit to apply
useTrailingStop (series bool) : Trailing stop enabled
useTrailingStopToBreakEven (series bool) : When trailing stop active, trailing stop will increase no further than the entry price
trailingStopActivation (series int) : When trailing stop active, trailing will begin once price exceeds base stop loss by this number of points
trailingStopOffset (series int) : When trailing stop active, it will trail the max price achieved by this number of points
resultType (series string) : Current trade won/lost
exitPrice (series float) : Current trade exit price
resultPoints (series float) : Current trade points won/lost
summaryTable (series table) : Table to deisplay summary info
tradesTable (series table) : Table to display per trade info

light_logLight Log - A Defensive Programming Library for Pine Script
Overview
The Light Log library transforms Pine Script development by introducing structured logging and defensive programming patterns typically found in enterprise languages like C#. This library addresses a fundamental challenge in Pine Script: the lack of sophisticated error handling and debugging tools that developers expect when building complex trading systems.
At its core, Light Log provides three transformative capabilities that work together to create more reliable and maintainable code. First, it wraps all native Pine Script types in error-aware containers, allowing values to carry validation state alongside their data. Second, it offers a comprehensive logging system with severity levels and conditional rendering. Third, it includes defensive programming utilities that catch errors early and make code self-documenting.
The Philosophy of Errors as Values
Traditional Pine Script error handling relies on runtime errors that halt execution, making it difficult to build resilient systems that can gracefully handle edge cases. Light Log introduces a paradigm shift by treating errors as first-class values that flow through your program alongside regular data.
When you wrap a value using Light Log's type system, you're not just storing data – you're creating a container that can carry both the value and its validation state. For example, when you call myNumber.INT() , you receive an INT object that contains both the integer value and a Log object that can describe any issues with that value. This approach, inspired by functional programming languages, allows errors to propagate through calculations without causing immediate failures.
Consider how this changes error handling in practice. Instead of a calculation failing catastrophically when it encounters invalid input, it can produce a result object that contains both the computed value (which might be na) and a detailed log explaining what went wrong. Subsequent operations can check has_error() to decide whether to proceed or handle the error condition gracefully.
The Typed Wrapper System
Light Log provides typed wrappers for every native Pine Script type: INT, FLOAT, BOOL, STRING, COLOR, LINE, LABEL, BOX, TABLE, CHART_POINT, POLYLINE, and LINEFILL. These wrappers serve multiple purposes beyond simple value storage.
Each wrapper type contains two fields: the value field v holds the actual data, while the error field e contains a Log object that tracks the value's validation state. This dual nature enables powerful programming patterns. You can perform operations on wrapped values and accumulate error information along the way, creating an audit trail of how values were processed.
The wrapper system includes convenient methods for converting between wrapped and unwrapped values. The extension methods like INT() , FLOAT() , etc., make it easy to wrap existing values, while the from_INT() , from_FLOAT() methods extract the underlying values when needed. The has_error() method provides a consistent interface for checking whether any wrapped value has encountered issues during processing.
The Log Object: Your Debugging Companion
The Log object represents the heart of Light Log's debugging capabilities. Unlike simple string concatenation for error messages, the Log object provides a structured approach to building, modifying, and rendering diagnostic information.
Each Log object carries three essential pieces of information: an error type (info, warning, error, or runtime_error), a message string that can be built incrementally, and an active flag that controls conditional rendering. This structure enables sophisticated logging patterns where you can build up detailed diagnostic information throughout your script's execution and decide later whether and how to display it.
The Log object's methods support fluent chaining, allowing you to build complex messages in a readable way. The write() and write_line() methods append text to the log, while new_line() adds formatting. The clear() method resets the log for reuse, and the rendering methods ( render_now() , render_condition() , and the general render() ) control when and how messages appear.
Defensive Programming Made Easy
Light Log's argument validation functions transform how you write defensive code. Instead of cluttering your functions with verbose validation logic, you can use concise, self-documenting calls that make your intentions clear.
The argument_error() function provides strict validation that halts execution when conditions aren't met – perfect for catching programming errors early. For less critical issues, argument_log_warning() and argument_log_error() record problems without stopping execution, while argument_log_info() provides debug visibility into your function's behavior.
These functions follow a consistent pattern: they take a condition to check, the function name, the argument name, and a descriptive message. This consistency makes error messages predictable and helpful, automatically formatting them to show exactly where problems occurred.
Building Modular, Reusable Code
Light Log encourages a modular approach to Pine Script development by providing tools that make functions more self-contained and reliable. When functions validate their inputs and return wrapped values with error information, they become true black boxes that can be safely composed into larger systems.
The void_return() function addresses Pine Script's requirement that all code paths return a value, even in error handling branches. This utility function provides a clean way to satisfy the compiler while making it clear that a particular code path should never execute.
The static log pattern, initialized with init_static_log() , enables module-wide error tracking. You can create a persistent Log object that accumulates information across multiple function calls, building a comprehensive diagnostic report that helps you understand complex behaviors in your indicators and strategies.
Real-World Applications
In practice, Light Log shines when building sophisticated trading systems. Imagine developing a complex indicator that processes multiple data streams, performs statistical calculations, and generates trading signals. With Light Log, each processing stage can validate its inputs, perform calculations, and pass along both results and diagnostic information.
For example, a moving average calculation might check that the period is positive, that sufficient data exists, and that the input series contains valid values. Instead of failing silently or throwing runtime errors, it can return a FLOAT object that contains either the calculated average or a detailed explanation of why the calculation couldn't be performed.
Strategy developers benefit even more from Light Log's capabilities. Complex entry and exit logic often involves multiple conditions that must all be satisfied. With Light Log, each condition check can contribute to a comprehensive log that explains exactly why a trade was or wasn't taken, making strategy debugging and optimization much more straightforward.
Performance Considerations
While Light Log adds a layer of abstraction over raw Pine Script values, its design minimizes performance impact. The wrapper objects are lightweight, containing only two fields. The logging operations only consume resources when actually rendered, and the conditional rendering system ensures that production code can run with logging disabled for maximum performance.
The library follows Pine Script best practices for performance, using appropriate data structures and avoiding unnecessary operations. The var keyword in init_static_log() ensures that persistent logs don't create new objects on every bar, maintaining efficiency even in real-time calculations.
Getting Started
Adopting Light Log in your Pine Script projects is straightforward. Import the library, wrap your critical values, add validation to your functions, and use Log objects to track important events. Start small by adding logging to a single function, then expand as you see the benefits of better error visibility and code organization.
Remember that Light Log is designed to grow with your needs. You can use as much or as little of its functionality as makes sense for your project. Even simple uses, like adding argument validation to key functions, can significantly improve code reliability and debugging ease.
Transform your Pine Script development experience with Light Log – because professional trading systems deserve professional development tools.
Light Log Technical Deep Dive: Advanced Patterns and Architecture
Understanding Errors as Values
The concept of "errors as values" represents a fundamental shift in how we think about error handling in Pine Script. In traditional Pine Script development, errors are events – they happen at a specific moment in time and immediately interrupt program flow. Light Log transforms errors into data – they become information that flows through your program just like any other value.
This transformation has profound implications. When errors are values, they can be stored, passed between functions, accumulated, transformed, and inspected. They become part of your program's data flow rather than exceptions to it. This approach, popularized by languages like Rust with its Result type and Haskell with its Either monad, brings functional programming's elegance to Pine Script.
Consider a practical example. Traditional Pine Script might calculate a momentum indicator like this:
momentum = close - close
If period is invalid or if there isn't enough historical data, this calculation might produce na or cause subtle bugs. With Light Log's approach:
calculate_momentum(src, period)=>
result = src.FLOAT()
if period <= 0
result.e.write("Invalid period: must be positive", true, ErrorType.error)
result.v := na
else if bar_index < period
result.e.write("Insufficient data: need " + str.tostring(period) + " bars", true, ErrorType.warning)
result.v := na
else
result.v := src - src
result.e.write("Momentum calculated successfully", false, ErrorType.info)
result
Now the function returns not just a value but a complete computational result that includes diagnostic information. Calling code can make intelligent decisions based on both the value and its associated metadata.
The Monad Pattern in Pine Script
While Pine Script lacks the type system features to implement true monads, Light Log brings monadic thinking to Pine Script development. The wrapped types (INT, FLOAT, etc.) act as computational contexts that carry both values and metadata through a series of transformations.
The key insight of monadic programming is that you can chain operations while automatically propagating context. In Light Log, this context is the error state. When you have a FLOAT that contains an error, operations on that FLOAT can check the error state and decide whether to proceed or propagate the error.
This pattern enables what functional programmers call "railway-oriented programming" – your code follows a success track when all is well but can switch to an error track when problems occur. Both tracks lead to the same destination (a result with error information), but they take different paths based on the validity of intermediate values.
Composable Error Handling
Light Log's design encourages composition – building complex functionality from simpler, well-tested components. Each component can validate its inputs, perform its calculation, and return a result with appropriate error information. Higher-level functions can then combine these results intelligently.
Consider building a complex trading signal from multiple indicators:
generate_signal(src, fast_period, slow_period, signal_period) =>
log = init_static_log(ErrorType.info)
// Calculate components with error tracking
fast_ma = calculate_ma(src, fast_period)
slow_ma = calculate_ma(src, slow_period)
// Check for errors in components
if fast_ma.has_error()
log.write_line("Fast MA error: " + fast_ma.e.message, true)
if slow_ma.has_error()
log.write_line("Slow MA error: " + slow_ma.e.message, true)
// Proceed with calculation if no errors
signal = 0.0.FLOAT()
if not (fast_ma.has_error() or slow_ma.has_error())
macd_line = fast_ma.v - slow_ma.v
signal_line = calculate_ma(macd_line, signal_period)
if signal_line.has_error()
log.write_line("Signal line error: " + signal_line.e.message, true)
signal.e := log
else
signal.v := macd_line - signal_line.v
log.write("Signal generated successfully")
else
signal.e := log
signal.v := na
signal
This composable approach makes complex calculations more reliable and easier to debug. Each component is responsible for its own validation and error reporting, and the composite function orchestrates these components while maintaining comprehensive error tracking.
The Static Log Pattern
The init_static_log() function introduces a powerful pattern for maintaining state across function calls. In Pine Script, the var keyword creates variables that persist across bars but are initialized only once. Light Log leverages this to create logging objects that can accumulate information throughout a script's execution.
This pattern is particularly valuable for debugging complex strategies where you need to understand behavior across multiple bars. You can create module-level logs that track important events:
// Module-level diagnostic log
diagnostics = init_static_log(ErrorType.info)
// Track strategy decisions across bars
check_entry_conditions() =>
diagnostics.clear() // Start fresh each bar
diagnostics.write_line("Bar " + str.tostring(bar_index) + " analysis:")
if close > sma(close, 20)
diagnostics.write_line("Price above SMA20", false)
else
diagnostics.write_line("Price below SMA20 - no entry", true, ErrorType.warning)
if volume > sma(volume, 20) * 1.5
diagnostics.write_line("Volume surge detected", false)
else
diagnostics.write_line("Normal volume", false)
// Render diagnostics based on verbosity setting
if debug_mode
diagnostics.render_now()
Advanced Validation Patterns
Light Log's argument validation functions enable sophisticated precondition checking that goes beyond simple null checks. You can implement complex validation logic while keeping your code readable:
validate_price_data(open_val, high_val, low_val, close_val) =>
argument_error(na(open_val) or na(high_val) or na(low_val) or na(close_val),
"validate_price_data", "OHLC values", "contain na values")
argument_error(high_val < low_val,
"validate_price_data", "high/low", "high is less than low")
argument_error(close_val > high_val or close_val < low_val,
"validate_price_data", "close", "is outside high/low range")
argument_log_warning(high_val == low_val,
"validate_price_data", "high/low", "are equal (no range)")
This validation function documents its requirements clearly and fails fast with helpful error messages when assumptions are violated. The mix of errors (which halt execution) and warnings (which allow continuation) provides fine-grained control over how strict your validation should be.
Performance Optimization Strategies
While Light Log adds abstraction, careful design minimizes overhead. Understanding Pine Script's execution model helps you use Light Log efficiently.
Pine Script executes once per bar, so operations that seem expensive in traditional programming might have negligible impact. However, when building real-time systems, every optimization matters. Light Log provides several patterns for efficient use:
Lazy Evaluation: Log messages are only built when they'll be rendered. Use conditional logging to avoid string concatenation in production:
if debug_mode
log.write_line("Calculated value: " + str.tostring(complex_calculation))
Selective Wrapping: Not every value needs error tracking. Wrap values at API boundaries and critical calculation points, but use raw values for simple operations:
// Wrap at boundaries
input_price = close.FLOAT()
validated_period = validate_period(input_period).INT()
// Use raw values internally
sum = 0.0
for i = 0 to validated_period.v - 1
sum += close
Error Propagation: When errors occur early, avoid expensive calculations:
process_data(input) =>
validated = validate_input(input)
if validated.has_error()
validated // Return early with error
else
// Expensive processing only if valid
perform_complex_calculation(validated)
Integration Patterns
Light Log integrates smoothly with existing Pine Script code. You can adopt it incrementally, starting with critical functions and expanding coverage as needed.
Boundary Validation: Add Light Log at the boundaries of your system – where user input enters and where final outputs are produced. This catches most errors while minimizing changes to existing code.
Progressive Enhancement: Start by adding argument validation to existing functions. Then wrap return values. Finally, add comprehensive logging. Each step improves reliability without requiring a complete rewrite.
Testing and Debugging: Use Light Log's conditional rendering to create debug modes for your scripts. Production users see clean output while developers get detailed diagnostics:
// User input for debug mode
debug = input.bool(false, "Enable debug logging")
// Conditional diagnostic output
if debug
diagnostics.render_now()
else
diagnostics.render_condition() // Only shows errors/warnings
Future-Proofing Your Code
Light Log's patterns prepare your code for Pine Script's evolution. As Pine Script adds more sophisticated features, code that uses structured error handling and defensive programming will adapt more easily than code that relies on implicit assumptions.
The type wrapper system, in particular, positions your code to take advantage of potential future features or more sophisticated type inference. By thinking in terms of wrapped values and error propagation today, you're building code that will remain maintainable and extensible tomorrow.
Light Log doesn't just make your Pine Script better today – it prepares it for the trading systems you'll need to build tomorrow.
Library "light_log"
A lightweight logging and defensive programming library for Pine Script.
Designed for modular and extensible scripts, this utility provides structured runtime validation,
conditional logging, and reusable `Log` objects for centralized error propagation.
It also introduces a typed wrapping system for all native Pine values (e.g., `INT`, `FLOAT`, `LABEL`),
allowing values to carry errors alongside data. This enables functional-style flows with built-in
validation tracking, error detection (`has_error()`), and fluent chaining.
Inspired by structured logging patterns found in systems like C#, it reduces boilerplate,
enforces argument safety, and encourages clean, maintainable code architecture.
method INT(self, error_type)
Wraps an `int` value into an `INT` struct with an optional log severity.
Namespace types: series int, simple int, input int, const int
Parameters:
self (int) : The raw `int` value to wrap.
error_type (series ErrorType) : Optional severity level to associate with the log. Default is `ErrorType.error`.
Returns: An `INT` object containing the value and a default Log instance.
method FLOAT(self, error_type)
Wraps a `float` value into a `FLOAT` struct with an optional log severity.
Namespace types: series float, simple float, input float, const float
Parameters:
self (float) : The raw `float` value to wrap.
error_type (series ErrorType) : Optional severity level to associate with the log. Default is `ErrorType.error`.
Returns: A `FLOAT` object containing the value and a default Log instance.
method BOOL(self, error_type)
Wraps a `bool` value into a `BOOL` struct with an optional log severity.
Namespace types: series bool, simple bool, input bool, const bool
Parameters:
self (bool) : The raw `bool` value to wrap.
error_type (series ErrorType) : Optional severity level to associate with the log. Default is `ErrorType.error`.
Returns: A `BOOL` object containing the value and a default Log instance.
method STRING(self, error_type)
Wraps a `string` value into a `STRING` struct with an optional log severity.
Namespace types: series string, simple string, input string, const string
Parameters:
self (string) : The raw `string` value to wrap.
error_type (series ErrorType) : Optional severity level to associate with the log. Default is `ErrorType.error`.
Returns: A `STRING` object containing the value and a default Log instance.
method COLOR(self, error_type)
Wraps a `color` value into a `COLOR` struct with an optional log severity.
Namespace types: series color, simple color, input color, const color
Parameters:
self (color) : The raw `color` value to wrap.
error_type (series ErrorType) : Optional severity level to associate with the log. Default is `ErrorType.error`.
Returns: A `COLOR` object containing the value and a default Log instance.
method LINE(self, error_type)
Wraps a `line` object into a `LINE` struct with an optional log severity.
Namespace types: series line
Parameters:
self (line) : The raw `line` object to wrap.
error_type (series ErrorType) : Optional severity level to associate with the log. Default is `ErrorType.error`.
Returns: A `LINE` object containing the value and a default Log instance.
method LABEL(self, error_type)
Wraps a `label` object into a `LABEL` struct with an optional log severity.
Namespace types: series label
Parameters:
self (label) : The raw `label` object to wrap.
error_type (series ErrorType) : Optional severity level to associate with the log. Default is `ErrorType.error`.
Returns: A `LABEL` object containing the value and a default Log instance.
method BOX(self, error_type)
Wraps a `box` object into a `BOX` struct with an optional log severity.
Namespace types: series box
Parameters:
self (box) : The raw `box` object to wrap.
error_type (series ErrorType) : Optional severity level to associate with the log. Default is `ErrorType.error`.
Returns: A `BOX` object containing the value and a default Log instance.
method TABLE(self, error_type)
Wraps a `table` object into a `TABLE` struct with an optional log severity.
Namespace types: series table
Parameters:
self (table) : The raw `table` object to wrap.
error_type (series ErrorType) : Optional severity level to associate with the log. Default is `ErrorType.error`.
Returns: A `TABLE` object containing the value and a default Log instance.
method CHART_POINT(self, error_type)
Wraps a `chart.point` value into a `CHART_POINT` struct with an optional log severity.
Namespace types: chart.point
Parameters:
self (chart.point) : The raw `chart.point` value to wrap.
error_type (series ErrorType) : Optional severity level to associate with the log. Default is `ErrorType.error`.
Returns: A `CHART_POINT` object containing the value and a default Log instance.
method POLYLINE(self, error_type)
Wraps a `polyline` object into a `POLYLINE` struct with an optional log severity.
Namespace types: series polyline, series polyline, series polyline, series polyline
Parameters:
self (polyline) : The raw `polyline` object to wrap.
error_type (series ErrorType) : Optional severity level to associate with the log. Default is `ErrorType.error`.
Returns: A `POLYLINE` object containing the value and a default Log instance.
method LINEFILL(self, error_type)
Wraps a `linefill` object into a `LINEFILL` struct with an optional log severity.
Namespace types: series linefill
Parameters:
self (linefill) : The raw `linefill` object to wrap.
error_type (series ErrorType) : Optional severity level to associate with the log. Default is `ErrorType.error`.
Returns: A `LINEFILL` object containing the value and a default Log instance.
method from_INT(self)
Extracts the integer value from an INT wrapper.
Namespace types: INT
Parameters:
self (INT) : The wrapped INT instance.
Returns: The underlying `int` value.
method from_FLOAT(self)
Extracts the float value from a FLOAT wrapper.
Namespace types: FLOAT
Parameters:
self (FLOAT) : The wrapped FLOAT instance.
Returns: The underlying `float` value.
method from_BOOL(self)
Extracts the boolean value from a BOOL wrapper.
Namespace types: BOOL
Parameters:
self (BOOL) : The wrapped BOOL instance.
Returns: The underlying `bool` value.
method from_STRING(self)
Extracts the string value from a STRING wrapper.
Namespace types: STRING
Parameters:
self (STRING) : The wrapped STRING instance.
Returns: The underlying `string` value.
method from_COLOR(self)
Extracts the color value from a COLOR wrapper.
Namespace types: COLOR
Parameters:
self (COLOR) : The wrapped COLOR instance.
Returns: The underlying `color` value.
method from_LINE(self)
Extracts the line object from a LINE wrapper.
Namespace types: LINE
Parameters:
self (LINE) : The wrapped LINE instance.
Returns: The underlying `line` object.
method from_LABEL(self)
Extracts the label object from a LABEL wrapper.
Namespace types: LABEL
Parameters:
self (LABEL) : The wrapped LABEL instance.
Returns: The underlying `label` object.
method from_BOX(self)
Extracts the box object from a BOX wrapper.
Namespace types: BOX
Parameters:
self (BOX) : The wrapped BOX instance.
Returns: The underlying `box` object.
method from_TABLE(self)
Extracts the table object from a TABLE wrapper.
Namespace types: TABLE
Parameters:
self (TABLE) : The wrapped TABLE instance.
Returns: The underlying `table` object.
method from_CHART_POINT(self)
Extracts the chart.point from a CHART_POINT wrapper.
Namespace types: CHART_POINT
Parameters:
self (CHART_POINT) : The wrapped CHART_POINT instance.
Returns: The underlying `chart.point` value.
method from_POLYLINE(self)
Extracts the polyline object from a POLYLINE wrapper.
Namespace types: POLYLINE
Parameters:
self (POLYLINE) : The wrapped POLYLINE instance.
Returns: The underlying `polyline` object.
method from_LINEFILL(self)
Extracts the linefill object from a LINEFILL wrapper.
Namespace types: LINEFILL
Parameters:
self (LINEFILL) : The wrapped LINEFILL instance.
Returns: The underlying `linefill` object.
method has_error(self)
Returns true if the INT wrapper has an active log entry.
Namespace types: INT
Parameters:
self (INT) : The INT instance to check.
Returns: True if an error or message is active in the log.
method has_error(self)
Returns true if the FLOAT wrapper has an active log entry.
Namespace types: FLOAT
Parameters:
self (FLOAT) : The FLOAT instance to check.
Returns: True if an error or message is active in the log.
method has_error(self)
Returns true if the BOOL wrapper has an active log entry.
Namespace types: BOOL
Parameters:
self (BOOL) : The BOOL instance to check.
Returns: True if an error or message is active in the log.
method has_error(self)
Returns true if the STRING wrapper has an active log entry.
Namespace types: STRING
Parameters:
self (STRING) : The STRING instance to check.
Returns: True if an error or message is active in the log.
method has_error(self)
Returns true if the COLOR wrapper has an active log entry.
Namespace types: COLOR
Parameters:
self (COLOR) : The COLOR instance to check.
Returns: True if an error or message is active in the log.
method has_error(self)
Returns true if the LINE wrapper has an active log entry.
Namespace types: LINE
Parameters:
self (LINE) : The LINE instance to check.
Returns: True if an error or message is active in the log.
method has_error(self)
Returns true if the LABEL wrapper has an active log entry.
Namespace types: LABEL
Parameters:
self (LABEL) : The LABEL instance to check.
Returns: True if an error or message is active in the log.
method has_error(self)
Returns true if the BOX wrapper has an active log entry.
Namespace types: BOX
Parameters:
self (BOX) : The BOX instance to check.
Returns: True if an error or message is active in the log.
method has_error(self)
Returns true if the TABLE wrapper has an active log entry.
Namespace types: TABLE
Parameters:
self (TABLE) : The TABLE instance to check.
Returns: True if an error or message is active in the log.
method has_error(self)
Returns true if the CHART_POINT wrapper has an active log entry.
Namespace types: CHART_POINT
Parameters:
self (CHART_POINT) : The CHART_POINT instance to check.
Returns: True if an error or message is active in the log.
method has_error(self)
Returns true if the POLYLINE wrapper has an active log entry.
Namespace types: POLYLINE
Parameters:
self (POLYLINE) : The POLYLINE instance to check.
Returns: True if an error or message is active in the log.
method has_error(self)
Returns true if the LINEFILL wrapper has an active log entry.
Namespace types: LINEFILL
Parameters:
self (LINEFILL) : The LINEFILL instance to check.
Returns: True if an error or message is active in the log.
void_return()
Utility function used when a return is syntactically required but functionally unnecessary.
Returns: Nothing. Function never executes its body.
argument_error(condition, function, argument, message)
Throws a runtime error when a condition is met. Used for strict argument validation.
Parameters:
condition (bool) : Boolean expression that triggers the runtime error.
function (string) : Name of the calling function (for formatting).
argument (string) : Name of the problematic argument.
message (string) : Description of the error cause.
Returns: Never returns. Halts execution if the condition is true.
argument_log_info(condition, function, argument, message)
Logs an informational message when a condition is met. Used for optional debug visibility.
Parameters:
condition (bool) : Boolean expression that triggers the log.
function (string) : Name of the calling function.
argument (string) : Argument name being referenced.
message (string) : Informational message to log.
Returns: Nothing. Logs if the condition is true.
argument_log_warning(condition, function, argument, message)
Logs a warning when a condition is met. Non-fatal but highlights potential issues.
Parameters:
condition (bool) : Boolean expression that triggers the warning.
function (string) : Name of the calling function.
argument (string) : Argument name being referenced.
message (string) : Warning message to log.
Returns: Nothing. Logs if the condition is true.
argument_log_error(condition, function, argument, message)
Logs an error message when a condition is met. Does not halt execution.
Parameters:
condition (bool) : Boolean expression that triggers the error log.
function (string) : Name of the calling function.
argument (string) : Argument name being referenced.
message (string) : Error message to log.
Returns: Nothing. Logs if the condition is true.
init_static_log(error_type, message, active)
Initializes a persistent (var) Log object. Ideal for global logging in scripts or modules.
Parameters:
error_type (series ErrorType) : Initial severity level (required).
message (string) : Optional starting message string. Default value of ("").
active (bool) : Whether the log should be flagged active on initialization. Default value of (false).
Returns: A static Log object with the given parameters.
method new_line(self)
Appends a newline character to the Log message. Useful for separating entries during chained writes.
Namespace types: Log
Parameters:
self (Log) : The Log instance to modify.
Returns: The updated Log object with a newline appended.
method write(self, message, flag_active, error_type)
Appends a message to a Log object without a newline. Updates severity and active state if specified.
Namespace types: Log
Parameters:
self (Log) : The Log instance being modified.
message (string) : The text to append to the log.
flag_active (bool) : Whether to activate the log for conditional rendering. Default value of (false).
error_type (series ErrorType) : Optional override for the severity level. Default value of (na).
Returns: The updated Log object.
method write_line(self, message, flag_active, error_type)
Appends a message to a Log object, prefixed with a newline for clarity.
Namespace types: Log
Parameters:
self (Log) : The Log instance being modified.
message (string) : The text to append to the log.
flag_active (bool) : Whether to activate the log for conditional rendering. Default value of (false).
error_type (series ErrorType) : Optional override for the severity level. Default value of (na).
Returns: The updated Log object.
method clear(self, flag_active, error_type)
Clears a Log object’s message and optionally reactivates it. Can also update the error type.
Namespace types: Log
Parameters:
self (Log) : The Log instance being cleared.
flag_active (bool) : Whether to activate the log after clearing. Default value of (false).
error_type (series ErrorType) : Optional new error type to assign. If not provided, the previous type is retained. Default value of (na).
Returns: The cleared Log object.
method render_condition(self, flag_active, error_type)
Conditionally renders the log if it is active. Allows overriding error type and controlling active state afterward.
Namespace types: Log
Parameters:
self (Log) : The Log instance to evaluate and render.
flag_active (bool) : Whether to activate the log after rendering. Default value of (false).
error_type (series ErrorType) : Optional error type override. Useful for contextual formatting just before rendering. Default value of (na).
Returns: The updated Log object.
method render_now(self, flag_active, error_type)
Immediately renders the log regardless of `active` state. Allows overriding error type and active flag.
Namespace types: Log
Parameters:
self (Log) : The Log instance to render.
flag_active (bool) : Whether to activate the log after rendering. Default value of (false).
error_type (series ErrorType) : Optional error type override. Allows dynamic severity adjustment at render time. Default value of (na).
Returns: The updated Log object.
render(self, condition, flag_active, error_type)
Renders the log conditionally or unconditionally. Allows full control over render behavior.
Parameters:
self (Log) : The Log instance to render.
condition (bool) : If true, renders only if the log is active. If false, always renders. Default value of (false).
flag_active (bool) : Whether to activate the log after rendering. Default value of (false).
error_type (series ErrorType) : Optional error type override passed to the render methods. Default value of (na).
Returns: The updated Log object.
Log
A structured object used to store and render logging messages.
Fields:
error_type (series ErrorType) : The severity level of the message (from the ErrorType enum).
message (series string) : The text of the log message.
active (series bool) : Whether the log should trigger rendering when conditionally evaluated.
INT
A wrapped integer type with attached logging for validation or tracing.
Fields:
v (series int) : The underlying `int` value.
e (Log) : Optional log object describing validation status or error context.
FLOAT
A wrapped float type with attached logging for validation or tracing.
Fields:
v (series float) : The underlying `float` value.
e (Log) : Optional log object describing validation status or error context.
BOOL
A wrapped boolean type with attached logging for validation or tracing.
Fields:
v (series bool) : The underlying `bool` value.
e (Log) : Optional log object describing validation status or error context.
STRING
A wrapped string type with attached logging for validation or tracing.
Fields:
v (series string) : The underlying `string` value.
e (Log) : Optional log object describing validation status or error context.
COLOR
A wrapped color type with attached logging for validation or tracing.
Fields:
v (series color) : The underlying `color` value.
e (Log) : Optional log object describing validation status or error context.
LINE
A wrapped line object with attached logging for validation or tracing.
Fields:
v (series line) : The underlying `line` value.
e (Log) : Optional log object describing validation status or error context.
LABEL
A wrapped label object with attached logging for validation or tracing.
Fields:
v (series label) : The underlying `label` value.
e (Log) : Optional log object describing validation status or error context.
BOX
A wrapped box object with attached logging for validation or tracing.
Fields:
v (series box) : The underlying `box` value.
e (Log) : Optional log object describing validation status or error context.
TABLE
A wrapped table object with attached logging for validation or tracing.
Fields:
v (series table) : The underlying `table` value.
e (Log) : Optional log object describing validation status or error context.
CHART_POINT
A wrapped chart point with attached logging for validation or tracing.
Fields:
v (chart.point) : The underlying `chart.point` value.
e (Log) : Optional log object describing validation status or error context.
POLYLINE
A wrapped polyline object with attached logging for validation or tracing.
Fields:
v (series polyline) : The underlying `polyline` value.
e (Log) : Optional log object describing validation status or error context.
LINEFILL
A wrapped linefill object with attached logging for validation or tracing.
Fields:
v (series linefill) : The underlying `linefill` value.
e (Log) : Optional log object describing validation status or error context.

StatMetricsLibrary "StatMetrics"
A utility library for common statistical indicators and ratios used in technical analysis.
Includes Z-Score, correlation, PLF, SRI, Sharpe, Sortino, Omega ratios, and normalization tools.
zscore(src, len)
Calculates the Z-score of a series
Parameters:
src (float) : The input price or series (e.g., close)
len (simple int) : The lookback period for mean and standard deviation
Returns: Z-score: number of standard deviations the input is from the mean
corr(x, y, len)
Computes Pearson correlation coefficient between two series
Parameters:
x (float) : First series
y (float) : Second series
len (simple int) : Lookback period
Returns: Correlation coefficient between -1 and 1
plf(src, longLen, shortLen, smoothLen)
Calculates the Price Lag Factor (PLF) as the difference between long and short Z-scores, normalized and smoothed
Parameters:
src (float) : Source series (e.g., close)
longLen (simple int) : Long Z-score period
shortLen (simple int) : Short Z-score period
smoothLen (simple int) : Hull MA smoothing length
Returns: Smoothed and normalized PLF oscillator
sri(signal, len)
Computes the Statistical Reliability Index (SRI) based on trend persistence
Parameters:
signal (float) : A price or signal series (e.g., smoothed PLF)
len (simple int) : Lookback period for smoothing and deviation
Returns: Normalized trend reliability score
sharpe(src, len)
Calculates the Sharpe Ratio over a period
Parameters:
src (float) : Price series (e.g., close)
len (simple int) : Lookback period
Returns: Sharpe ratio value
sortino(src, len)
Calculates the Sortino Ratio over a period, using only downside volatility
Parameters:
src (float) : Price series
len (simple int) : Lookback period
Returns: Sortino ratio value
omega(src, len)
Calculates the Omega Ratio as the ratio of upside to downside return area
Parameters:
src (float) : Price series
len (simple int) : Lookback period
Returns: Omega ratio value
beta(asset, benchmark, len)
Calculates beta coefficient of asset vs benchmark using rolling covariance
Parameters:
asset (float) : Series of the asset (e.g., close)
benchmark (float) : Series of the benchmark (e.g., SPX close)
len (simple int) : Lookback window
Returns: Beta value (slope of linear regression)
alpha(asset, benchmark, len)
Calculates rolling alpha of an asset relative to a benchmark
Parameters:
asset (float) : Series of the asset (e.g., close)
benchmark (float) : Series of the benchmark (e.g., SPX close)
len (simple int) : Lookback window
Returns: Alpha value (excess return not explained by Beta exposure)
skew(x, len)
Computes skewness of a return series
Parameters:
x (float) : Input series (e.g., returns)
len (simple int) : Lookback period
Returns: Skewness value
kurtosis(x, len)
Computes kurtosis of a return series
Parameters:
x (float) : Input series (e.g., returns)
len (simple int) : Lookback period
Returns: Kurtosis value
cv(x, len)
Calculates Coefficient of Variation
Parameters:
x (float) : Input series (e.g., returns or prices)
len (simple int) : Lookback period
Returns: CV value
autocorr(x, len)
Calculates autocorrelation with 1-lag
Parameters:
x (float) : Series to test
len (simple int) : Lookback window
Returns: Autocorrelation at lag 1
stderr(x, len)
Calculates rolling standard error of a series
Parameters:
x (float) : Input series
len (simple int) : Lookback window
Returns: Standard error (std dev / sqrt(n))
info_ratio(asset, benchmark, len)
Calculates the Information Ratio
Parameters:
asset (float) : Asset price series
benchmark (float) : Benchmark price series
len (simple int) : Lookback period
Returns: Information ratio (alpha / tracking error)
tracking_error(asset, benchmark, len)
Measures deviation from benchmark (Tracking Error)
Parameters:
asset (float) : Asset return series
benchmark (float) : Benchmark return series
len (simple int) : Lookback window
Returns: Tracking error value
max_drawdown(x, len)
Computes maximum drawdown over a rolling window
Parameters:
x (float) : Price series
len (simple int) : Lookback window
Returns: Rolling max drawdown percentage (as a negative value)
zscore_signal(z, ob, os)
Converts Z-score into a 3-level signal
Parameters:
z (float) : Z-score series
ob (float) : Overbought threshold
os (float) : Oversold threshold
Returns: -1, 0, or 1 depending on signal state
r_squared(x, y, len)
Calculates rolling R-squared (coefficient of determination)
Parameters:
x (float) : Asset returns
y (float) : Benchmark returns
len (simple int) : Lookback window
Returns: R-squared value (0 to 1)
entropy(x, len)
Approximates Shannon entropy using log returns
Parameters:
x (float) : Price series
len (simple int) : Lookback period
Returns: Approximate entropy
zreversal(z)
Detects Z-score reversals to the mean
Parameters:
z (float) : Z-score series
Returns: +1 on upward reversal, -1 on downward
momentum_rank(x, len)
Calculates relative momentum strength
Parameters:
x (float) : Price series
len (simple int) : Lookback window
Returns: Proportion of lookback where current price is higher
normalize(x, len)
Normalizes a series to a 0–1 range over a period
Parameters:
x (float) : The input series
len (simple int) : Lookback period
Returns: Normalized value between 0 and 1
composite_score(score1, score2, score3)
Combines multiple normalized scores into a composite score
Parameters:
score1 (float)
score2 (float)
score3 (float)
Returns: Average composite score

TradersPostDeluxeLibrary "TradersPostDeluxe"
TradersPost integration. It's currently not very deluxe
SendEntryAlert(ticker, action, quantity, orderType, takeProfit, stopLoss, id, price, timestamp, timezone)
Sends an alert to TradersPost to trigger an Entry
Parameters:
ticker (string) : Symbol to trade. Default is syminfo.ticker
action (series Action) : TradersPostAction (.buy, .sell) default = buy
quantity (float) : Amount to trade, default = 1
orderType (series OrderType) : TradersPostOrderType, default =e TradersPostOrderType.market
takeProfit (float) : Take profit limit price
stopLoss (float) : Stop loss price
id (string) : id for the trade
price (float) : Expected price
timestamp (int) : Time of the trade for reporting, defaults to timenow
timezone (string) : associated with the time, defaults to syminfo.timezone
Returns: Nothing
SendExitAlert(ticker, price, timestamp, timezone)
Sends an alert to TradersPost to trigger an Exit
Parameters:
ticker (string) : Symbol to flatten
price (float) : Documented planned price
timestamp (int) : Time of the trade for reporting, defaults to timenow
timezone (string) : associated with the time, defaults to syminfo.timezone
Returns: Nothing

CGMALibrary "CGMA"
This library provides a function to calculate a moving average based on Chebyshev-Gauss Quadrature. This method samples price data more intensely from the beginning and end of the lookback window, giving it a unique character that responds quickly to recent changes while also having a long "memory" of the trend's start. Inspired by reading rohangautam.github.io
What is Chebyshev-Gauss Quadrature?
It's a numerical method to approximate the integral of a function f(x) that is weighted by 1/sqrt(1-x^2) over the interval . The approximation is a simple sum: ∫ f(x)/sqrt(1-x^2) dx ≈ (π/n) * Σ f(xᵢ) where xᵢ are special points called Chebyshev nodes.
How is this applied to a Moving Average?
A moving average can be seen as the "mean value" of the price over a lookback window. The mean value of a function with the Chebyshev weight is calculated as:
Mean = /
The math simplifies beautifully, resulting in the mean being the simple arithmetic average of the function evaluated at the Chebyshev nodes:
Mean = (1/n) * Σ f(xᵢ)
What's unique about this MA?
The Chebyshev nodes xᵢ are not evenly spaced. They are clustered towards the ends of the interval . We map this interval to our lookback period. This means the moving average samples prices more intensely from the beginning and the end of the lookback window, and less intensely from the middle. This gives it a unique character, responding quickly to recent changes while also having a long "memory" of the start of the trend.

CCO_LibraryLibrary "CCO_Library"
Contrarian Crowd Oscillator (CCO) Library - Multi-oscillator consensus indicator for contrarian trading signals
@author B3AR_Trades
calculate_oscillators(rsi_length, stoch_length, cci_length, williams_length, roc_length, mfi_length, percentile_lookback, use_rsi, use_stochastic, use_williams, use_cci, use_roc, use_mfi)
Calculate normalized oscillator values
Parameters:
rsi_length (simple int) : (int) RSI calculation period
stoch_length (int) : (int) Stochastic calculation period
cci_length (int) : (int) CCI calculation period
williams_length (int) : (int) Williams %R calculation period
roc_length (int) : (int) ROC calculation period
mfi_length (int) : (int) MFI calculation period
percentile_lookback (int) : (int) Lookback period for CCI/ROC percentile ranking
use_rsi (bool) : (bool) Include RSI in calculations
use_stochastic (bool) : (bool) Include Stochastic in calculations
use_williams (bool) : (bool) Include Williams %R in calculations
use_cci (bool) : (bool) Include CCI in calculations
use_roc (bool) : (bool) Include ROC in calculations
use_mfi (bool) : (bool) Include MFI in calculations
Returns: (OscillatorValues) Normalized oscillator values
calculate_consensus_score(oscillators, use_rsi, use_stochastic, use_williams, use_cci, use_roc, use_mfi, weight_by_reliability, consensus_smoothing)
Calculate weighted consensus score
Parameters:
oscillators (OscillatorValues) : (OscillatorValues) Individual oscillator values
use_rsi (bool) : (bool) Include RSI in consensus
use_stochastic (bool) : (bool) Include Stochastic in consensus
use_williams (bool) : (bool) Include Williams %R in consensus
use_cci (bool) : (bool) Include CCI in consensus
use_roc (bool) : (bool) Include ROC in consensus
use_mfi (bool) : (bool) Include MFI in consensus
weight_by_reliability (bool) : (bool) Apply reliability-based weights
consensus_smoothing (int) : (int) Smoothing period for consensus
Returns: (float) Weighted consensus score (0-100)
calculate_consensus_strength(oscillators, consensus_score, use_rsi, use_stochastic, use_williams, use_cci, use_roc, use_mfi)
Calculate consensus strength (agreement between oscillators)
Parameters:
oscillators (OscillatorValues) : (OscillatorValues) Individual oscillator values
consensus_score (float) : (float) Current consensus score
use_rsi (bool) : (bool) Include RSI in strength calculation
use_stochastic (bool) : (bool) Include Stochastic in strength calculation
use_williams (bool) : (bool) Include Williams %R in strength calculation
use_cci (bool) : (bool) Include CCI in strength calculation
use_roc (bool) : (bool) Include ROC in strength calculation
use_mfi (bool) : (bool) Include MFI in strength calculation
Returns: (float) Consensus strength (0-100)
classify_regime(consensus_score)
Classify consensus regime
Parameters:
consensus_score (float) : (float) Current consensus score
Returns: (ConsensusRegime) Regime classification
detect_signals(consensus_score, consensus_strength, consensus_momentum, regime)
Detect trading signals
Parameters:
consensus_score (float) : (float) Current consensus score
consensus_strength (float) : (float) Current consensus strength
consensus_momentum (float) : (float) Consensus momentum
regime (ConsensusRegime) : (ConsensusRegime) Current regime classification
Returns: (TradingSignals) Trading signal conditions
calculate_cco(rsi_length, stoch_length, cci_length, williams_length, roc_length, mfi_length, consensus_smoothing, percentile_lookback, use_rsi, use_stochastic, use_williams, use_cci, use_roc, use_mfi, weight_by_reliability, detect_momentum)
Calculate complete CCO analysis
Parameters:
rsi_length (simple int) : (int) RSI calculation period
stoch_length (int) : (int) Stochastic calculation period
cci_length (int) : (int) CCI calculation period
williams_length (int) : (int) Williams %R calculation period
roc_length (int) : (int) ROC calculation period
mfi_length (int) : (int) MFI calculation period
consensus_smoothing (int) : (int) Consensus smoothing period
percentile_lookback (int) : (int) Percentile ranking lookback
use_rsi (bool) : (bool) Include RSI
use_stochastic (bool) : (bool) Include Stochastic
use_williams (bool) : (bool) Include Williams %R
use_cci (bool) : (bool) Include CCI
use_roc (bool) : (bool) Include ROC
use_mfi (bool) : (bool) Include MFI
weight_by_reliability (bool) : (bool) Apply reliability weights
detect_momentum (bool) : (bool) Calculate momentum and acceleration
Returns: (CCOResult) Complete CCO analysis results
calculate_cco_default()
Calculate CCO with default parameters
Returns: (CCOResult) CCO result with standard settings
cco_consensus_score()
Get just the consensus score with default parameters
Returns: (float) Consensus score (0-100)
cco_consensus_strength()
Get just the consensus strength with default parameters
Returns: (float) Consensus strength (0-100)
is_panic_bottom()
Check if in panic bottom condition
Returns: (bool) True if panic bottom signal active
is_euphoric_top()
Check if in euphoric top condition
Returns: (bool) True if euphoric top signal active
bullish_consensus_reversal()
Check for bullish consensus reversal
Returns: (bool) True if bullish reversal detected
bearish_consensus_reversal()
Check for bearish consensus reversal
Returns: (bool) True if bearish reversal detected
bearish_divergence()
Check for bearish divergence
Returns: (bool) True if bearish divergence detected
bullish_divergence()
Check for bullish divergence
Returns: (bool) True if bullish divergence detected
get_regime_name()
Get current regime name
Returns: (string) Current consensus regime name
get_contrarian_signal()
Get contrarian signal
Returns: (string) Current contrarian trading signal
get_position_multiplier()
Get position size multiplier
Returns: (float) Recommended position sizing multiplier
OscillatorValues
Individual oscillator values
Fields:
rsi (series float) : RSI value (0-100)
stochastic (series float) : Stochastic value (0-100)
williams (series float) : Williams %R value (0-100, normalized)
cci (series float) : CCI percentile value (0-100)
roc (series float) : ROC percentile value (0-100)
mfi (series float) : Money Flow Index value (0-100)
ConsensusRegime
Consensus regime classification
Fields:
extreme_bearish (series bool) : Extreme bearish consensus (<= 20)
moderate_bearish (series bool) : Moderate bearish consensus (20-40)
mixed (series bool) : Mixed consensus (40-60)
moderate_bullish (series bool) : Moderate bullish consensus (60-80)
extreme_bullish (series bool) : Extreme bullish consensus (>= 80)
regime_name (series string) : Text description of current regime
contrarian_signal (series string) : Contrarian trading signal
TradingSignals
Trading signals
Fields:
panic_bottom_signal (series bool) : Extreme bearish consensus with high strength
euphoric_top_signal (series bool) : Extreme bullish consensus with high strength
consensus_reversal_bullish (series bool) : Bullish consensus reversal
consensus_reversal_bearish (series bool) : Bearish consensus reversal
bearish_divergence (series bool) : Bearish price-consensus divergence
bullish_divergence (series bool) : Bullish price-consensus divergence
strong_consensus (series bool) : High consensus strength signal
CCOResult
Complete CCO calculation results
Fields:
consensus_score (series float) : Main consensus score (0-100)
consensus_strength (series float) : Consensus strength (0-100)
consensus_momentum (series float) : Rate of consensus change
consensus_acceleration (series float) : Rate of momentum change
oscillators (OscillatorValues) : Individual oscillator values
regime (ConsensusRegime) : Regime classification
signals (TradingSignals) : Trading signals
position_multiplier (series float) : Recommended position sizing multiplier
