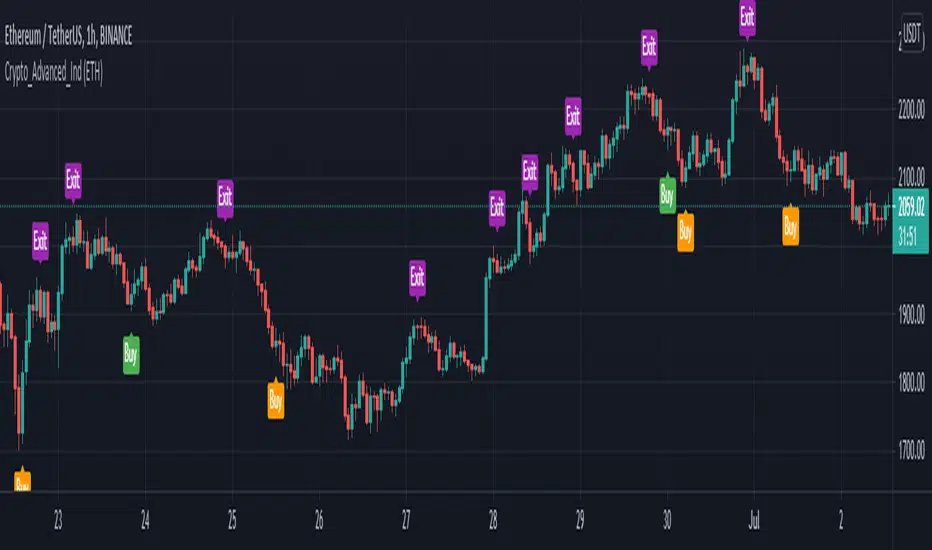
Crypto Advanced Trading IndicatorThe Crypto Indicator gives you a true picture of the market entry points, after a scan it does every period (after every candlestick closes) . It is pretty straightforward in its use with clear visual representation of the entry and exit points provided by the indicator.
This allows you to make improved entry and exit points and accommodates many trading styles, systems, and strategies.
It will work along most TradingView indicators and the timeframes we recommend you using it in are the 1H and sometimes the 4H chart.
The specific components of the indicator are:
Methodology:
The indicator uses a MACD oscillator to determine the local trend direction and to give buy & exit signals when its conditions are met.
An optional TradingView indicator, exponential moving average cross (EMA cross), can be used to filter out 'false' signals.
The calculation of the entry points are drawn from specific different prices for every one of the coins hardcoded in the script, and the filter function in the indicator settings, allows the user to change those prices based on the coin he is currently watching, based on the specific coin it is chosen in the filter.
Persistent variables are used for buy and exit prices, enabling color-coding of the signals (profitable or not).
Features:
Color coded labels - Buy, Exit = purple
Two types of entries - Bull Buy = green, Bear Buy = orange
Coin filter
Buy signal alerts
Remarks:
In our experience and therefore recommendation, the values used for each crypto coin work best on the 1-Hour timeframe. We encourage everyone to experiment, but the best results we had, were on this specific timeframe or higher.
Using the indicator on non-standard charts (Heikin Ashi, Renko etc.) can produce unrealistic results.
- Thanks to John Aslanis and Alexandros Temelkou the idealists and creators of this indicator.
Use the link below to watch a tutorial video, request a trial, or purchase for access:
Alerts
SuperTrend - Custom Screener and Dynamic AlertsTrading View today published a desktop Bad Internet connection indicator ?! which set me thinking…
Despite recently introduced Dynamic Alerts many scripts do not leverage the information available for active traders and traders on the GO!
So decided to share this script totally ALERT focused on one of the most popular DAY trading indicators.
Of course no more BAD internet problem as long your TV APP is configured , you will have enough data for a mental picture of the chart..
The Alerts give you the BAR Close , %percent gain or loss over previous day CLOSE ++ Previous Day High and Low to effectively plan your trade without a chart!(just in case)
2 additions in the way Alerts are delivered over the last script :
1. You get SUMMARY alerts or concatenated alerts by default , however if you uncomment or activate code lines 48 and 55 you will get individual Stock alerts Too!
2. Summary Alerts will come only if there is some Buy or Sell signal NO more empty Alerts!
Few useful EXTRAS in the code :
1. Flexible code can convert any indicator to screener or Alert function.
2. You will NOT get Mutable Variable error while converting any indicator to screener as long as the function is in "GLOBAL" scope..
3. Many Custom Screeners are available but few give OHLC data in output so easily…and very difficult for traders to MODIFY hundreds of lines of code..
4. For UP or DOWN on SCREEN Stock monitoring copy /paste functions in line 41 and 42 in lieu of CROSS functions in 44 and 51 respectively..
5. You can also uncomment/activate lines 66 and 67 for labels in monitoring.
6. The default mode of the scripts is set to Alerts!
Max Stocks only 20!
Finally idea is to help traders to use the great features that TV works so hard to create and constantly improvise.
Enjoy Profitable Trading on the Fly !!

Smart EMA SignalsThis indicator starts by plotting each time the price action crosses above or below the EMA, of which you can tune the timeframe and duration.
It then takes it a step further and plots whether or not that indicator would have given you a profitable trade, of which you can also tune the parameters (Max wait time, and % Profit).
Once you have your EMA tuned to your liking, set up alerts to notify you of a golden opportunity.

Fibonacci and Ema Trend + Pullback alerts This indicator tells you what to do with supports and resistances based on fibonacci with signs and alarms
and Ema 200 with buy or sell fast pullback alarms
When 0.5 is bear the price will seek to break the lower supports
sell from 0.5 to bear zone and obtain profits below the supports
stop loss above resistence
When 0.5 is bull the price will seek to break the highest resistances
buy from 0.5 to bull zone and profit above the resistances
stop loss below support
you can edit the indicator to have slower or faster levels if you want
The alarms that the indicator has :
Resistence down
Resistence up
Bull zone UP
Buy 0.5 Bull
Sell 0.5 Bear
Bear zone DOWN
Bear zone UP sell to 5.0 bear
Bull zone DOWN Buy to 0.5 bull
Support zone DOWN
Support zone UP
ema 200 pullback alerts
when price is going up active the buy fast pullback alarm
stop loss below ema 200 or support
when price is going Down active the sell fast pullback alarm
stop loss above ema 200 or resistence

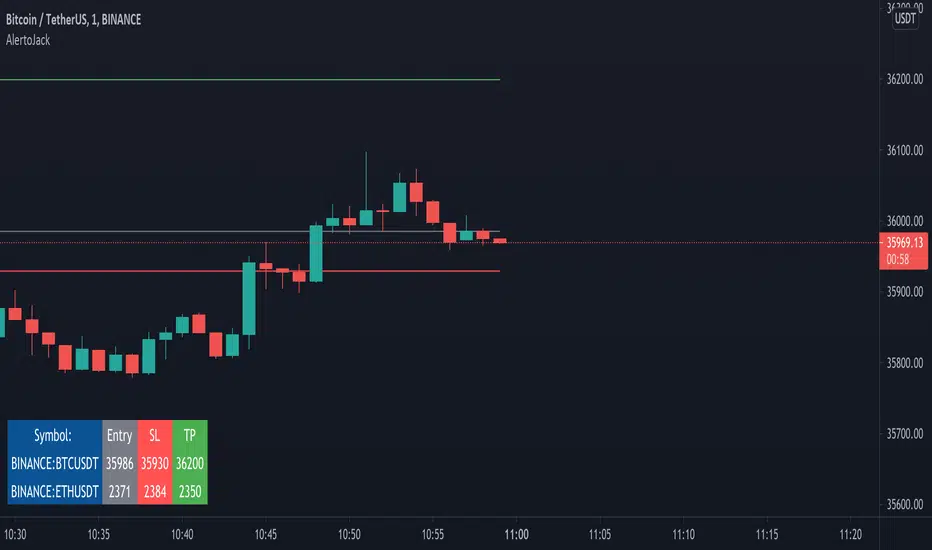
AlertoJack AlertoJack
v0.1a
coded by Bogdan Vaida
This indicator was created to provide easily defined alerts on multiple symbols.
It's still POC code.
Usage:
- Add it on any coin,
- The chart timeframe will be the timeframe for the alerts;
- Configure it with the symbols you want to be alerted on,
- Add the prices to be alerted for,
- Use Add Alert -> condition AlertoJack -> "Any alert() function call"
- Check the Alerts log.
Notes:
- Alert happens when candle crosses the price.
- Because of how Trading View functions, if you modify the indicator settings
you'll need to add the alerts again (because an alert uses the code version
it was created from).
- The alert runs once per current bar's timeframe (e.g. once per minute
if you're on the 1m).
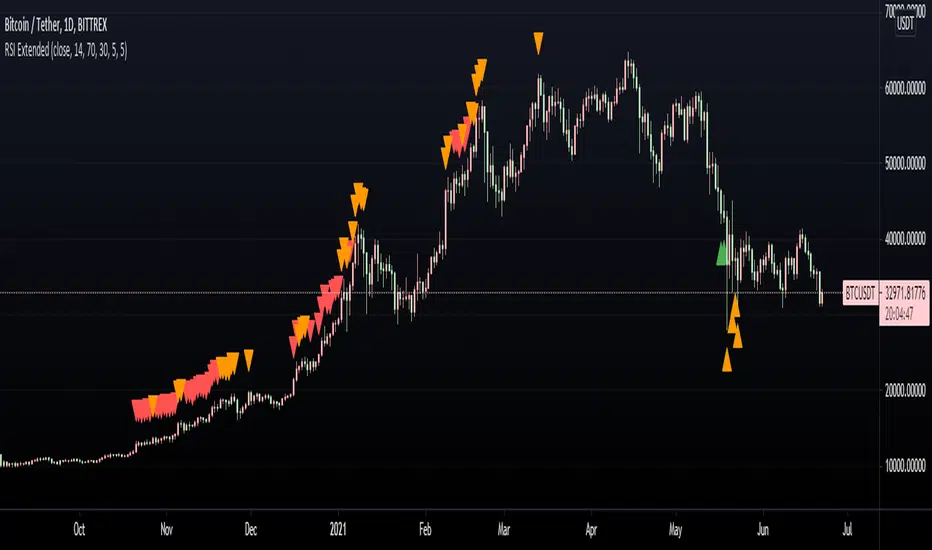
RSI ExtendedThis script is intended to print signals on the main price chart and send alerts when the RSI is overbought or oversold.
You can customize the source of the signal (open, close, etc), as well as oversold/overbought levels, and RSI length.
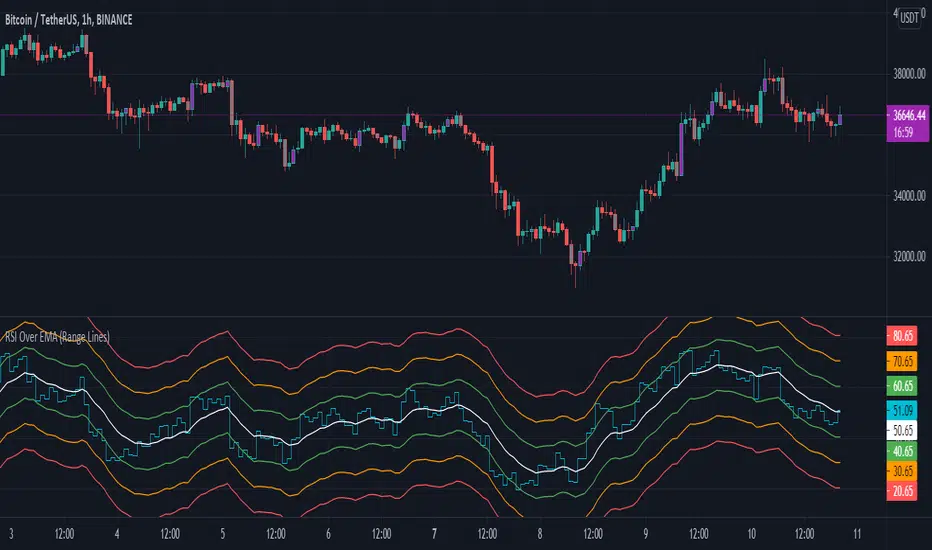
RSI Over EMA (Range Lines)This is another version of the RSI over EMA Trend Sniper script that I released here:
This one gives you better control across pairs wither higher volatility with the extra lines and more alert possibilities.
Here are the useful Alert functions within this indicator:
LONGS:
-Aqua line (RSI Line) - Crossing UP (Long Alert) on the Lower Green line
-Aqua line (RSI Line) - Crossing UP (Long Alert) on the Upper Green line
-Aqua line (RSI Line) - Crossing UP (Long Alert) on the Lower Amber line
-Aqua line (RSI Line) - Crossing UP (Long Alert) on the Upper Amber line
-Aqua line (RSI Line) - Crossing UP (Long Alert) on the Lower Red line
-Aqua line (RSI Line) - Crossing UP (Long Alert) on the Upper Red line
SHORTS:
-Aqua line (RSI Line) - Crossing DOWN (Short Alert) on the Lower Green line
-Aqua line (RSI Line) - Crossing DOWN (Short Alert) on the Upper Green line
-Aqua line (RSI Line) - Crossing DOWN (Short Alert) on the Lower Amber line
-Aqua line (RSI Line) - Crossing DOWN (Short Alert) on the Upper Amber line
-Aqua line (RSI Line) - Crossing DOWN (Short Alert) on the Lower Red line
-Aqua line (RSI Line) - Crossing DOWN (Short Alert) on the Upper Red line
You can setup alerts for the Aqua line (RSI Line) 'crossing up' (Long Alert) or 'crossing down' (Short Alert) on any of the colored EMA lines.
By default the lines are spread out at 10/20/30 and that should cover high volatility charts. But, this is customizable and you can reduce the size of Green/Amber/Red lines to try and get a better more focused setup for whichever coin you are trading on. I have found this version of the RSI over EMA to work better with alt coins that are generally more volatile, but using it on Bitcoin works too.
I am using this for Cryptocurrency alerts, but not for automation to enter or exit a trade. It's important to only use this on normal candles, and only use it as a confirmation of a possible good entry or exit.
Awesome Heikin Ashi [Morty]This indicator uses Heikin Ashi candles and two EMAs to help you follow the trend and enter the trade. Heikin Ashi candles help to smooth the price and EMAs are used to detect trend. The default parameter of EMA is EMA10 and EMA20. You can use it at any timeframe. You should always adjust the EMA length according to different timeframes.
Features:
- Highlight background based on two EMAs
- Adjustable EMA length
- Adjustable Label size
- Show entry and exit signal labels
- Show stoploss price
- You can choose Long only or Short only or both signals
- Alert functions for notification
NOTE: If you use this signal to enter a trade, make sure the candle is close and enter in the next candle.

All in One StudyHere is my All in One Strategy converted into a Study with Alert Conditions you can use for whatever purpose you wish.
Each condition is set up similarly to the way I had the strategy set up, if you pick the indicators you want to base your alerts on it will alert you only if the check box is true.
You can pick one or more of the indicators if you'd like. I only suggest to pick one at a time so you don't have overlapping buy/sell alerts.
I think everyone will find the message of the market falling alert amusing :-)

EMA+RSI Pump & Drop Swing Sniper (SL+TP) - StrategyThis is the strategy version of the 'EMA-RSI-Pump-Drop-Swing-Sniper-With-Alerts':
Some additions with this strategy:
~Added Stop loss & Take profit control. In Settings > Inputs if the Stop Loss is at .051 that means it's 5.1% and the Take Profit at .096 is 9.6%. If you wish to remove the TP and SL just change the value to 1.00 and it would be the same as it being 100% TP and SL which is likely to never be hit.
~Added Backtesting by changing the month/date/year in Settings > Inputs
~Added a 2nd EMA line to assist with the long entry signals. I only use this for long entry & exits, though you could use the long exits as Short entries too. I just personally don't do short trading on Bitcoin.
This is using an EMA and RSI with slightly modified settings to give good entry and exit points while looking at Bitcoin. I use this on a 1-hour and 4-hour chart and with other indicators to find good positions to enter a trade or exit if things are turning red.
It's important to know this strategy was made as a request by another user that was using the indicator version. I don't use this as a trading strategy by itself, I use the visuals it gives as a confirmation with other indicators to find the best possible entry and exit positions.
If you click on the EMA line it will color the bars of the chart based on if they are above or below the EMA - This is just visually helpful for me to see the active trend.
Make sure you hover over or click on the EMA line to see the colors of the candles change - it's not visible by default or without doing this.

MultiAlert LITEAllows one to set 5 price level alerts on one symbol (1 Stop Loss 4 Targets)
Alerts work by prices crosses under the stop loss or over the targets, enabling short reverses this.
Unlike regular MultiAlert, this actually draws a true horizontal price at your price.
This is a lighter version of MultiAlert, supporting only one symbol. Your price levels will appear on all charts unless you hide the indicator.
Make the alert with targets and stop loss set, every time you make a change you MUST REMAKE THE ALERT.
Please comment any problems .

MultiPrice AlertThis is an alert script using Pinescript version 4. This enables one to set 5 alerts (1 StopLoss, 4 Targets), on 3 different symbols, at using a single alert in the UI.
Every visible line will only appear on the symbols that are selected. After setting targets when making an alert, select this indicator as a condition. Change the name to whatever you want, usually the names of the set of tickers.
The Alert message is dyanmic showing which Symbol with each type of alert, at whatever price.
Ability to disable the targets + symbols.
Alerts work by Stop Loss crossing under price and Targets Cross Over. Enabling the "Short" Targets reverses this.
The line that is being displayed is actually the price of the asset being moved over x number of bars. I have not found a way to plot a traditional horizontal line, as the code for it uses a fixed price.
As it being a user input, it is a variable. Any help with this would be appreicated.
Alerts are set to once per bar.
Known bug that sometimes if the prices that you set are inside the current candle stick, then your alert will immeaditally fire, either change the timeframe or let it fire and wait fo
After a target is hit, I reccomend setting the alert to 0 and REMAKING the alert. You MUST REMAKE THE ALERT AFTER ANY CHANGES. This script WILL NOT CHANGE ALERTS AS YOU CHANGE SETTINGS.
TradingView Alerts are not this smart , at least I haven't found a way to do this yet.

Hull MA with BB (With Alerts)This is a combination of the standard Bollinger bands with a VWAP(Pink line), and the 'Hull Trend with Kahlman' script by user capissimo, and the NMA (Moving Average 3.0 (3rd Generation)) script by everget.
You can find the original scripts here:
This indicator gives you several confirmations of a good entry and exit positions for Crypto currency like bitcoin and most alt coins. I use this on a 15min, 30min, 1hour, and 4hour chart for best results.
How to use:
Entry Signals:
-A candle closes above the NMA (Yellow Step Line). AND
-You see a Long (text) flag. AND
-The candles are near the bottom of the Bollinger bands and heading upwards.
Exit Signals:
-Candles have passed below and closed below the NMA (Yellow Step Line). AND
-You see a Short (text) flag.
It's important to use these confirmations with other indicators so you have the best entry/exit positions, and make sure you are on normal candles and not HA or any other types.
There are alerts built in that you can setup for the Short and Long text flags that you see. These are generally good alerts to follow. I use the alerts as a reminder to check the charts and see if my other indicators line up for a good trade.

Easy Entry/Exit Trend Colors (With Alerts)This is an updated version of user Algokid's script called 'AK MACD BB INDICATOR V 1.00'. You can find that original script here:
I added many alerts along with the Bullish and Bearish alerts when the MACD crosses over the Upperband or crosses down on the Lowerband.
I personally use this indicator with Crypto charts (Bitcoin on a 15min, 1hour, and 4 hour timeframe) as one of many confirmations that it's a good time to enter a trade. This script was made to be easy to follow with the colors of GREEN triangles being a good uptrend or entry confirmation, and RED being a confirmation to sell/short or exit your trade.
It's important to use this indicator in combination with other indicators that can give you more confirmations to enter or exit a trade, and make sure you are on normal candles and not HA or any other candles as you can get wildly inaccurate results.
This script also has the Death & Golden crosses, which is the slow and fast moving averages crossing over each other. I don't use this as an additional confirmation, it's just nice to know where the cross happens.

EMA+RSI Pump & Drop Swing Sniper (With Alerts)This is using an EMA and RSI with slightly modified settings to give good entry and exit points while looking at Bitcoin. I use this on a 4-hour chart and with other indicators to find good positions to enter a trade or exit if things are turning red.
If you click on the EMA line it will color the bars of the chart based on if they are above or below the EMA - This is just visually helpful for me to see the active trend.
Make sure you hover over or click on the EMA line to see the colors of the candles change - it's not visible by default or without doing this.

MultiAlert, MultiTargets + TickersThis is my first script, completely made from scratch. Bear with me.
Script that allows one to set an alert for Multiple Price Levels, on Multiple Tickers, complete with Dynamic Messages showing you which ticker, at which price, at which alert (Stop loss, Target 1 etc.), set to Once Per Bar.
Select Ticker, type in price levels that you have for targets & stop loss, move on to the next, or don't and leave 0 and blank.
Disable the targets you do not need in STYLE tab to disable plotting & scaling, leave unused tickers & targets blank & 0.
Create Alert, select this indicator, anyfunction() alert.
MAKE SURE to remake the alert every time you change something, they are not smart enough to change as you change things. Can Confirm by using the numbers in the alert name. You will also have to set the profit level or stop loss to zero every time it triggers to avoid triggered again.
In fact, you do not need the indicator active at all. Add it to a chart and hide it by clicking on the little eyeball icon, to make an alert open the settings for the indicator and type in your targets like normal. Indicator will remain invisable.
I have not found a way to dynamic message the alert name, or else I would.
DISCLAIMER: NONE OF THIS IS FINANCIAL ADVICE. You are completely responsible for whatever happens to you. Do not use the targets in this chart. Do your own research before trading.
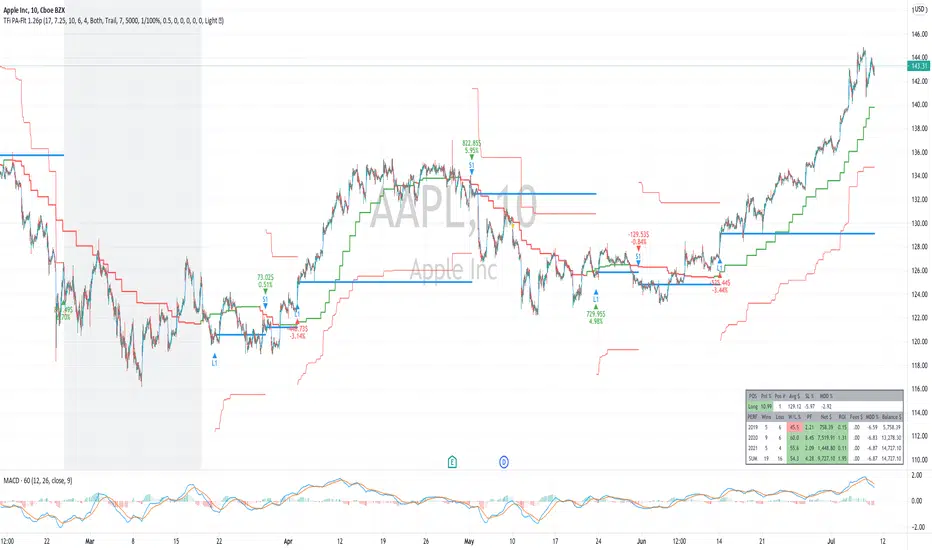
TFi Price Action Resampling Filter V1The script is resampling the price based on its range/price-action and creates an alternative filter to smoothen price movements.
Overview of features:
Optional stop-loss
Optional flags to control the position entry
Optional flags to control the position exit
Built-in backtesting engine with start balance, position size and pyramiding
Inputs for a percentage entry and exit slippage, entry/exit and daily funding fees
Configurable alerts, which follow the exact position of the entry/exit marker
Alert messages contain predefined trading instruction to execute orders via Alertatron or TradeFab's proprietary trading server
The script renders a status box at the last bar, which shows the current position status and result of the built-in trading simulation results.
It shows the following statistic values:
Current position PnL - also background turns green if position is in profit and red if in loss
Average entry price and number of positions
Current percentage distance to the optional stop-loss level
Current Maximum Draw Down
Overall number of wins and losses and the win/loss ratio
Overall profit and loss amount, paid fees
Overall profit-ratio and Maximum Draw Down
Overall balance and ROI
Squeeze Momentum Indicator MTF with alerts [lazy bear]MTF version of the popular squeeze momentum indicator, created and shared by Lazy Bear

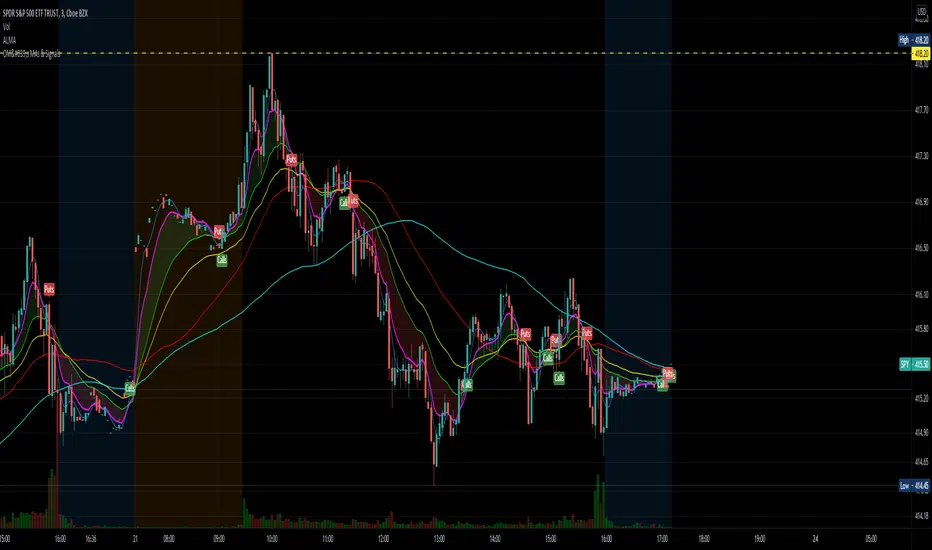
OptionsMillionaire SPY Moving Averages and Signalsby ColeJustice
OptionsMillionaire's SPY Options trading system is based mainly on these indicators:
- 8 EMA*
- 21 EMA*
- 100 SMA*
- 200 SMA*
- MACD
- RSI
- Squeeze Momentum
(*provided by this indicator)
and follows these rules:
|
| 1) I never fight the trend. If its green, i buy calls. If its red, i buy puts. I will only buy puts on a green day if there is a overall change in market trend. Inversely, calls on a red day
| 2) Price action is my #1 indicator. I wait for it to confirm my thesis before i enter a trade
| 3) I only trade SPY Options
| 4) My baseline is to choose a call/put that has a DTE (Date To Expiration) 6-7 days out, with a strike $2-$3 away. I adjust that to fit my current appetite for volatility. i virtually never play same day DTE's.
| 5) I set a 10% stop, but usually exit at 8% before my stop triggers depending on current situation
| 6) I utilize about 10-20% of my Portfolio for one trade. Sometimes more. Rarely less.
| 7) I never hold overnight in these market conditions.
| 8) I shoot for 10-20% for gains. Depending on market conditions.
| 9) Always look for confirmations in your indicators.
| 10) I never force a trade. No trade is a good trade too if the entry just isn't there.
| 11) Patience always pays off. A great set-up can form in minutes or seconds. I never regret being patient to enter. I nearly always regret rushing into a trade.
|
This indicator combines the moving averages into a single unit to simplify one part of the indicator usage rules: the 8 EMA / 21 EMA Cross. . The 8 crossing over the 21 is a Bullish signal, while the 8 crossing under the 21 is a Bearish signal. This indicator places flags at these crossover/under points, as well as shading the area between the 8 and 21 EMAs to help visualize the strength of the trend; green during a Bullish cross, and red during a Bearish cross.
A new addition to this strategy is the Hull Moving Average, or HMA. This script defaults to an HMA of 20 and shows alerts when candles close above or below the plot in the form of green and red candle backgrounds. This alert is best used in conjunction with the main crossovers and should be considered an addition level of confidence rather than providing trade entry/exits directly. This indicator is more flexible and you should feel free to adjust the period if you find a different value works better within your own personal trading style.
Each individual element of this indicator can be modified or toggled, providing maximum customization. While you should strive to become comfortable with the default settings, these options are provided in case you feel the need to adjust for your own style (or if testing on tickers other than SPY, for example).
Goodluch, and happy trading!
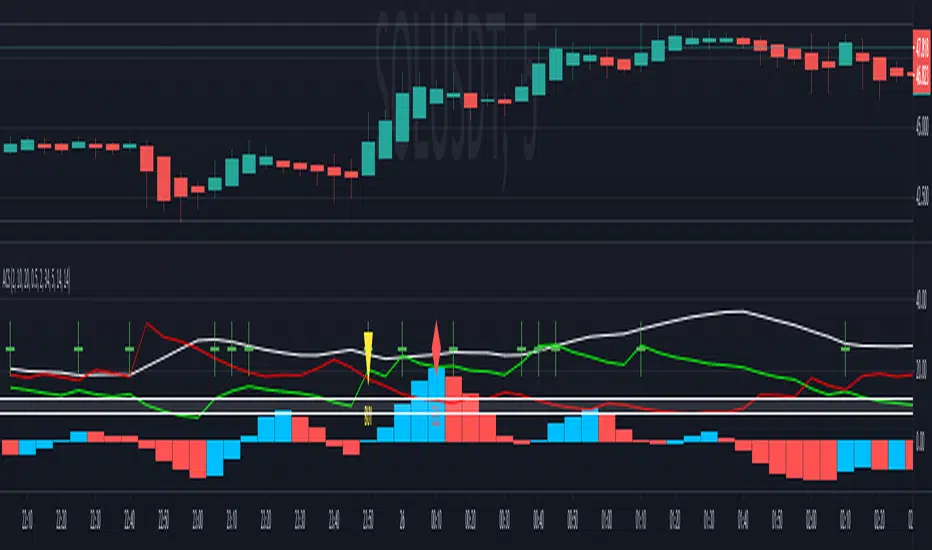
Agisko Crypto Scalper v4.2 (BUY/SELL)Indicator that generates BUY and SELL shapes with alerts.
OSC scale can be configured to visualize the oscillator better. Nothing required, just for visualization.
DMI mark is by default 10 which is fine for most situations.
DMI range is the buffer zone where BUY orders will be created. E.g.: DMI mark 10 and DMI range 1 will create a zone for BUY when DMI+ is between 9 and 11 (10-1 and 10+1).
This works perfect on the 5 minute chart and is suggested to use the SELL alert for exits or use a take profit (TP) of 1% with optional trailing if you use bots like 3 commas.
Stoploss is the same. Use the SELL alert or set a manual stoploss of 2-5%.
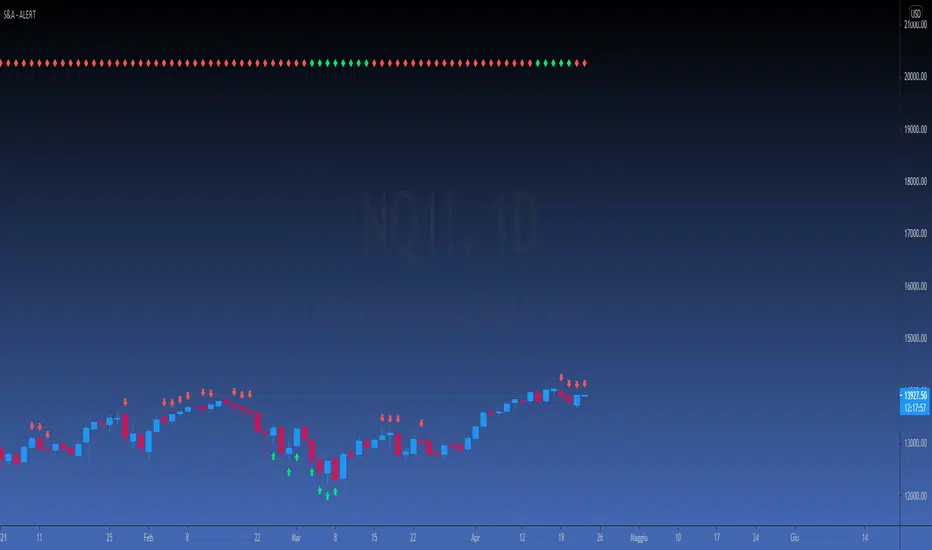
[FP] STOCH & ADX EASY ALERTENG DESCRIPTION
This script is a simple request from user, that want to have an allert when ADX and Stochastic has certain contidion.
Also this indicator show when ADX is > or < than 40 when with red and green diamonds on top.
It's used to validate a weakly setup to trade FUTURES.
DESCRIZIONE IN ITALIANO
Questo script è una semplice richiesta da parte di un utente, il quale richiedeva un alert quando lo Stocastico e l'ADX raggiungono determinate condizioni.
Inoltre l'indicatore mostra quando l'ADX è maggiore o minore di 40 plottando dei diamanti in alto sul grafico.
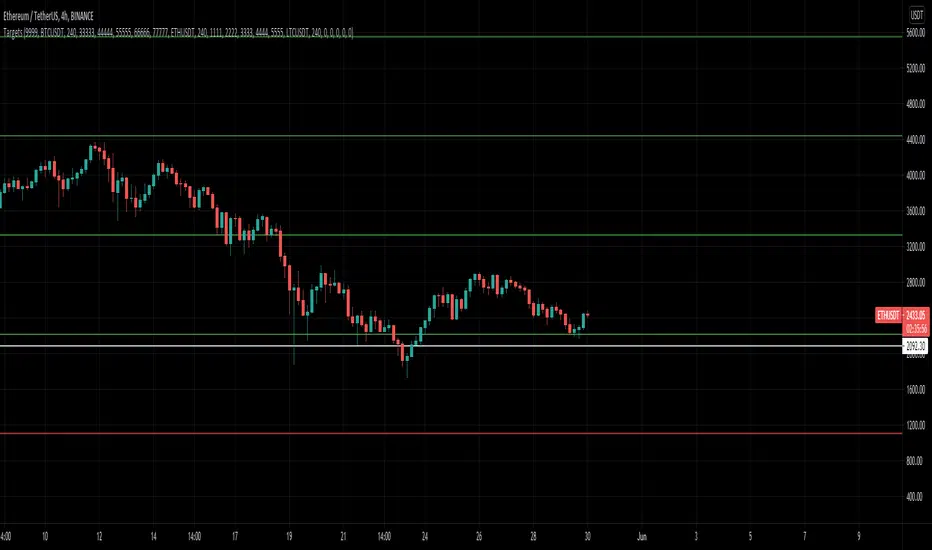
Carpe Diem [Alerts]Carpe Diem Alerts, a wave cycle strategy that only enters when markets are up trending.
The script uses 3 different trend detection indicators including volume which helps with confirmation.
This script has 10 variations built within it which are fitted for the coins differnt coinditions
Alertconditions for longs and long Exits are added for these coins
The coins included are
BTC /USDT 4H
ETH/USDT 4H
LTC/USDT 4H
ADA/USDT 4H
BNB/USDT 2H
BAND/USDT 4H
BAT/USDT 3H
OGN/USDT 4H
ZIL/USDT 4H
BZRX/USDT 2H
How to use the Indicator
You can change what plots are shown in the settings Cog
When the wave lines are green, the market is up trending and will be looking for a trade whereas when they are red, the market is in a sideways or downtrend.
The buy signal is given by the fast wave either crossing over the slow wave line, or crossing over the value of 25.
The exit signal is when the wave crosses back under the 75 value
There is NO Repaint. The script is written in version 4
This strategy performs best on the Binance listings

Trend Surfers - Premium Breakout + AlertsTrend Surfers - Premium Breakout Strategy with Alerts
I am happy today to release the first free Trend Surfers complete Breakout Strategy!
The strategy includes:
Entry for Long and Short
Stoploss
Position Size
Exit Signal
Risk Management Feature
How the strategy works
This is a Trend Following strategy. The strategy will have drawdowns, but they will be way smaller than what you would go through with buy and old.
As a Trend Following strategy, we will buy on strength, when a breakout occurs. And sell on weakness.
The strategy includes a FIX Stoploss determined by an ATR multiple and a trailing Stoploss/Takeprofit also determined by an ATR multiple.
You can also manage your risk by entering the maximum % you are willing to risk on every trade. Additionally, there is an option to enter how many pairs you will be trading with the strategy. This will change your position size in order to make sure that you have enough funds to trade all your favorite pairs.
Use the strategy with alerts
This strategy is alert-ready. All you have to do is:
Go on a pair you would like to trade
Create an alert
Select the strategy as a Trigger
Wait for new orders to be sent to you
Every Entry (Long/Short) will include:
Market Entry (Enter position NOW!)
Stoploss price
Position Size
Leverage
* If you do not wish to use leverage, you can multiply the Position Size by the Leverage. But doing that, you might end up with a position greater than your equity. Trading on Futures is better in order to have accurate risk management.
Exit signals:
When you receive an exit signal, you need to close the position ASAP. If you want to keep your results as close as possible to the backtest results, you need to execute quickly and follow what the strategy is telling you.
Do not try to outsmart the strategy
Leave your emotion out of trading! If you trust the strategy, you will have way better returns than if you try to outsmart it. Follow each signal you receive even if it doesn't seem logical at the moment.
Become a machine that executes. Don't look at fundamentals. Follow the trend! Trust the strategy!
I hope you enjoy it!
