OBV_RMA_CRYPTO Buy and Hold Destroyer free versionThis is a free version which use part of the logic that I am applying on my destroyer/annihilation series of strategies.
This version its made for 8-12h and works amazingly on the ETH pairs. Can be adapted to others as well
For this example, I used an initial 1$ account, using always full capital on each trade(without using any leverage), together with a 0.1% commission/fees for each deal, on Coinbase broker.
For risk management, we have a hard stop loss on the equity of 25%.
The components for the inside of the strategy are the next one :
1. OBV- SoftKill Version adapted to cryptos
2. ATR - SoftKill Version adapted to cryptos
3. RMA Rolling moving average
The rules here are simple we check for the trend direction with ATR and then we check for cross up or above on OBV and RMA moving average. Based on this we enter long or short.
RISK WARNING
Trading on any financial market involves a risk of loss. Please consider carefully if such trading is appropriate for you. Past performance is not indicative of future results.
If you have any questions or you are interested in trying it, private message me and I will give you as soon as I see the message a trial for it.
ETHUSD

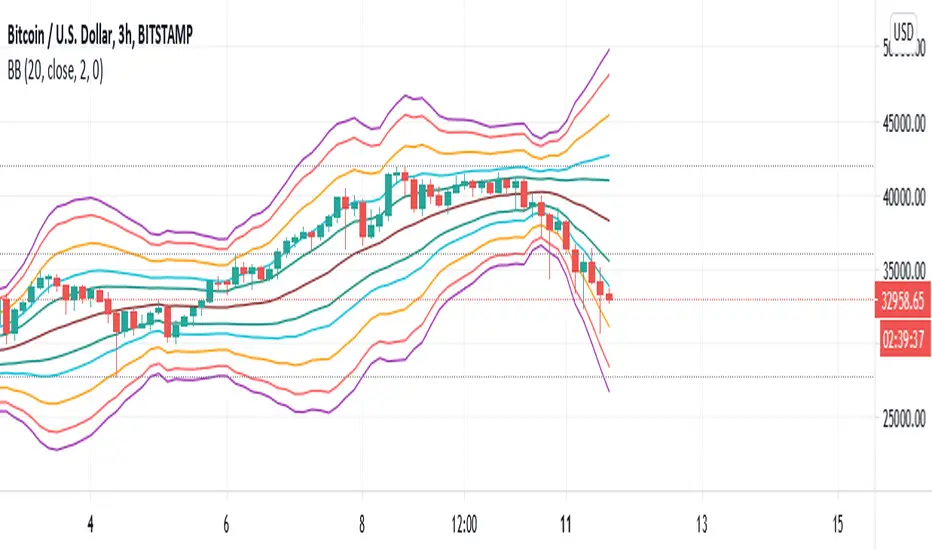
Bollinger Bands Fibonacci Ratio Standard Deviation LINESHello Traders.
in this script, Bollinger bands are made based on a standard deviation with respect to Fibonacci ratios. I hope you can be satisfied. If you are satisfied with this script, please like and feel free to share your comments with me.
Teal Upper and Lower B-Bands = 1.0 Standard Deviation
Aqua Upper and Lower B-Bands = 1.618 Standard Deviation
Orange Upper and Lower B-Bands = 2.618 Standard Deviation
Red Upper and Lower B-Bands = 3.618 Standard Deviation
Purple Upper and Lower B-Bands = 4.236 Standard Deviation
you can use this indicator by clicking the button (Add to Favorite Scripts) and then add it to your chart from (Fx) section.
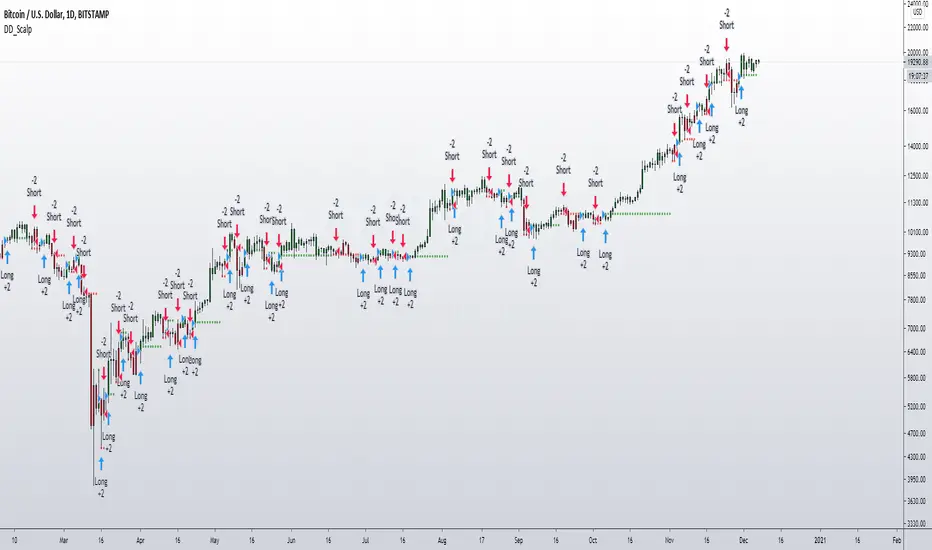
DD_ScalpDD_Scalp is a buy/sell trading strategy based on momentum from breakout levels. It works well on 1D and 4H timeframes. It is a helpful indicator for scalping short range profits on a daily basis or for booking profits in a high time frame setups such as those given by my DD_Echo indicator. It works for all major cryptos such as BTC, ETH, LINK, and other alts. It also works for forex.
If you want to access this, please DM me.
Crypto ZigZag RSI strategy 15minThis strategy is designed for crypto markets like ETHUSD/T, BTCUSD/T and so on.
It works amazingly with 15 min time frames.
Its idea consists in :
We have the RSI indicator, and with it we check for the crossover with overbought and oversold levels. At the same time we have the zigzag which is made from the higher highs and the lower lows between a specific price movement in %.
For entries, they are going to be based on the crossover of rsi with overbought or oversold levels , combined together with cross over 0 line from the the zigzag.
At the same time the strategy has the posibility to go only long, only short or both.
Let me know if you have any questions.

Multi Time Frame Buy&Sell V4.0 [BACKTEST]Hi guys,this indicator Developed for Intraday and multi Time Frame Trading. Note: Invite only Script.Request to me Access permission to test this.
*** THIS IS STUDY VERSION ***
Time Frame : can use for 15 min / 30 min / 1h / 4h time
15 min configuration is best result for bitcoin and ethereum .
This can be used : Crypto Currency/ Bitcoins / ethereum ,Forex,currencies ,Index ,Commodity Gold / silver , Oil Market and in Equity / Futures
ETHUSDT Futures 15min
BTCUSDT Futures 15min:
GOLD /USD FOREX 15min:
HOW IT WORKS:
this indicator analyze EMA&SMA support and resistance then combine with pivot point and fibo levels is used to calculate the signals.and finally show entry label on
chart with target point and stop loss
HOW TO USE:
Creating a signal is as simple as adding the indicator called to your chart(buy or sell)label and background color change ( green=buy / red = sell)
green line is target and black line is stop loss.
in top of setting page you can see noise filter option . that can change it to get better result and reduce noise. in setting can set 3 target level and stoploss
NOT:all information show to info panel in chart.
strategy tester : enabled .All you can test this in live market in any segment.
NOT: can to change noise filter in setting setup until to get best result.
Choose any Date Month Year to Current Date and check the results below in the Strategy Tester.
REPAINT/NO REPAINT : No Repaint ,entery labal(buy or sell) and Background Color wont change. In the current candle position wait for the candle to close to see the
stability.
"Set alert": Select "Once per bar close" for your alert options.
There are 5 alerts:
- BUY
- SELL
- BUY OR SELL (for free TV users)
- take profit
- stop loss
Review and Feedback.Thank you!
Any issues report to me to Fix.Thank you!
how To Get access : Use the link below to obtain access to this indicator or PM us to obtain access.

Bitcoin Top Finder by DataDaterBitcoin Top Finder is an indicator that detects the absolute top of BTCUSD in each bull cycle (red line). It is also helpful in detecting bottoms of cycle (blue). It is based on cost of electricity and mining hash rate.
If you'd like access to this script, please send me a direct message.

Multi Time Frame Buy&Sell V4.0 [ALERTSETUP]Hi guys,this indicator Developed for Intraday and multi Time Frame Trading. Note: Invite only Script.Request to me Access permission to test this.
*** THIS IS STUDY VERSION ***
Time Frame : can use for 15 min / 30 min / 1h / 4h time
15 min configuration is best result for bitcoin and ethereum .
This can be used : Crypto Currency/ Bitcoins / ethereum ,Forex,currencies ,Index ,Commodity Gold / silver , Oil Market and in Equity / Futures
ETHUSDT Futures 15min
BTCUSDT Futures 15min:
GOLD /USD FOREX 15min:
HOW IT WORKS:
this indicator analyze EMA&SMA support and resistance then combine with pivot point and fibo levels is used to calculate the signals.and finally show entry label on
chart with target point and stop loss
HOW TO USE:
Creating a signal is as simple as adding the indicator called to your chart(buy or sell)label and background color change ( green=buy / red = sell)
green line is target and black line is stop loss.
in top of setting page you can see noise filter option . that can change it to get better result and reduce noise. in setting can set 3 target level and stoploss
NOT:all information show to info panel in chart.
strategy tester : enabled .All you can test this in live market in any segment.
NOT: can to change noise filter in setting setup until to get best result.
Choose any Date Month Year to Current Date and check the results below in the Strategy Tester.
REPAINT/NO REPAINT : No Repaint ,entery labal(buy or sell) and Background Color wont change. In the current candle position wait for the candle to close to see the
stability.
"Set alert": Select "Once per bar close" for your alert options.
There are 5 alerts:
- BUY
- SELL
- BUY OR SELL (for free TV users)
- take profit
- stop loss
To Get access - Send me a private chat message in tradingview.com to get access.Or request in comment section below.
Review and Feedback.Thank you!
Any issues report to me to Fix.Thank you!
Use the link below to obtain access to this indicator:

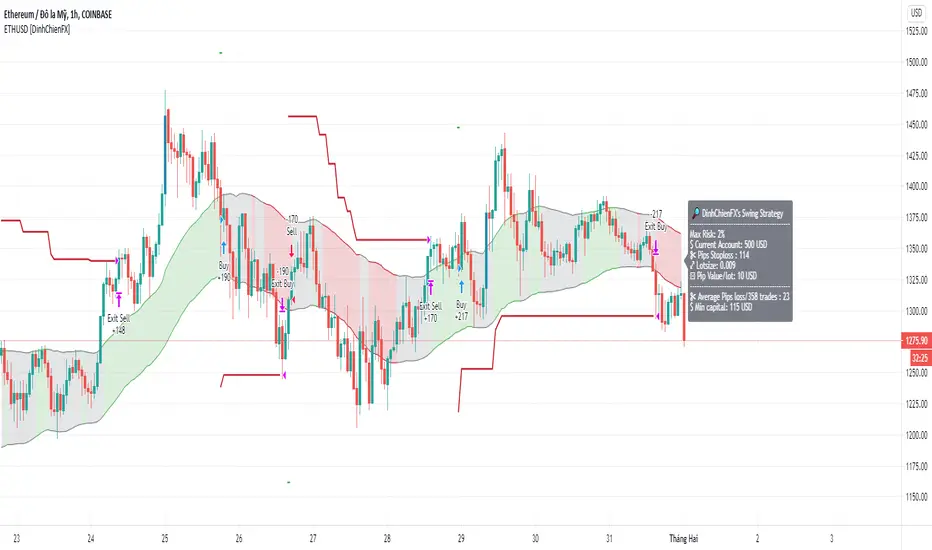
ETHUSD signal [DinhChienFX Corner] Ver 1.01. How to use Keltner Channel
a_ Length of Keltner's basis line is 50. It gives the best result in finding rule of ETHUSD.
b_ How to confirms a trend.
- Upper 1 is used to confirm Keltner channel at Uptrend to give Buy_1.
- Lower 1 is used to confirm Keltner channel at Downtrend to give Sell_1.
c. How to determine a swing Entry.
- Upper 1 is used to buy when the market make a corrective.
- Lower 1 is used to sell when the market make a corrective.
d. Color count calculate
- Color count = Green + Red
- If Color count > 0 is Uptrend to give Buy_2
- If Color count < 0 is Downtrend to give Sell_2
2. Long signal is confirmed when Closed of candle crossover the Upper 1 & Color count for Uptrend.
3. Short signal is confirmed when Closed of candle crossunder the Lower 1 & Color count for Downtrend.
4. Stoploss is calculated by the price closed candle +/- the value of Average true range (length=20 bars)
Stoploss = previous Close +/- atr(20)x2x0.9
-> To move the stoploss every 1 hour.
5. Filter the Candle is over 93% for Not Entry.
6. Report the result at Backtest:
a. Longterm result 2018-23/9/2020:
b. Midterm result (every year)
_ 2018-2019:
_ 2019-2020:
c. Shortterm 01/01/2020 to 09/23/2020
--------------
"Use the link below to obtain access to this indicator" or "PM us to obtain access"
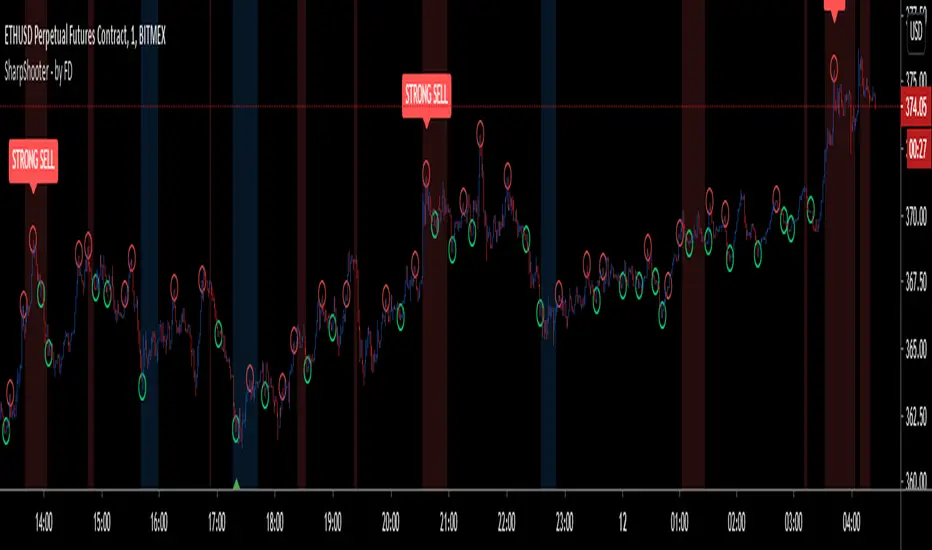
Sharp Shooter - by FiatDropoutThis is an experimental script and is intended to be used only on LTF charts for scalping. It may or may not be useful on other charts and time frame, but that is subject to back testing.
Now, coming back to this script. It has multiple features yet i tried to keep it as clean in representation as possible.
As obvious, few things are easily recognizable on chart, such as:
BUY - Go LONG
STRONG BUY - Heavy Uptrend is expected, Go LONG
SELL - Go SHORT
STRONG SHORT - Heavy Downtrend is expected, Go SHORT.
on addition to above signals, there are few other plot-shapes, which are:
Red Circle - Acts as TP for LONG during uptrend and acts as Add-On SHORT during downtrend
Green Circle - Acts as TP for SHORT during downtrend and acts as Add-on LONG during uptrend.
Red Background - Bearish Peak, potential start of downtrend
Blue Background - Bullish Peak, potential start of uptrend
------------------------------------------------------------------------------------------------------------------------------------------------------------------------------------
Now that plots are over, lets go to how to use them. As name of this script suggests, it intends to find most optimal entry and exit for long and short while taking profit on the way and adding to the position until trend changes.
Be aware that trend here is very much based on current time-frame and does not represent other time-frame's bias. Also, trend here is intended to be used as a scalp trend and not a swing trend.
Now once, you get a signal for BUY(example), then wait for "Bullish Peak"(blue background) to appear with either "STRONG BUY" or just "BUY" and take an entry at respective price, next look for "red circle" which acts as TP for long(refer sec, above) and either move stop to entry, or take partial profits or close position entirely.
Now every subsequent "green circle" will act as add-on for long and every "red circle" will act as TP for long, until "Bearish Peak" appears, which will reverse the order of how circles are used and direction of the trade. Now during "Bearish Peak" and until "Bullish Peak" appears, "red circle" will act as add-on for short and "green circle" will act as TP for short.
It might take some time to adjust to the plots, but i have decided to keep it that way in order to keep chart clean of too many signals.
------------------------------------------------------------------------------------------------------------------------------------------------------------------------------------
NOTE : Please use stops and be sure to place orders quickly as prices move faster on minute charts and you should be able to place orders and stop right away, so if you are new to trading and are currently in early stage of the business, scalping is strongly not advised, let alone this indicator. Also, past performance are not guarantee of future results and most importantly, this indicator does not repaint. By using this indicator, you accept that i am not responsible for any losses or gains made by user by trading with help of this bot.
Also, in next update, i will fix some bug, add some SS and also add alerts. Alerts are not being added currently because of high volatile nature of the bot signals which if tried on automation can give varied results. Once everything is set, i shall add alerts.
for any other queries, feel free to get back here on chat or DM.
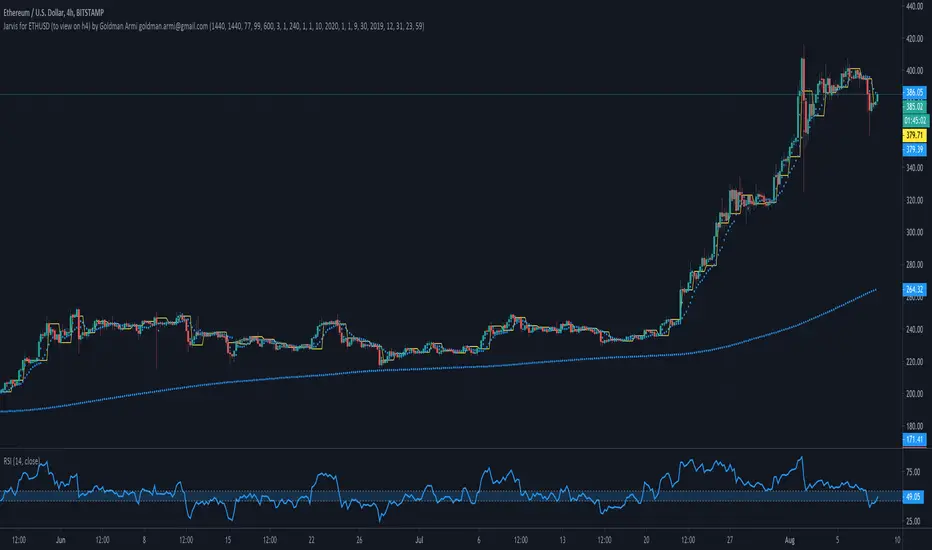
Jarvis for ETHUSD by Goldman ArmiThis strategy is called JARVIS after the famous AI from the MARVEL movie Iron Man.
It is an improvement of the Copernicus Strategy to get better results. More exactly I was aiming to obtain over 50% of the number of trades profitable, for every pair provided (see the title).
The strategy tester does not include leverage trading, please keep that in mind and feel free to change the parameters of the volume for the position in the strategy settings to see the closer to reality results.
The setup for this strategy is more complicated because it includes 3 averages, all of them calculated with prices obtain by various formulas for each one of them and I call this: Sophisticated Moving Average (Copyright). Each of the 3 averages are applied to different timeframes and have different values. All of these parameters are configured separately for every trading pair and this is why I am publishing them separately.
There are not a lot of trades in this strategy, the average is around 1/month.
You can use the Tradingview alert services to configure this to execute (webhook) on your exchange/broker, because strategies have now the possibility to send alerts.
For other questions please send me a message.
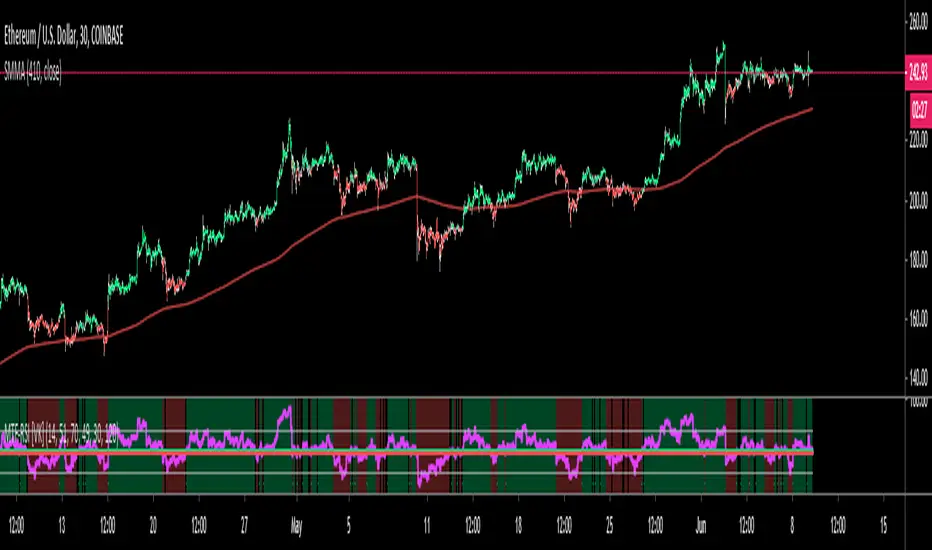
MACD Trend [VK]This strategy shows the trend using MACD
Use higher TF for better view
Combine MTF -RSI for entry points and use both indicators together to better understand the trend
THANK YOU

KINSKI RSI Short/LongExtends the display of the Relative Strength Index (RSI) by shorts and longs from Bitmex and shows them as a diagram.
How to interpret the display?
- blue line is the default Relative Strength Index
- red line means "oversold
- green line "overbought"
- grey dotted line up/down indicates the optimal range for up and down movements 30 to 70
- in general, the reaching or crossing of the thresholds in the direction of the mid-range is seen as a possible buy or sell signal
- RSI values (blue line) of over 70 percent are considered "overbought", values below 30 percent "oversold
Which settings can be made?
- Selection for the "Currency". Default value is "BTCUSD". Currently only the following currencies are supported "BTCUSD", "ETHUSD", "ETCUSD", "OMGUSD", "XLMUSD", "XTZUSD".
- Selection for calculation formula ("Calculation"). The default value is "hlc3".
- Field for the moving average value ("RSI Length"). The default value is 14, but values of 7, 9 or 25 are also common. The shorter the period under consideration, the more volatile the indicator is, but with longer periods, fewer signals are triggered.
- furthermore you can make layout adjustments via the "Style" menu

MTF-RSI+Candles [VK]This is the strategy where we buy when RSI is above 51 line and sell below 49 line
Ability to change RSI TF
Ability to change default value of RSI/upline/lowline/oversold/overbought lines
Ability to switch show/hide backgrount color
Ability to switch on/off candle colors when RSI crosses up/upline down/lowline
Ability to plot B/S signals when RSI crosses up/upline down/lowline
alerts added
can also be used as standard RSI
MA Pull [VK] - alert version of vkscalperThis is the alert version of vkscalper
you will need to change the settings for different TF also try changing MA types
Ability to choose MA types
Ability to plot stop loss / take profit lines
simply select buy alert or sell alert for alerts

VK trend scalper 30mThis strategy is designed to be used on the 30 minute time frame
In this strategy, I actually implemented my own scalping style into building the strategy. Having to replicate my own trading strategy into an algorithm, I can't make it exactly perfect to how I would trade, but what I can do is try and program the parameters that give it the absolute best chance of making a big move with a small drawdown- which replicates part of my trend trading style. Here I am using VWMA , EMA and trend filtering values to find trend change and best entries.
you can also try it on any cryptocurrency/forex/commodity/stocks
*This script is currently experimental you can try it if you want.

Simple EMA trend indicatorSimple EMA trend indicator , pretty straightforward green equates to bullish and usually a retest/wick is often seen , same for the flipside viceversa


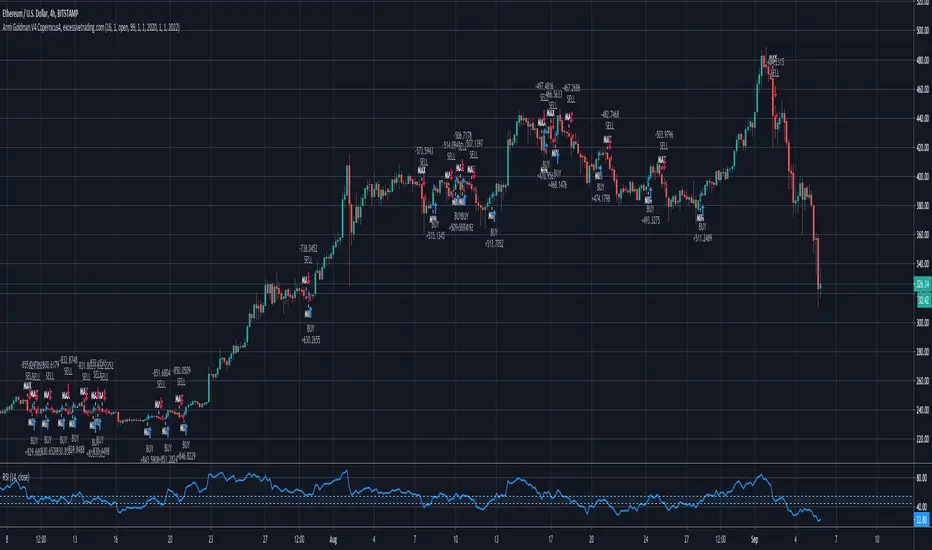
Armi Goldman V1.7 CopernicusScript uses an EMA (Exponential Moving Average) as an indicator. When the price crosses (breakout/breakdown) the EMA, the trigger is activated. Script does the breakout and breakdown calculations. It considers one candle close above or below the EMA.
It is used only in trending markets like bullish trends and/or bearish trends and never in flat. It can get very bad results so pay attention!
Feel free to test it and add comments.
I am open to answer any questions.
I would like to know what you think and how can we improve this strategy.
Thank you & enjoy!
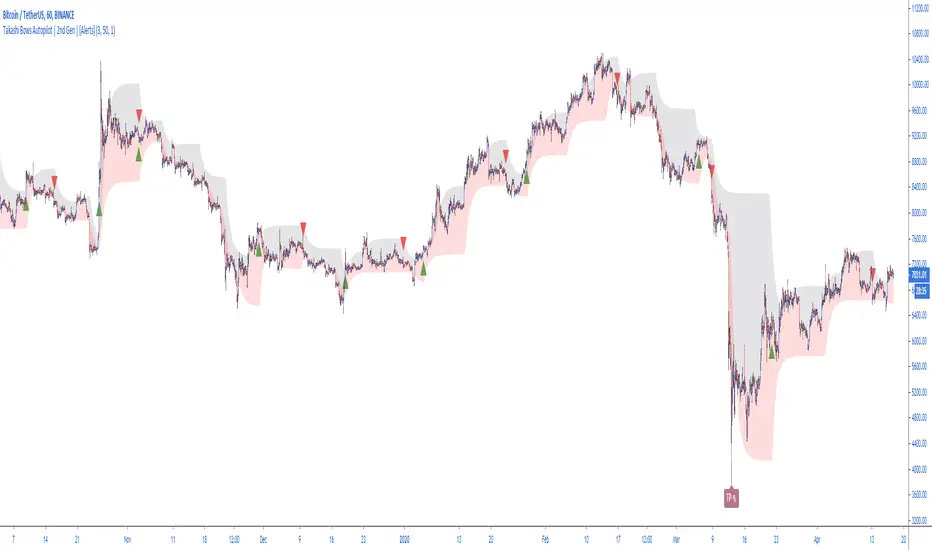
Takashi Bows Autopilot | 2nd Gen | [Strategy]This is a strategy tester for Takashi Bows Autopilot indicator. Please check for more details and instructions at our website.
Takashi Bows Autopilot is the ultimate trading tool. Effortless, its signals put traders inside strong trends, locking big profits that cover all loss generated during sideways trends.
An upgrade version of Takashi Bows v1, this script is the result of some operations developed by us, it can easily adapt to different markets and time frames. Now ranging from level 1 to 20, traders can select the amount of signals to be displayed on the chart. Based on price movement, it signals entries after strong movement up or down.
Take Profit included. If a position is opened in one direction, it should be closed at take profit levels or when a position in the opposite direction is opened.
Inputs
Level
Integer input. Sets a level for signals generated up and down. The higher the level, more signals on chart, and vice-versa.
Take Profit %
Float input. Sets a percent of take profit for exiting previous open position.
Rule
Float input. Sets a ruler for more accuracy on less volatile markets. Standard value 1 for high volatile markets, higher values for low volatile markets.
Disclaimer:
Back-tests do not guarantee performance on the future. Even if a trading setup is profitable in historical data. it could be unprofitable in the future.
To get access to this and other scripts check links below.

Takashi Bows Autopilot | 2nd Gen | [Alerts]Our state-of-the-art trend confirmation indicator is now combined with automatic threshold selection.
Takashi Bows Autopilot is the ultimate trading tool. Effortless, its signals put traders inside strong trends, locking big profits that cover all loss generated during sideways trends.
An upgrade version of Takashi Bows v1, this script is the result of some operations developed by us, it can easily adapt to different markets and time frames. Now ranging from level 1 to 20, traders can select the amount of signals to be displayed on the chart. Based on price movement, it signals entries after strong movement up or down.
Take Profit included. If a position is opened in one direction, it should be closed at take profit levels or when a position in the opposite direction is opened.
Inputs
Level
Integer input. Sets a level for signals generated up and down. The higher the level, more signals on chart, and vice-versa.
Take Profit %
Float input. Sets a percent of take profit for exiting previous open position.
Rule
Float input. Sets a ruler for more accuracy on less volatile markets. Standard value 1 for high volatile markets, higher values for low volatile markets.
See Bows
Bool input. If true, Bows lines can be seen on chart.
To get access to this and other scripts check links below.
Super Algorithm Strategy (Joy Bangla)This is the strategy tester for the
Below are the performance results
Starting with $10,000
Net Profit: 88%
66% profitable trades
34% losing trades. Do look at the losing trades. If one did careful moment management, some of those may end up profitable as well.
4.158 Profit factor.
16.1% drawdown. I would go a bit more and say if I am using this, my risk management should ensure for a stop loss of 20%.
66 bars on average (aka it holds for a long time. So, one needs to look into the funding factor in money management)
Sharpe Ratio: 0.291
Only 7 trades done (with 6 closed) in 2 and a half years. So this absolutely reduces noise as much as possible.
In short, if I had $10000 of BTC beginning of 2018, I would be having $18,878 worth of btc right now.
With 4x leverage, this could be a huge potential.
For info on gaining access see the ⬇ link below ⬇ in our signature field & direct message me. I have a busy schedule at my own workplace. Trading is my hobby. Hence, please be kind to me if I am late in replying.

Super AlgorithmIf you make a loss, I am not responsible for it. Please use this with caution that includes proper risk and money management.
When I see a sell signal, I may short &/or close my long.
When I see a buy signal, I may long &/or close my short.
The signal is most relevant for the exact time it comes on the chart. When the bar closes, it does not repaint.
The signal can show up and disappear on a running bar. It DOES NOT repaint once the bar is closed.
Do realize that on bar close, the price may have moved significantly, and the signal may not be relevant anymore. So, it needs to be used with caution whether one uses this as soon as a signal appears or on bar close. This is not suitable for the highly large timeframe (ake over 1day). I use it on 1 day and monthly on the lower timeframe.
My primary motivation for building this was three -
1) To ensure I am not addicted and not looking at the chart 24/7
2) To ensure I do not spend a lot of time & resources on multiple indicators
3) I have a consistent profit that can help me in my poor living expenses.
4) Recently, during the huge drawdown, I noticed that my other indicator () was unable to act as quickly as needed as the volatility happened in the lower timeframe. It made me realize that I need to do something to protect my capital in the future. Hence, the idea for this indicator.
5) I use this indicator alongside my other indicators that are showing the chart as well.
In the chart above, I am using
*
*
*
*
* And this indicator
You do not need to use all of these indicators. I have them always on my chart as I showed above.
The buy and sell shown with a blue background is the one coming from this indicator. The only thing that one can customize is colour.
This indicator differs significantly from my other indicators. This indicator prints less signal as careful work went in to reduce noise as much as possible and is to be used for 1 day or less tf.
I use it alongside other indicators for confirmation bias. The other indicators I use are the ones that come from me as well as shown on the chart.
This can possibly be used for other instruments. As I only use it for trading BTCUSD, I have crudely tested for BTCUSD after the dump and has been doing ok so far.
The code is written in Version 4 of pine script. If there are bugs, please let me know.
For info on gaining access see the ⬇ link below ⬇ in our signature field & direct message me. I have a busy schedule at my own workplace. Trading is my hobby. Hence, please be kind to me if I am late in replying

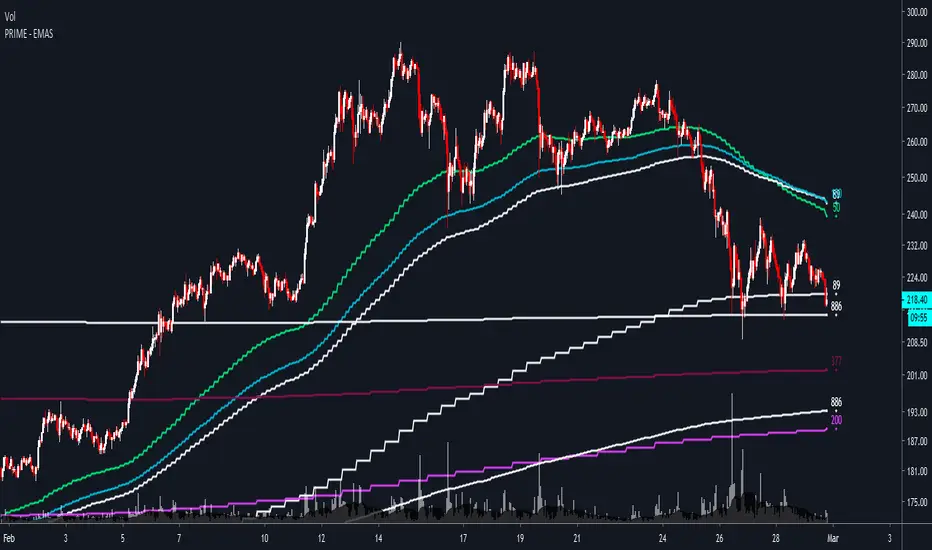
PRIME - EMAS - ETHUSD
PRIME - EMAS - ETHUSD is an indicator that allows you to see some of the best hourly, daily, weekly and monthly EMAs/SMAs for trading ETHUSD .
These are timeframe-fixed EMAs/SMAs, which means that they will provide you with the same data in all timeframes, unlike most EMAs/SMAs indicators out there.
You also have the option to show them in full or a simplified version of them to declutter your chart.
For access and questions, please message me here on TradingView. I will be happy to help!