Highs and Lows By ScalprHighs & Lows (HL) – Multi-Time-Frame Levels
What It Does
Highs & Lows plots the most important reference levels for up to four different time-frames at once. It displays divider lines that mark the start of each new period, opening lines showing the first price of the period, highs lines tracking the highest price reached, and lows lines tracking the lowest price reached in each period. Use it to read market structure at a glance, trade opening-range returns, gap fills, sweeps and other level-based setups.
Key Features
Multi-Time-Frame Engine
Choose from 4 Hour, 1 Hour, 30 minutes, 15 minutes, 10 minutes, 5 minutes, Daily, Weekly or Monthly for each of the four slots. Turn individual slots on/off from one global panel for easy management.
Per-Time-Frame Display Controls
For every active slot you can independently toggle divider lines, opening lines, highs lines, lows lines, and hide current opening to keep only completed periods visible.
Smart "Show Last X" Filters
Keep charts clean by limiting history. Control how many recent periods to show for lines and how many recent text labels to display. For example, show only the last 2 hours on a 1-hour chart.
Hide Swept Highs/Lows
Automatically hide any highs or lows that price has traded through, keeping your chart clean and focused only on unswept levels that remain relevant.
Text Labels
Add optional custom text for highs and lows like "H1" and "L1". Labels automatically position above highs and below lows with horizontal alignment options of left, center, or right. Adjust color, size and font weight to match your preferences.
Styling Freedom
Independent color, line style including solid, dashed, or dotted options, and width settings for each level type. Transparency is applied automatically when hiding current period information.
How to Use
Start by enabling the time-frame slots you need in Global Settings. In Multi-Time-Frame Settings, pick the interval for each slot and toggle which lines you want displayed. Fine-tune visibility using "Show Last X" in Time-Frame Lines to limit historical lines, and "Show Last X" in Text to limit labels. Adjust colors and widths in the Time-Frame Lines sections to match your chart theme.
Notes
The script is lightweight and deletes old objects in real time to maintain TradingView's limits. It works on any symbol and chart resolution with levels updating live. Text labels are purely textual with no background boxes to maximize clarity and reduce chart clutter.
Happy trading and stay level-headed!
Fractal

10/50 EMA Cloud + 21 EMA + VWAP + FractalsThis indicator is designed for active traders and combines several popular technical analysis tools into a single, easy-to-use overlay. It helps traders identify trend direction, dynamic support and resistance, and potential reversal points, all while providing optional fractal signals for added clarity.
Features and Components
1. EMA Cloud (10/50 EMA)
10-period EMA (Exponential Moving Average): Tracks short-term price momentum.
50-period EMA: Represents a longer-term trend.
Cloud Visualization: The area between the 10 and 50 EMA is filled with color:
Green cloud when the 10 EMA is above the 50 EMA, signaling bullish momentum.
Red cloud when the 10 EMA is below the 50 EMA, signaling bearish momentum.
Purpose: Quickly visualize the prevailing trend and potential trend shifts.
2. 21-period EMA
21 EMA: Plotted as a blue line, this moving average is widely used to gauge intermediate-term trend and dynamic support/resistance.
Purpose: Acts as a reference for trend-following entries and exits.
3. VWAP (Volume Weighted Average Price)
VWAP Line: Plotted in orange, VWAP gives the average price weighted by volume for the session.
Purpose: Useful for identifying fair value, potential bounce/reversal zones, and institutional interest levels.
4. Fractals (Toggleable)
User Option: A setting allows the user to turn fractal signals on or off.
Fractal Logic: Uses a 5-bar pattern:
Up Fractal: Plots a green triangle above the bar if the high of the middle bar (2 bars ago) is higher than the highs of the two bars before and after.
Down Fractal: Plots a red triangle below the bar if the low of the middle bar (2 bars ago) is lower than the lows of the two bars before and after.
Purpose: Highlights potential short-term reversal points or swing highs/lows.
5. Volume Bars
Volume Histogram: Plotted in gray at the bottom of the chart.
Purpose: Provides context for price action, helping to confirm breakouts or identify exhaustion.
How to Use This Indicator
Trend Identification: Use the EMA cloud and 21 EMA to determine the prevailing trend. Trade in the direction of the cloud color and EMA alignment.
VWAP Strategies: Look for price reactions at the VWAP for possible rebounds, breakouts, or reversals.
Fractal Signals: Enable fractals to spot potential reversal zones or to fine-tune entries/exits at swing points.
Volume Confirmation: Use volume bars to validate the strength of moves, especially near key EMAs or VWAP.
Customization
Fractals On/Off: Easily toggle fractal signals in the indicator settings to reduce chart clutter or focus on other signals as needed.

GUARDEER ENTRY SYSTEM [v1.0]📈 GUARDEER ENTRY SYSTEM – INVITE-ONLY ACCESS 🔐
This elite-level indicator combines Smart Money Concepts (SMC), ICT-style BOS/CHoCH, Fair Value Gaps (FVG), Volumetric Order Blocks, and premium zone logic to deliver sniper-precision entries on XAUUSD and FX pairs.
🔥 Features:
• Real-time BOS, CHoCH, CHoCH+ (internal + swing)
• Multi-timeframe market structure scanner
• Premium | Discount | Equilibrium zones
• Volumetric Order Blocks with Buy/Sell Metrics
• Fair Value Gaps (FVG / VI / OG)
• Accumulation & Distribution zones
• Smart zone labeling (HH, HL, LL, LH)
• Trend clarity with MTF signals (15m, 1H, 4H, 1D)
• Ultra-light non-repainting logic
• Works on all timeframes
🎯 Designed for traders who want ultra-precise sniper entries with smart automation and clean visuals.
➡️ For subscription access, contact TradingView user: @Guardeerhelp

Noon Curve Box with Quadrants & 1st FVGOverview 📜
The Noon Curve Box with Quadrants & 1st FVG is a comprehensive analysis tool built for intraday traders. It automates the process of identifying and visualizing key time-based concepts popularized by ICT (Inner Circle Trader) and other price action methodologies.
While the concepts themselves are public, this script's value lies in its unique automation and clear presentation. It saves you the manual effort of marking session ranges, quadrants, and searching for critical imbalances every single day, allowing you to focus purely on execution.
Underlying Concepts Explained 🧠
This script is built on a few core price action principles:
Time-Based Profiling: The idea that different times of the trading day have different characteristics. The script visually separates the main session into 2-hour quadrants to help you track momentum shifts.
Fair Value Gaps (FVG): An FVG is a three-bar pattern that indicates a price imbalance or inefficiency. It's a foundational concept in many institutional trading methods.
A Bullish FVG (or BISI) forms when there is a gap between the first candle's high and the third candle's low:
Candle 1 HighCandle 3 High
"Silver Bullet" Time Windows: This indicator specifically targets the first FVG formed during the high-impact AM session (9:30-10:00 NY Time) and a corresponding PM session (13:30-14:00 NY Time), as these are often considered high-probability reversal or continuation zones.
Key Features & How It Works ✨
Automated Session Box: The script automatically draws a box around the high and low of your specified trading session (default is 8:00 AM - 4:00 PM New York time). This provides an instant view of the day's operating range.
Dynamic Quadrant Analysis: The session is automatically divided into 2-hour quadrants. Each box is colored based on its internal momentum (close vs. open), providing an at-a-glance summary of buying or selling pressure throughout the day.
Precision FVG Detection:
The script's core logic scans for the very first FVG within the AM (9:30-10:00) and PM (13:30-14:00) windows.
It identifies the exact 3-bar pattern and immediately draws a box marking the imbalance zone. Once the first FVG is found for a window, the script stops searching, ensuring your chart remains clean and focused on the most significant, initial imbalance.
The FVG boxes extend to the current bar, keeping these key levels of interest visible all day.
How to Use This Indicator 🎯
Context: Use the Session Box high and low as your primary intraday support and resistance levels.
Momentum: Use the Quadrant Box colors to gauge the flow of the market. A switch from red to green, for example, can signal a potential shift in control.
High-Probability Setups: The AM and PM First FVG boxes are your key points of interest. These imbalances often act as price magnets. Look for price to return to these zones to find potential entries, as they may act as support (bullish FVG) or resistance (bearish FVG).
Settings and Customization ⚙️
You have full control over all visual elements.
Session Control: Adjust the session time and timezone.
Visual Toggles: Enable or disable the Session Box, Quadrants, and AM/PM FVGs.
Color Customization: Match all elements to your personal chart theme.
History: Limit the number of historical FVG boxes displayed to keep your chart clean.

ICT PO3 Confluence Algo | Precision: NQ, SPX, BTC📌 ICT PO3 Confluence Algo | Precision: NQ, SPX, BTC
Welcome to the PO3 Confluence Algo, a structured Buy/Sell signal tool designed for NASDAQ 100 (NQ), S&P 500 (SPX), and Bitcoin (BTC).
This tool detects high-probability entries by aligning two PO3-based structural ranges:
🔹 729-point macro structure
🔸 243-point micro confirmation
Signals are only printed when both ranges align at engineered zones — helping reduce noise and isolate clean, rule-based setups.
🔍 How It Works
This indicator is built on a dual-fractal PO3 logic inspired by Goldbach-style structural models. It maps price reactions across levels such as:
RB (Range Base)
OB (Order Block)
FV (Fair Value)
EQ (Equilibrium)
These structural markers define potential entry and exit areas with improved signal timing and clarity.
🧩 Timeframes & Settings
✅ Use on:
5m–15m: Scalping / intraday sessions
30m–1H: Swing trading / macro structure
✅ Assets:
Optimized for NAS100, SPX500, and BTCUSD
Adaptable to any market respecting structured delivery
✅ Settings:
Choose between BUY/SELL labels or 🟢🔴 circle markers
Toggle Goldbach levels/zones
Adjust macro/micro PO3 ranges (default: 729 & 243)
🎯 Visual Chart Examples
These examples show PO3 confluence signals in action:
NAS100 – 15min
BTC – 30min
NAS100 – 5min
SPX – 1H
Full PO3 sweep
Use these to observe how the algo responds to PO3 alignment across different markets and timeframes.
RB, OB, FV, EQ, and more
These zones can help advanced users interpret how price interacts within structured ranges.
🟨 A secondary “special” signal style using yellow labels is also included as an optional setting. These can be turned off entirely if not required.
📊 Goldbach Visualization (Optional)
Traders may enable this mode in the settings to reveal PO3 structural zones like RB (Range Base), OB (Order Block), FV (Fair Value), EQ (Equilibrium), and more.
These overlays help clarify engineered reactions and high-interest areas in price structure.
🌟 What Makes It Unique
Multi-fractal PO3 alignment (rare in open-source scripts)
Structural logic based on engineered delivery ranges
Built for traders who prefer clean, rule-based confirmation
Adaptable to session trading, prop firm limits, and structured setups
🔐 Why Invite-Only?
This script uses a proprietary PO3 engine built from custom logic not found in public indicators. It's designed for advanced, structured execution and is protected to maintain its integrity.
⚠️ Disclaimer
This script is for educational purposes only.
It does not constitute financial advice or trading signals.
All trading involves risk. Use this tool only as part of a well-tested and structured trading plan.

Price Range Tracker by smaThis tool plots dynamic zones based on recent price extremes and midpoint levels. It tracks the highest, lowest, and average price over a customizable period, helping traders identify key reference zones for potential reaction or balance.
Each level is updated in real-time and displayed with optional percentage labels relative to the current price. The lines and label colors can be fully customized for visual clarity.
—
Note: The internal logic is proprietary and not publicly disclosed.

Deep Z pi SP MA + 2 CC + OB + CPR + last 5 MinThis script is a comprehensive price action and market structure analysis tool designed for intraday traders, particularly those focused on Nifty and derivatives. It combines multiple strategies and signals into a single, customizable indicator.
🔍 Features Included:
1. 📉 2-Consecutive Candle Logic (Strict Coloring)
Highlights strong bullish or bearish momentum using consecutive green/red candle logic.
Detects candles that close above the previous high or below the previous low.
2. 📍 Order Block (OB) Detection
Identifies large, impulsive reversal candles based on body size and wick breakout.
Labels the OB with a customizable tag and direction.
3. 📊 Central Pivot Range (CPR)
Plots daily CPR, along with yesterday’s R1 and S1 levels.
Detects and labels Narrow CPR Days (potential breakout setups).
4. 🔁 MA21 / MA50 Dynamic Crossover
Plots 21 and 50-period moving averages (SMA or EMA).
Fills background color between MAs to visually indicate trend direction.
Buy/Sell triangle signals on crossover events.
5. 📦 Last 5-Minute Box (Previous Day Close Range)
Highlights the last 5-minute candle of the previous day.
Colors the box based on how the market opens and closes relative to that range (breakout/rejection box logic).
6. 💡 Weak Candle Detection
Identifies weak candle patterns like Doji, Hammer, Inverted Hammer, Dragonfly, Gravestone, Hanging Man.
Applies a soft gray tone to visually de-emphasize indecision candles.
7. 💬 CPR-Based Options Strike Price Labels
Automatically calculates CE and PE strikes using Nifty Index spot CPR.
Displays Put, Call, and Exit strike levels at 9:15 AM.
8. 📘 Additional Strike Labels Based on Previous Day Range
Shows Buy CE strike (floored from previous Nifty spot High).
Shows Buy PE strike (ceiled from previous Nifty spot Low).
Useful for directional option strategies.
9. 🔴 One-Time Dot Signal for Rejection
Plots a small dot on the first 5-minute candle that:
Closes above the previous day’s high, or
Closes below the previous day’s low.
Only appears once per day to avoid clutter.

OPERATOR Option Trading IndicatorOption Trading Indicator Positional+Intraday v1.0
Developed by Bulls of Stockmarket+Option Engineer
How to apply:
Apply the indicator on chart and use liscense code = option
You can see this in settings of indicator after appying in chart. After liscence code is given the indicator will open.
Features:
1) Gives Buy and Sell signals for option buyer and option seller.
2) Also tracks FII and DII involvement in the option market only on option strike charts.
3) Tracks 2-4 months after market options for better signals and insights.
Timeframe= Only 1 day (1D) Timeframe
How to use:(For Option Buyers)
1) Keep watching Fii and DII buy in table. If both are in buy mode then be ready for buying that strike option.
2) Also simultaneosly keep seeing any buy signal generated below the candle or not.. If buy on chart is not generated then we dont have to buy.
3) In simple words . If FII Buy+ Dii Buy + BUY SIGNAL On Candle Chart then we have to buy that option.
4) Our sl is any candle closing below the green line in the chart, so the more good buy if (3) conditions is followed when price is near green line .
5) Target after bought as per (3) and (4) step will be Red line which has been ploted.
How to use:(For Option Sellers )
1) Keep watching the charts. See full ITM Options always(minimum 2 months after option)
2) If sell signal comes then sell with Sl as per your trading psychology and money management.
3) For this Target is not decided, But you will get atleast 100 points profit for sure.. Profit can be 500+ points also 70% Time.
If have doubt on how to trade using this indicator.... Feel free to contact me at
shaktiwithshivaeternal@gmail.com
OR
tradingoperatorperfect@gmail.com
Currently the indicator is free to use... Enjoy and keep supporting so that i can increase more features into it .

Elliott Wave - Complex Correction Pattern DetectorThis indicator is for Elliott Wave corrective patterns. It’s highly lagging, so just like with the impulse and terminal indicators, it’s intended purely for study and practice. I’m about a third of the way through the book right now, and my brain feels like it’s about to explode—😱but I have to say, this theory is incredibly fascinating.
As with the impulse and terminal indicators, this one is also pivot-based, so there are some obvious limitations in the results. Still, I believe that comparing my own manual counts with the rules programmed into the macro will be even more helpful for learning.
I hope that by sharing this, it can help students or beginners who are currently studying Elliott Wave theory. 😁

15min intervalsindicator displays 4 15 minute intervals within the hour. this simple indicator can be used for effective scalping.

4H CANDLES🕓 H4 Opening Candles – Pine Script v6
This indicator highlights only the very first candle that opens simultaneously with a new 4-hour (H4) candle, no matter which lower timeframe you're viewing (e.g., M1, M5, M15, M30, etc.).
🔍 Key Features:
Colors only the candles that mark the start of a new H4 session.
Leaves all other candles untouched – your chart style remains unchanged.
Great for identifying key H4 time anchors across any lower timeframe.
⚙️ Customization:
Adjustable candle color (body, wick, border).
Compatible with all chart intervals below 4H.
Fully timezone-independent – adapts to your TradingView settings automatically.
✅ Ideal for: time-based confluence zones, session-based strategies, or precise timing around key H4 opens.
💡 Pro tip: Combine this with support/resistance or momentum indicators for breakout or reversal trades.

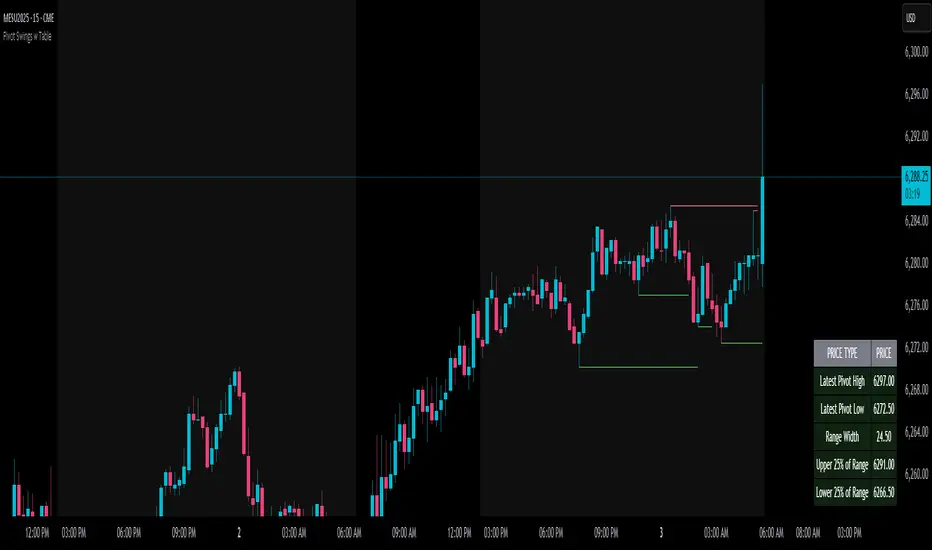
Pivot Swings w Table Pivot Swings w Table — Intraday Structure & Range Analyzer
This indicator identifies key pivot highs and lows on the chart and highlights market structure shifts using a real-time table display. It helps traders visually confirm potential trade setups by tracking unbroken swing points and measuring the range between the most recent pivots.
🔍 Features:
🔹 Automatic Pivot Detection using configurable left/right bar logic.
🔹 Unbroken Pivot Filtering — only pivots that haven't been invalidated by price are displayed.
🔹 Dynamic Range Table with:
Latest valid Pivot High and Pivot Low
Total Range Width
Upper & Lower 25% range thresholds (useful for value/imbalance analysis)
🔹 Trend-Based Color Coding — the table background changes based on which pivot (high or low) occurred more recently:
🟥 Red: Downward bias (last pivot was a lower high)
🟩 Green: Upward bias (last pivot was a higher low)
🔹 Optional extension of pivot levels to the right of the chart for support/resistance confluence.
⚙️ How to Use:
Adjust the Left Bars and Right Bars inputs to fine-tune how swings are defined.
Look for price reacting near the Upper or Lower 25% zones to anticipate mean reversion or breakout setups.
Use the trend color of the table to confirm directional bias, especially useful during consolidation or retracement periods.
💡 Best For:
Intraday or short-term swing traders
Traders who use market structure, support/resistance, or trend-based strategies
Those looking to avoid low-quality trades in tight ranges
✅ Built for overlay use on price charts
📈 Works on all symbols and timeframes
🧠 No repainting — pivots are confirmed with completed bars
Alpha Trader University - Market Structure AnalysisAlpha Trader University - Market Structure Analysis Indicator
EDUCATIONAL OVERVIEW:
This comprehensive indicator teaches traders professional market structure analysis through two proven methodologies: Fractal Analysis and Pivot Point Structure Tracking. Designed for educational purposes to help traders understand price action and market psychology.
CORE METHODOLOGY:
1. FRACTAL ANALYSIS (Bill Williams Approach):
- Identifies swing highs and lows using 3-bar or 5-bar patterns
- 3-bar fractals: More sensitive, catches smaller swings
- 5-bar fractals: More conservative, higher probability signals
- Visual markers help identify key support/resistance levels
2. MARKET STRUCTURE TRACKING:
- Automatically identifies Higher Highs (HH), Lower Highs (LH), Lower Lows (LL), Higher Lows (HL)
- Color-coded labels for easy trend identification
- Customizable pivot detection sensitivity
- Real-time structure classification
EDUCATIONAL VALUE:
- Learn to identify trend direction through structure analysis
- Understand the psychology behind market movements
- Develop skills in reading price action patterns
- Build foundation for advanced trading strategies
TRADING APPLICATIONS:
- Trend Identification: HH+HL = Uptrend, LH+LL = Downtrend
- Entry Timing: Enter after structure confirmation
- Stop Loss Placement: Use fractal levels for risk management
- Confluence Trading: Combine with other technical analysis tools
UNIQUE FEATURES:
- Dual analysis approach (Fractals + Structure)
- Educational tooltips and guidance
- Customizable sensitivity settings
- Professional color-coding system
- Clean, non-cluttered visual design
SETTINGS EXPLANATION:
- Fractal Sensitivity: Choose between 3-bar (sensitive) or 5-bar (conservative)
- Structure Labels: Toggle HH/LH/LL/HL display
- Pivot Settings: Adjust left/right bars for confirmation
- Color Customization: Personalize visual appearance
This indicator combines classical technical analysis principles with modern Pine Script efficiency, providing traders with essential market structure identification tools for educational and analytical purposes.
DISCLAIMER: This indicator is for educational purposes. Always combine with proper risk management and additional analysis before making trading decisions.

My Strategy: Uptrend Pullback ScreenerUptrend Pullback Screener. this will filter the stock who is in uptrend and ready to pullback from support.

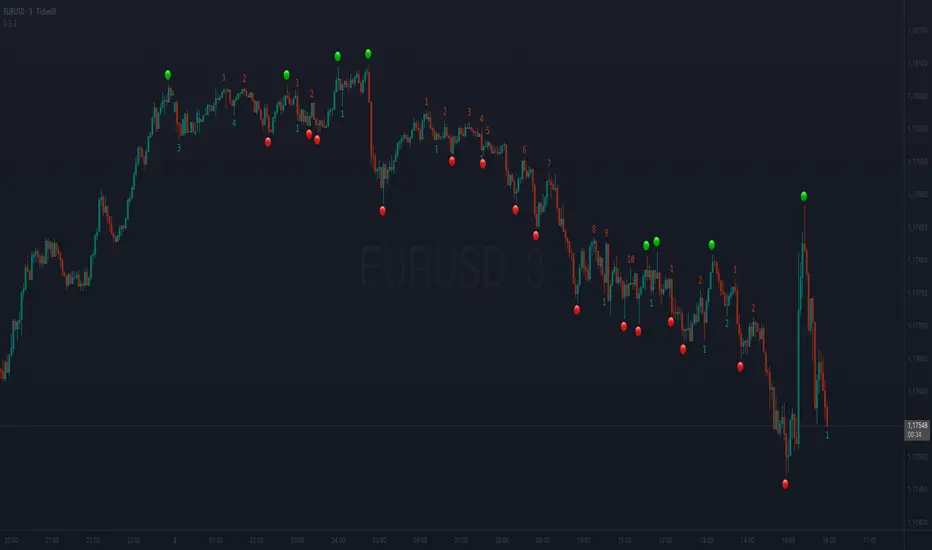
[eLm] 0-1-2# 📈 Market Structure Indicator – Counter System
This indicator dynamically analyzes price action to detect key market structure shifts and trend strength using four essential formations:
## 🔍 Detected Structures
- **Higher High (HH):** A candle forming a new high above recent peaks
- **Lower Low (LL):** A candle forming a new low below recent bottoms
- **Higher Low (HL):** A higher dip, indicating potential trend continuation
- **Lower High (LH):** A lower peak, signaling potential weakness
## 🧠 Structure Protection Logic
After a HH or LL is formed, if price does not breach that level within a user-defined number of candles, the level is considered **"protected."**
This provides insight into trend strength and market reaction.
## 🔢 HL / LH Counter System
- Each HL or LH increases a counter.
- A new HH or LL **resets** the corresponding counter to zero.
> This helps visualize how many consecutive HL or LH structures have occurred — useful for measuring trend momentum.
## 🎯 Use Cases
- Trend following and confirmation
- Early trend reversal detection
- Building structure-based trading strategies
- Understanding price behavior and market intent
---
> **Note:** This indicator does not provide financial advice. It is designed to support technical analysis with clear, structure-based visual signals.
Auto Trendlines [AlgoXcalibur]Effortlessly visualize trendlines.
This algorithm does more than just draw lines connecting structural swing points — it reveals dynamic support & resistance breakouts with clarity and precision while significantly reducing your workload compared to the hassle of manually drawing trendlines.
🧠 Algorithm Logic
This advanced Auto Trendlines indicator delivers clear market structure through an intelligent multi-fractal design, revealing useful swing structures in real time. For those seeking maximum awareness, the optional Micro Trendlines (Dotted) constantly monitors even the most recent and minor structural shifts — keeping you fully in tune with evolving market dynamics. A Break Detection Engine constantly monitors each trendline and provides instant visual feedback when structural integrity is lost: broken lines turn gray, stop extending, and remain visible to enhance clarity and situational awareness. The algorithm is carefully refined to prevent chart distortion commonly caused by forcing entire trendline structures into view — preserving a natural and accurate charting experience. To further ensure optimal readability, an integrated Clutter Control mechanism limits the number of visible trendlines — focusing attention only on the most relevant structures.
⚙️ User-Selectable Features
• Micro Trendlines (Dotted): Ultra-responsive short-term trendlines that react to even the smallest structural shifts — ideal for staying ahead of early trend changes.
• Broken Trendline Declutter: Enable to display only the most recent broken trendlines to simplify chart visuals and maintain clarity, or disable to analyze previous price action.
💡 Modern Innovation
Auto Trendline indicators are often inaccurate, clumsy, and rely on slow methods that fail to adapt. AlgoXcalibur’s Auto Trendline indicator takes a modern, refined approach — combining smart pivot logic for both speed and stability, dynamic break detection with clear visual cues, and displaying only the most relevant trendlines while prioritizing accuracy, preventing distortion, and reducing clutter — automatically.
🔐 To get access or learn more, visit the Author’s Instructions section.

Advanced Day Separator with Future ProjectionsThe general indicator works on historical data, meaning they develop after the fact. The same is for indicators that show day separation. I was always forced to manually draw in vertical lines for the upcoming week. This indicator I built solves that issue by projecting vertical day separations for the upcoming week. Enjoy! :-)

headmapOverview
Advanced Price-Action Zones is a comprehensive, professional-grade indicator designed to automatically map and visualize the most critical historical price levels on your chart. Moving beyond simple lines, it renders these levels as dynamic, semi-transparent zones, providing an intuitive 'heatmap' of significant support, resistance, and potential liquidity areas.
This tool is built for traders who demand a clean, data-rich chart that adapts in real-time to market movements, with a fully customizable interface for personal tuning.
Core Features
Automated Multi-Timeframe Analysis: Automatically plots the high and low of the previous Daily, Weekly, Monthly, and 12-Hour sessions, forming the backbone of your structural analysis.
Heatmap-Style Visualization: Levels are displayed as colored zones rather than simple lines. This allows you to instantly spot areas of confluence where multiple historical levels overlap, indicating stronger S/R.
Dynamic Daily Highlighting: The most recent previous day's high/low is shown in a primary color (default: yellow). As a new day begins, these zones automatically fade to a distinct historical color (default: grey), keeping your focus on the most relevant and recent price action.
Intraday Liquidity Targets: Temporary 12-hour zones are plotted with "L. Shorts" and "L. Longs" labels, highlighting potential short-term reversal areas or stop-run targets. These zones automatically expire to keep the chart clean.
Daily Range Context: A subtle background fill visualizes the entire range of the previous trading day, extending into the current session to provide immediate context for breakouts or range-bound behavior.
Toggleable Volume Data: Get deeper insights with floating labels showing the volume on the bar that created a key Daily, Weekly, or Monthly level. This feature can be turned on or off in the settings.
Full Customization: Every color for every zone type, background, and text element is fully adjustable via the indicator's input menu.
On-Chart Informative Legend: A clean legend in the top-right corner explains the color-coding and the implied importance of each timeframe.
How to Interpret the Visuals
High-Timeframe Levels (Monthly/Red, Weekly/Orange): Use these major zones to identify significant market turning points, high-probability reversal areas, and logical take-profit targets for swing trades.
Mid-Timeframe Levels (Daily): The yellow zones (most recent) represent the immediate battlefield. A decisive move beyond this area can set the tone for the session. The grey zones provide a historical map of prior daily structures.
Short-Timeframe Levels (12-Hour/Blue): Treat these as intraday targets. They often represent areas where stop-losses and liquidations might be clustered, making them magnets for price in the short term.
Disclaimer & Technical Notes
Disclaimer: This tool is for educational and analytical purposes only and does not constitute financial advice or trade signals. All trading involves significant risk.
Technical Note on lookahead: This indicator correctly uses lookahead = barmerge.lookahead_on when requesting higher-timeframe data. This is the standard, industry-accepted method to ensure that a completed historical value (e.g., the previous day's high) is plotted consistently and accurately across all chart timeframes. It does not "repaint" in the conventional sense of changing past signals, but rather ensures data stability.
This is a protected, closed-source script.

Liquidity Point LinesLiquidity Point Lines
The "Liquidity Point Lines" indicator helps traders identify potential areas of liquidity in the market by drawing lines at specific price levels where significant "liquidation events" may have occurred. These events are determined by analyzing the MACD Histogram and identifying pivot points that suggest strong movements, which are often associated with the flushing out of short or long positions.
How It Works
This indicator leverages the MACD Histogram to gauge the strength of price momentum. It then identifies pivot highs and lows within the MACD Histogram's values. When a significant pivot is detected, the indicator interprets this as a potential "liquidity point" — a price level where a substantial amount of buy or sell orders (often due to liquidations) may have been executed.
The indicator distinguishes between:
Shorts Liquidation Points (Resistance): These are identified when the MACD Histogram registers a pivot high, suggesting a strong upward movement that could have liquidated short positions. Lines are drawn at the high price of the bar where this pivot occurred.
Longs Liquidation Points (Support): Conversely, these are identified when the MACD Histogram registers a pivot low, indicating a strong downward movement that might have liquidated long positions. Lines are drawn at the low price of the bar where this pivot occurred.
Key Features and Settings
The "Liquidity Point Lines" indicator offers extensive customization to tailor its sensitivity and visual representation:
MACD Settings for Liquidity: Configure the underlying MACD calculation with adjustable Fast Length, Slow Length, Source, Signal Smoothing, and MA Types (SMA/EMA) for both the Oscillator and Signal Line.
Liquidity Points Settings:
Pivot Lookback Left/Right: Define the number of bars to look back on either side to identify a pivot in the MACD Histogram.
Dynamic Strength Thresholds: This powerful feature allows the indicator to dynamically calculate the significance of a liquidation event. When enabled, it uses the average absolute histogram value over a specified Dynamic Threshold Lookback Period and applies Small and Medium Threshold Factors to determine the strength (Small, Medium, or Large) of the liquidity point.
Fixed Strength Thresholds: If dynamic thresholds are disabled, you can set fixed numerical values for Small and Medium Histogram Thresholds to define the strength categories.
Color & Style Customization: Assign distinct colors for Small, Medium, and Large liquidation points, choose the Line Style (Solid, Dashed, Dotted), and set the Label Text Color.
Label X Offset (To Right): Adjust the horizontal position of the liquidity point labels on your chart.
Liquidity Points Management:
Max Active Liquidity Lines: Control the maximum number of liquidity lines displayed simultaneously on your chart. Older lines are automatically removed to maintain clarity, except for lines that have been "touched" (i.e., price has interacted with that liquidity level).
Visual Interpretation
Each liquidity line is colored according to the strength of the detected liquidation event, making it easy to visually assess the potential significance of the price level. Lines extend to the right, serving as ongoing reference points. When the price interacts with a liquidity line (i.e., "touches" it), the line and its corresponding label are removed, indicating that the liquidity at that level may have been absorbed.
This indicator can be a valuable tool for identifying potential support and resistance levels, understanding market reactions to "liquidation cascades," and informing your trading decisions.

Obsession.FX Sessions IndicatorSession & Fractal Structure Tool — for Market Phases and Microstructure Analysis
This script combines session timeframes with local fractal identification to help traders analyze market context and structural shifts. It is designed for those applying Smart Money Concepts, where precise session boundaries and reactions to key levels are critical.
Session Zones
The script visualizes the three main trading sessions: Asia, London, and New York. It helps to:
– identify active phases of market participation;
– track each session’s Highs and Lows;
– interpret price behavior in relation to intraday liquidity shifts.
Each session is fully customizable — including start/end time, background and border colors, and display style (box, high/low lines, filled zones).
Fractal Structure
Fractals are shown as local highs and lows, supporting:
– detection of BOS/CHOCH on lower timeframes;
– building A→B ranges for structural flow;
– confirming short-term directional changes.
The fractal algorithm is optimized for responsiveness and clarity, with no repainting and minimal delay.
Purpose and Usage
This tool is intended for contextual reading of price action: determining the active session and monitoring price behavior within its boundaries, with a focus on microstructural reactions. It supports building precise entry logic based on the interaction between session ranges and fractal structure.
Closed Source Justification
The script is closed-source due to its use of proprietary logic for fractal detection and session integration, developed as part of a private trading methodology not available in public libraries.

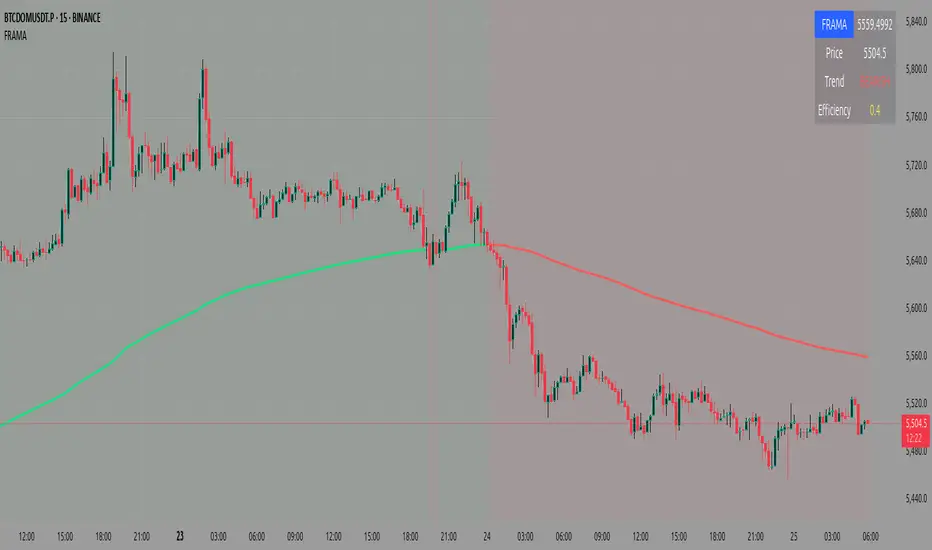
Fractal Adaptive Moving Average (FRAMA)Core Concept
Unlike traditional moving averages that use fixed smoothing factors, FRAMA adapts its responsiveness based on how "fractal" or chaotic the price movement is:
In trending markets (low fractal dimension), it becomes more responsive
In choppy/sideways markets (high fractal dimension), it becomes smoother
How It Works
1. Fractal Dimension Calculation:
Splits the lookback period into two halves
Calculates price ranges for each half and the total period
Uses logarithmic ratios to determine the fractal dimension (bounded between 1.0 and 2.0)
2. Dynamic Alpha Calculation:
Converts fractal dimension to a smoothing factor (alpha)
Higher fractal dimension = lower alpha = smoother average
Lower fractal dimension = higher alpha = more responsive average
3. Adaptive Smoothing:
Applies the calculated alpha to create the moving average
FRAMA = alpha × current_price + (1 - alpha) × previous_FRAMA
Key Parameters
Length (16): Lookback period for calculations
Fast Constant (4.0): Maximum responsiveness limit
Slow Constant (300.0): Minimum responsiveness limit
Visual Features
Line Color: Green when rising, red when falling
Background: Light green above FRAMA (bullish), light red below (bearish)
Information Table: Shows current FRAMA value, price, trend direction, and efficiency ratio
Close Price: Plotted as a semi-transparent white line for comparison
Trading Applications
FRAMA is particularly useful for:
Trend Following: More responsive in strong trends, less noisy in consolidations
Support/Resistance: Acts as dynamic support in uptrends, resistance in downtrends
Market Regime Detection: The efficiency ratio helps identify trending vs. ranging markets
Entry/Exit Signals: Crossovers and price position relative to FRAMA
The indicator automatically balances between being fast enough to catch trends early while being smooth enough to avoid false signals in choppy markets.
In this FRAMA script, fractal refers to measuring the complexity or "roughness" of price movements over time, not the self-similar geometric patterns we typically think of.
What the Script Measures
The script calculates a fractal dimension that quantifies how chaotic or smooth the price action is:
Low fractal dimension (closer to 1.0): Price moves in a relatively straight, trending manner
High fractal dimension (closer to 2.0): Price moves in a jagged, choppy, sideways manner.
The Logic
If the market is trending smoothly:
The sum of the two half-period ranges will be close to the total range
This gives a fractal dimension closer to 1.0
The indicator becomes more responsive (faster)
If the market is choppy/sideways:
The sum of the two half-period ranges will be much larger than the total range
This gives a fractal dimension closer to 2.0
The indicator becomes less responsive (smoother)
Practical Example
Imagine a 16-period lookback:
Trending market: Price goes from 100 → 116 steadily
Choppy market: Price bounces 100→108→102→114→106→116
The choppy market has a higher fractal dimension because there's more "path length" relative to the actual distance traveled.
Why This Matters
The fractal dimension becomes the adaptive mechanism that automatically adjusts the moving average's sensitivity based on current market conditions - making it faster in trends and smoother in consolidations.
what is efficiency that is shown in tables
The efficiency shown in the table measures how "efficient" or smooth the FRAMA line is compared to the actual price movement.
What It Means
Efficiency = FRAMA Movement ÷ Price Movement
Values close to 0: FRAMA is very smooth/stable while price is moving significantly
Values close to 1: FRAMA is moving almost as much as the price
Values > 1: FRAMA is moving more than the raw price (rare, usually in very short periods)
Practical Interpretation
Low Efficiency (0.1 - 0.3):
FRAMA is doing a good job of smoothing out noise
Market is likely choppy/sideways
The adaptive mechanism is working - keeping the average stable during consolidation
High Efficiency (0.7 - 1.0):
FRAMA is closely following price movements
Market is likely trending strongly
The adaptive mechanism is making the average more responsive
Medium Efficiency (0.3 - 0.7):
Balanced market conditions
FRAMA is providing moderate smoothing
Trading Context
This efficiency ratio helps you understand:
Market regime: Is this a trending or ranging market?
Signal quality: Low efficiency periods might produce fewer but higher-quality signals
Adaptive performance: How well the FRAMA is adapting to current conditions
For example, if you see efficiency at 0.15, it means the FRAMA moved only 15% as much as the price did in the last bar, indicating it's successfully filtering out noise in a choppy market. If efficiency is 0.85, the FRAMA is closely tracking price, suggesting a trending environment where you want the average to be responsive.
Previous Daily High/LowThe previous day’s high and low are critical price levels that traders use to identify potential support, resistance, and intraday trading opportunities. These levels represent the highest and lowest prices reached during the prior trading session and often act as reference points for future price action.
Why Are Previous Daily High/Low Important?
Support & Resistance Zones
The previous day’s low often acts as support (buyers defend this level).
The previous day’s high often acts as resistance (sellers defend this level).
Breakout Trading
A move above the previous high suggests bullish momentum.
A move below the previous low suggests bearish momentum.
Mean Reversion Trading
Traders fade moves toward these levels, expecting reversals.
Example: Buying near the previous low in an uptrend.
Institutional Order Flow
Market makers and algos often reference these levels for liquidity.
How to Use Previous Daily High/Low in Trading
1. Breakout Strategy
Long Entry: Price breaks & closes above previous high → bullish continuation.
Short Entry: Price breaks & closes below previous low → bearish continuation.
2. Reversal Strategy
Long at Previous Low: If price pulls back to the prior day’s low in an uptrend.
Short at Previous High: If price rallies to the prior day’s high in a downtrend.
3. Range-Bound Markets
Buy near previous low, sell near previous high if price oscillates between them.
Example Trade Setup
Scenario: Price opens near the previous day’s high.
Bullish Case: A breakout above it targets next resistance.
Bearish Case: Rejection at the high signals a pullback.

TIME-SPLT ACADEMY INDICATOR# TIME-SPLT ACADEMY CISD + FVG + TSM FRACTALS - Comprehensive Market Structure Analysis Tool
## Overview
This indicator combines three essential market structure analysis components into a unified trading tool: Change in State Direction (CISD), Fair Value Gaps (FVG), and TSM Fractals. This integration provides traders with a complete framework for identifying market structure breaks, price imbalances, and key pivot levels on any timeframe.
## Component 1: CISD (Change in State Direction)
**What it is:** CISD identifies significant breaks in market structure by tracking when price decisively breaks above previous swing highs (bullish CISD) or below previous swing lows (bearish CISD). This concept is fundamental to understanding trend changes and continuation patterns.
**How it works:**
- Monitors swing highs and lows using customizable pivot periods
- Tracks when price closes above a previous swing high (bullish structure break)
- Tracks when price closes below a previous swing low (bearish structure break)
- Draws horizontal lines from the pivot point to the break point with "CISD" labels
- Works on multiple timeframes simultaneously
**Trading Applications:**
- Identifies trend changes and continuation signals
- Provides entry signals on structure breaks
- Helps determine market bias and direction
## Component 2: FVG (Fair Value Gaps)
**What it is:** Fair Value Gaps are price imbalances that occur when there's a gap between the high of one candle and the low of another candle two periods later, with the middle candle not filling this gap. These represent areas where price moved inefficiently and often return to "fill" the gap.
**How it works:**
- Analyzes 3-candle patterns to identify gaps
- Bearish FVG: Gap between low and high where price dropped leaving unfilled space above
- Bullish FVG: Gap between high and low where price rose leaving unfilled space below
- Tracks 8 different candle body combinations for each direction (up, down, doji patterns)
- Monitors gap mitigation when price returns to fill the imbalance
- Changes color when gaps are partially or fully mitigated
**Gap Detection Logic:**
- Bearish FVG patterns: DDD, DDJ, JDD, UDJ, JDU, UDD, DDU, UDU
- Bullish FVG patterns: DUD, DUJ, JUD, UUJ, JUU, UUD, DUU, UUU
- (D=Down candle, U=Up candle, J=Doji candle)
**Trading Applications:**
- High-probability reversal zones when price returns to FVGs
- Support and resistance levels
- Target areas for limit orders
- Risk management reference points
## Component 3: TSM Fractals
**What it is:** TSM Fractals identify significant pivot highs and lows using Williams Fractal methodology. These mark potential reversal points and key support/resistance levels.
**How it works:**
- Identifies fractal highs: peaks where the center candle's high is higher than surrounding candles
- Identifies fractal lows: valleys where the center candle's low is lower than surrounding candles
- Uses customizable lookback periods (default 15) for fractal identification
- Displays horizontal lines with "$" symbols at fractal levels
- Maintains a configurable number of recent fractals on the chart
**Trading Applications:**
- Key support and resistance levels
- Potential reversal zones
- Confluence with other analysis tools
- Stop loss placement reference points
## Why This Combination Works
**Synergistic Analysis:** Each component provides different but complementary information:
1. **CISD** shows when market structure changes, indicating trend shifts or continuation
2. **FVGs** reveal where price has moved inefficiently and may return for rebalancing
3. **Fractals** highlight key pivot points that often act as support/resistance
**Trading Edge:** The combination allows for:
- **Entry Confirmation:** Wait for CISD breaks near unfilled FVGs at fractal levels
- **Risk Management:** Use FVG boundaries and fractal levels for stop placement
- **Target Selection:** Project moves to opposite FVGs or fractal levels
- **Market Context:** Understand whether you're trading with or against structure
## Key Features
**Multi-Timeframe CISD:**
- Customizable timeframe settings (Minute, Hour, Day, Week, Month)
- Adjustable swing length for pivot identification
- Customizable line styles, widths, and colors
- Optional alerts on structure breaks
**Advanced FVG Management:**
- Automatic gap size filtering
- Real-time mitigation tracking
- Color-coded active vs. mitigated gaps
- Optional pip value labels
- Large gap alerts for significant imbalances
**Intelligent Fractal Display:**
- Configurable fractal periods
- Maximum fractal count management
- Clean visual presentation
- Historical fractal preservation
## Settings & Customization
**CISD Settings:**
- Timeframe selection and multipliers
- Swing length adjustment (default 7)
- Line styling options
- Color customization for bullish/bearish breaks
- Alert toggle options
**FVG Settings:**
- Show/hide toggles for each direction
- Minimum gap size filtering
- Alert threshold for large gaps
- Color schemes for active and mitigated gaps
- Optional size labels in pips
**Fractal Settings:**
- Fractal period adjustment (default 15)
- Maximum display count (default 10)
- Show/hide toggle
## Educational Value
This indicator teaches traders to:
- Understand market structure concepts
- Recognize price inefficiencies
- Identify key pivot points
- Combine multiple analysis methods
- Develop systematic trading approaches
## Use Cases
**Swing Trading:** Identify major structure breaks with FVG confluence
**Day Trading:** Use lower timeframe CISDs with intraday FVGs
**Scalping:** Quick entries at FVG mitigation near fractal levels
**Position Trading:** Higher timeframe structure analysis with major FVGs
## Technical Implementation
- Utilizes Pine Script v6 for optimal performance
- Efficient array management for historical data
- Real-time calculations without repainting
- Memory-optimized box and line management
- Multi-timeframe data handling with proper security functions
This comprehensive tool eliminates the need for multiple separate indicators, providing everything needed for complete market structure analysis in one cohesive package. The educational component helps traders understand not just what the signals are, but why they work and how to use them effectively in different market conditions.
