Institutional Behavior AnalyticsJapanese below / 日本語説明は下記
■Summary
This indicator provides analysis on institutional investors/traders’ behavior by discovering and interpreting patterns of CFTC positions and price action in order to help users follow market directions that maker makers create and make decisions.
■What can we do with this indicator?
●Display institutional investors/traders’ position(CFTC COT position)
●Analyze institutional investors/traders’ behavior
Analyze institutional investors’ behavior from CFTC position data and price action and patternize the movement where strong buying/selling pressures are indicated
●Notify institutional investors’ behavioral changes with signals and alerts
In case strong buying/selling pressures detected, signals will be displayed along with the factors by which the behavioral changes identified. Alerts can be set with the same condition as signals.
■Why is it important to analyze institutional investors/traders behavior?
Financial markets are created by institutional investors/traders aka market makers. Analyzing their behavior and knowing where they are heading are chances for retail traders for trend trading.
■Functions
There is three core functions in this indicator.
1. CFTC COT Positions
2. Institutional Behavior Analysis
3. Alert
■Function Details:
1. CFTC COT Positions
1-1. CFTC COT Position
This indicator shows COT(Commitment of Traders) positions provided by CFTC with selection of legacy format and new format.
Users also can select position type from Futures only and Futures and Options.
Data source is quandle.com
The indicator shows the data of the assets listed below based on the code and the ticker code of which users open charts.
This is upgrade functions of CFTC Positions by COT Report(Legacy and New Format) Indicator which I previously released by adding more assets and new functions; (1)manual CFTC code entry, (2)display of changes from previous week and (3) Auto-identification of peak position level (see below)
CFTC Positions by COT Report(Legacy and New Format)
Indices:
Dow Jones Industrial Average / CFTC code:12460P / when DJI/US30 open
S&P 500 STOCK INDEX / CFTC code:13874P / when SPX / SPX500USD /US500 open
NASDAQ-100 STOCK INDEX / CFTC code:20974P / when NDX/US100 open
E-MINI Russel2000 INDEX / CFTC code:239742 / when RUT/US2000 open
NIKKEI STOCK AVERAGE / CFTC code:240741 / when NI225 / JP225USD open
Currencies:
EURO / CFTC code:099741 / when EURUSD open
Japanese Yen / CFTC code:097741 / when USDJPY open
British Pound / CFTC code:096742 / when GBPUSD or EURGBP open
Australian Dollars / CFTC code:232741 / when AUDUSD open
New Zealand Dollars / CFTC code:112741 / when NZDUSD open
Canadian Dollars / CFTC code:090741 / when USDCAD open
Swiss Franc / CFTC code:092741 / when USDCHF open
Commodities:
USOIL / CFTC code:067411 / when USOIL open
Brent oil / CFTC code:06765T / when UKOIL open
GOLD / CFTC code:088691 / when GOLD or XAUUSD open
Silver / CFTC code:084691 / when SILVER or XAGUSD open
Platinum / CFTC code:076651 / when PLATINUM or XPTUSD open
Palladium / CFTC code:075651 / when PALLADIUM or XPDUSD open
Copper(Grade#1) / CFTC code:085692 / HG1! or HG2! Open
Natural Gas(Henry Hub) / CFTC code:023391 / when NATURALGAS open)
Corn / CFTC code:002602 / ZC1! Or ZC2! Open
Cryptos:
Bitcoin / CFTC code:133741 / when BTCUSD open
Ether / CFTC code:146021 / when ETHUSD open
Data to be displayed:
Legacy format:
1. Open Interest
2. Non Commercial Long
3. Non Commercial Short
4. Non Commercial Net Positions (calculated by 2 and 3)
5. Non Commercial Spreads
6. Commercial Long
7. Commercial Short
8. Commercial Net Positions(calculated by 6 and 7)
9. Total Long
10. Total Short
11. Non Reportable Positions Long
12. Non Reportable Positions Short
13. Non Reportable Net Positions(calculated by 11 and 12)
New format:
1. Open Interest
2. Producer/Merchant/Processor/User Longs
3. Producer/Merchant/Processor/User Shorts
4. Producer/Merchant/Processor/User Net Positions(calculated by 2 and 3)
5. Swap Dealer Longs
6. Swap Dealer Shorts
7. Swap Dealer Net Positions(calculated by 5 and 6)
8. Swap Dealer Spreads
9. Money Manager Longs
10. Money Manager Shorts
11. Money Manager Net Positions(calculated by 9 and 10)
12. Money Manager Spreads
13. Other Reportable Longs
14. Other Reportable Shorts
15. Other Reportable Net Positions(calculated by 13 and 14)
16. Other Reportable Spreads
17. Total Reportable Longs
18. Total Reportable Shorts
19. Non Reportable Longs
20. Non Reportable Shorts
21. Non Reportable Net Positions(calculated by 19 and 20)
Sample chart
Colors and chart type are configurable.
❶.Non commercial long(green)/short(purple)/net(blue) position
❷.All data in legacy format
❸. All net positions in new format
1-2 Manual CFTC code entry
Besides the assets above, users now can enter CFTC code manually when they want to specify CFTC code regardless of charts they are opening and see other assets' COT position data.
1-3 Changes from previous week
Changes from previous week are displayed as text for Open interest, Non Commercial Long/Short/Net positions.
1-4 Auto-identification of peak position level in past N week
By specifying number of weeks(=N), the indicator automatically identify highest position level in the past N weeks for Non-commercial long and short positions.
By knowing this, users can prepare for trend reversal possibilities.
Sample chart
2. Institutional Behavior Analysis
This indicator detects institutional behavior changes based on changes of positions and price action and then categorizes them into patterns where strong buying/selling pressures of institutional investors are indicated.
Once the patterns identified, those will be displayed as signals and also it plots the factors in text by which the patterns are identified in order to support users’ decision making.
Sample chart
What makes indicator suggest institutional investors’ strong buy/sell will be remarked in the bottom right corner.
Please be noted that this function works on weekly timeframe only as institutional investors positions are updated on weekly basis by CFTC.
3. Alert
Alerts can be set with the same condition as signals so that users do not miss indicated strong buying/selling pressure of institutional investors.
■What timeframe/trading style is this indicator for?
As CFTC position updated on weekly basis, weekly, daily and 4H timeframes are most appropriate hence swing trading and day trading is best fitting trading style.
Scalping? Possible but why would we aim such small movement, knowing the directions that institutional investors are going to which could lead to big trends.
---------------------------------------------------
■サマリー
機関投資家の建玉とプライスアクションに基づいて機関投資家の行動分析を提供するインジケーターです。
機関投資家の強い買い圧力、売り圧力が示唆されるケースをその構成要素と共にパターン分類。
マーケットメーカーの作り出す相場の方向性に追従しやすくなるように、ユーザーの意思決定を支援します。
■このインジケーターでできること
●CFTC建玉の分析
CFTC(アメリカ商品先物取引委員会)が公開するCOT(Commitment of Traders)レポートに基づき機関投資家や商業筋の建玉データを分析することができます。
●機関投資家の行動分析
建玉データと値動きから機関投資家の行動を分析することが可能です。
インジケーターは建玉データとプライスアクションを基に機関投資家の強い買い圧力、売り圧力が示唆されるケースをその構成要素と共にパターン分類します。
●機関投資家の行動変化をシグナルとアラートで通知
機関投資家の強い買い圧力、売り圧力が検知された場合、その構成要素と共にシグナルを表示します。またシグナル表示のタイミングでアラート設定することも可能です。
■なぜ機関投資家の建玉や行動を分析することが重要なのか?
相場はマーケットメーカーと呼ばれる機関投資家によって作られています。
彼らのポジション状況や行動を分析し、彼らがどの方向に進んでいるのかを知ることは、個人投資家にとってトレンドフォローでトレードする機会、特に大きなトレンドに乗る機会を見出すことに繋がります。
機能
このインジケーターには主に3つの機能が搭載されています。
1. CFTC建玉データの表示
2. 機関投資家の行動分析
3. アラート
1. CFTC建玉データの表示
1-1. CFTC建玉データの表示
COTレポートが提供するCFTC建玉をサブウィンドウに表示することができます。
データレイアウトについては、レガシーフォーマットと新フォーマットの二つのレポートフォーマットを選択可能です。
またポジション種類として先物のみを表示するか、先物とオプションを含んだポジションを表示するかの選択も可能です。
インジケーターが表示する対象の資産と該当のCFTCコード、どのティッカーコードのチャートで表示されるかは以下の通りです。(データソースはquandle.com)
この機能は以前リリースしたCFTC Positions by COT Report(Legacy and New Format) Indicatorのアップグレードバージョン機能です。
対象データが追加されている他、新機能として(1)マニュアルでのCFTCコード指定、(2)前週比の表示、(3)過去のピークポジションのレベルライン自動描画が追加されています。
(詳細は下記)
CFTC Positions by COT Report(Legacy and New Format)
株価インデックス:
ダウ工業平均 / CFTC code:12460P / DJI/US30 を開いたとき
S&P500 / CFTC code:13874P / SPX / SPX500USD /US500
ナスダック100指数 / CFTC code:20974P / NDX/US100
E-MINI ラッセル2000指数 / CFTC code:239742 / RUT/US2000
日経平均 / CFTC code:240741 / NI225 / JP225USD
通貨:
ユーロ / CFTC code:099741 / EURUSDを開いた時
円 / CFTC code:097741 / USDJPY
ポンド / CFTC code:096742 / GBPUSD または EURGBP
豪ドル / CFTC code:232741 / AUDUSD
ニュージーランドドル / CFTC code:112741 / NZDUSD
カナダドル / CFTC code:090741 / USDCAD
スイスフラン / CFTC code:092741 / USDCHF
コモディティ:
WTI原油 / CFTC code:067411 / USOIL
北海ブレント原油 / CFTC code:06765T / UKOIL
ゴールド / CFTC code:088691 / GOLD または XAUUSD
シルバー / CFTC code:084691 / SILVER または XAGUSD
プラチナ / CFTC code:076651 / PLATINUM または XPTUSD
パラジウム / CFTC code:075651 / PALLADIUM または XPDUSD
銅(Grade#1) / CFTC code:085692 / HG1! または HG2!
天然ガス(Henry Hub) / CFTC code:023391 / NATURALGAS
コーン / CFTC code:002602 / ZC1! または ZC2!
暗号資産:
ビットコイン / CFTC code:133741 / BTCUSD
イーサ / CFTC code:146021 / ETHUSD
表示されるデータ:
レガシーフォーマット(一般的によく見るのはこのフォーマットです。)
1. Open Interest
2. Non Commercial Long
3. Non Commercial Short
4. Non Commercial Net Positions (calculated by 2 and 3)
5. Non Commercial Spreads
6. Commercial Long
7. Commercial Short
8. Commercial Net Positions (calculated by 6 and 7)
9. Total Long
10. Total Short
11. Non Reportable Positions Long
12. Non Reportable Positions Short
13. Non Reportable Net Positions(calculated by 11 and 12)
新フォーマット:
1. Open Interest
2. Producer/Merchant/Processor/User Longs
3. Producer/Merchant/Processor/User Shorts
4. Producer/Merchant/Processor/User Net Positions(calculated by 2 and 3)
5. Swap Dealer Longs
6. Swap Dealer Shorts
7. Swap Dealer Net Positions(calculated by 5 and 6)
8. Swap Dealer Spreads
9. Money Manager Longs
10. Money Manager Shorts
11. Money Manager Net Positions(calculated by 9 and 10)
12. Money Manager Spreads
13. Other Reportable Longs
14. Other Reportable Shorts
15. Other Reportable Net Positions(calculated by 13 and 14)
16. Other Reportable Spreads
17. Total Reportable Longs
18. Total Reportable Shorts
19. Non Reportable Longs
20. Non Reportable Shorts
21. Non Reportable Net Positions(calculated by 19 and 20)
サンプルチャート:
色とグラフ/線種は変更可能です。
❶.Non commercial(いわゆる投機筋)のポジション: ロング(緑)/ショート(紫)/ネット(青)
❷.レガシーフォーマットの全データ出力
❸. 新フォーマットで提供される全てのネットポジション
1-2 CFTCコードのマニュアル入力
上記のアセットに加え、任意のCFTCコードを指定して建玉データを表示することができます。
現在開いているチャートに関係なく、特定のアセットの建玉を確認したい時、他のアセットの建玉との相関を見るときに活用できます。
1-3 前週比の表示
Open Interest, Non Commercial(投機筋)のLong/Short/Netについて、前週比を表示します。
1-4. 過去N週間における建玉のピークを自動表示
過去N週間(Nはパラメータ設定)におけるNon Commercial(投機筋)のロング·ショートポジションのピークを自動で表示します。
過去の建玉のピークを知ることで、建玉が再びそのラインに接近した時のトレンド転換の可能性に備えることが可能です。
サンプルチャート
2. 機関投資家の行動分析
この機能では建玉の変化とプライスアクションから機関投資家の行動変化を検知し、機関投資家の強い買い、売りの存在が示唆されるケースをパターン分類します。
パターンが特定されたタイミングでシグナル表示するとともに、パターンを構成する要素(何を以て機関投資家の強い買い/売りの存在を判断したか)をテキストで表示することでユーザーの意思決定を支援します。
サンプルチャート
インジケーターが機関投資家の強い買い·売りの存在が示唆されると判断した要素がサブウィンドウの右下に記載されます。
この機能は週足でのみ有効です。
3. アラート
上記2のシグナルが表示されるタイミングでアラートを設定することができます。
機関投資家の強い買い·売りを検知したタイミングを逃さないよう活用してください。
■このインジケーターが適しているタイムフレーム
CFTCのポジションが週次で更新されることから、長めの時間軸である週足、日足から4時間足くらいまでが適しています。
トレードスタイルとしては、機関投資家が作る大きなトレンドに追尾するスイングトレードが最も適していると考えますが、デイトレードにも使えます。
Institutional

Key Levels (Time Frames - Weekly,Monthly,Quarterly,Yearly)This indicator plots the 4h, Daily, Weekly, Monthly, Quarterly, Yearly Open High, Low and Mids.
You can watch how these institutional trading levels work as support and resistance.
Most Important you can add alerts to these levels with a few clicks.
Just add/remove unnecessary levels for scaling problems.
For any error/suggestion/improvement just let me know.

[astropark] Kill ZonesDear Followers,
today I'm glad to present you an indicator which highlights for you the most important market Kill Zones .
This indicator will color background of the time sessions when Asia, London and New York sessions are going to be most active .
This way you can understand easier what istitutions and big hedge funds made during the session.
You can change colors and transparency in the indicator options, default colors are yellow for Asia, blue for London and red for New York sessions.
You can enable the indicator to show background also during the weekend (disabled by default).
This indicator works on all markets, I suggest not to use it above 1h timeframe, 5m-15m is great.
This is a premium indicator , so send me a private message in order to get access to this script.

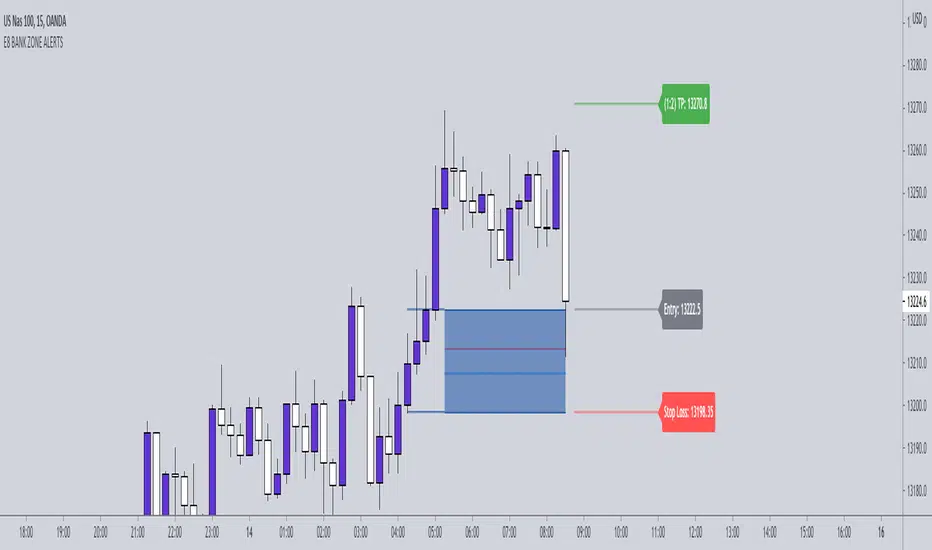
E8-BANK ZONES 4.0 THE E8- BANK ZONES will highlight the most accurate zones the market has to offer.
SETTINGS:
Remove uncheck CHARS - this feature simply places a star on high momentum candles to help identify strong momentum bullish and bearish candles.
INPUT:
You have the ability to choose which zones to display. Our recommendation is to activate continuation zones when price is trending and reversal zones when price is at key level/ strong support and resistance areas.
CONTINUATION ZONES
REVERSAL ZONES
FLIP ZONES
Institutional PivotsToday I propose a novel idea of plotting pivots, this can be also considered as Value areas/Noise areas.
*What is it?
Its a simple concept of gauging price action with respect to its most time spent in a particular range, this is usually denoted as Value area in the Market profile concept, where that "most" word is represented by 70% of the price action.
*What's different from the Market Profile?
Market profile is dependent on real time price movement to complete to see the value area or noise area to plot a static area, there is always a possibility of it shifting as price may move outside of it, and hence its called "developing value area", till of course session is closed and plot is finalized.
While that method is solid indication of "actual price profile" development, it lacks when it comes to offering traders a more stable view to enable them to make decisions. And therefor, when traders trade MP they are usually limited by the number of trades they can take.
This is the main reason as to why traders prefer to use other methods like Pivots/ORB/Range-breakouts over pure MP charts, even though latter reduces the possibility of wrong estimations of "support/resistance working/holding".
*Why the name Institutional Pivots?
In my research I've found that these Pivots/Value area/Noise area ranges are often the areas watched by the big players who trade breakouts or mean reversion strategies, so while that name may sound dubiously clickbaity, it is indeed intended to represent an observation. I know how that sounds, but you can choose to ignore it if you do not agree or see good results after using it. After all, its free to use for everyone.
*Nomenclature/colors and settings?
Noise area/Value area/Central Pivot area - Designated with Yellow labels, in which NU represents the Upper level and ND represents the Lower level
Targets - Target calculation mechanism is based on " today's price action" and today's Open, D1 and D2 represent down targets for the day and U1 and U2 represent upper targets. Please note that this is independent of the "Noise area/Value area/Central Pivot area", so overlap of levels is possible. AND if overlap happens, that's an indication of more strength at S/R line/area for the price.
One more thing to note here is that if there is formation of the new low or new high in the day, those levels will change as their calculation gets influenced by the same. This is NOT a repaint issue, this is SHIFT/FORMATION OF THE NEW levels and it's an "intended" behavior.
Open and POpen - Open represents open of the time-frame selected and POpen represents previous open of the time-frame.
Lable's starting with "H" are indicating higher Timeframe levels, levels which are same as above.
ATR based targets - When you enable this in settings, you will get target calculation based on ATR (self explanatory)
Full ATR mode - When you enable this option, you will get both Noise area as well as targets based on ATR, please don't forgot to turn off the ATR based targets when you enable this, as they conflict with each other.
I've not kept lines, area plots or even price levels as I feel it's just noise and takes away from the indicators main focus, please don't ask to add them, I'll not.
This is meant as purely educational idea, if you use this to trade, it is at your discretion and responsibility will be yours alone.
Past performance is not assurance of the future performance.
More example chart/s

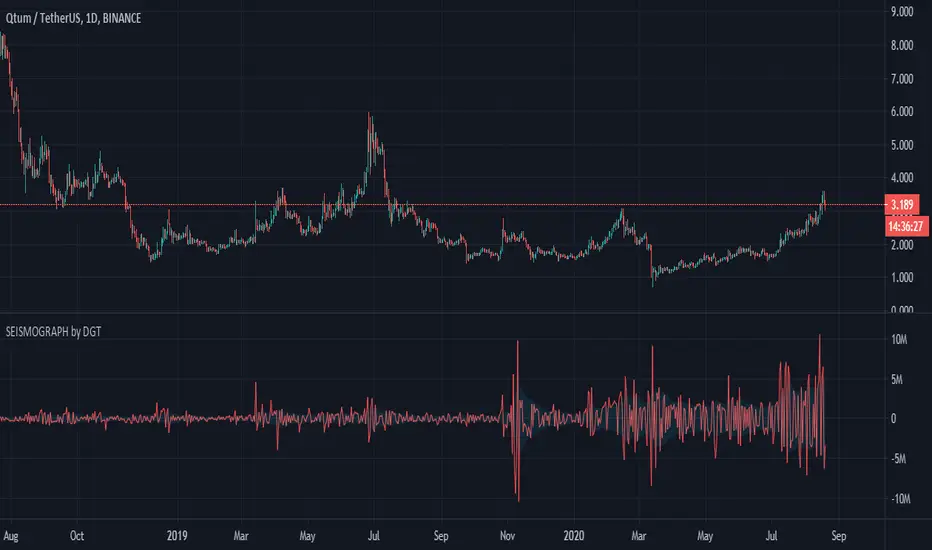
Earthquake Effect by DGTInstitutional investors have a profound impact on financial instruments prices because of the large volume, and their trading activities can greatly impact the price of financial instruments. They sometimes may split trades over time in order to not make a material impact and of course not to decrease liquidity to the point where there may be no one to take the other side of the trade.
Institutional investors (Smart Money) may create an Elephant Effect on the prices of financial instruments, and this study aims to display by emphasizing high volume changes
In the memory of the North Anatolian Earthquake that struck on August 17, 1999, that we remember with pain today, and similarities of plotting outcomes to seismograph plotting I preferred to name this study as Earthquake Effect (SEISMOGRAPH)
Disclaimer:
Trading success is all about following your trading strategy and the indicators should fit within your trading strategy, and not to be traded upon solely
The script is for informational and educational purposes only. Use of the script does not constitute professional and/or financial advice. You alone have the sole responsibility of evaluating the script output and risks associated with the use of the script. In exchange for using the script, you agree not to hold dgtrd TradingView user liable for any possible claim for damages arising from any decision you make based on use of the script
🐳 Whales 🆚 Little Fish 🐟THIS INDICATOR DETERMINES WHAT THE STRONG HANDS AND WEAK HANDS ARE DOING, BASED ON THE FAMOUS INDICATOR "KONCORDE", OBTAINED FROM THE PERCENTARY VARIATION OF THE INDICATOR IVP (POSITIVE VOLUME INDEX) AND IVN (VOLUME INDEX). ANYONE READING THE AVAILABLE DOCUMENTATION ON THESE TWO SMALL MATHEMATICAL JEWELRY WILL DISCOVER THAT THE ATTRIBUTED VOLUMES NEGOTIATED TO STRONG HANDS (IVN) OR WEAK HANDS (IVP).
NOTE: USE THIS INDICATOR ONLY IN INSTRUMENTS WITH REAL VOLUME.

Ultimate BiasThis indicator is meant to be used by our private trading group.
It allows you to plot complex Market Bias criteria, and it generates a context for the market state and fires Entry/Exit signals.
It includes customized alerts to ease its use in algo trading.

Ultimate TRI MAsThis is a helper tool to get deeper into TRI's Moving Average Studies.
The indicator allows for:
Show/Hide all MAs
Show/Hide each one of the MAs
Label the MAs for quicker identification
Select Bias Mode: Institutional or Brian's
Draw a Cloud based on Bias Mode
Highlight Crosses based on Bias Mode
Color the Background based on Bias Mode
Show/Hide the Cloud, the Crosses and the Background
Hope you find it useful!
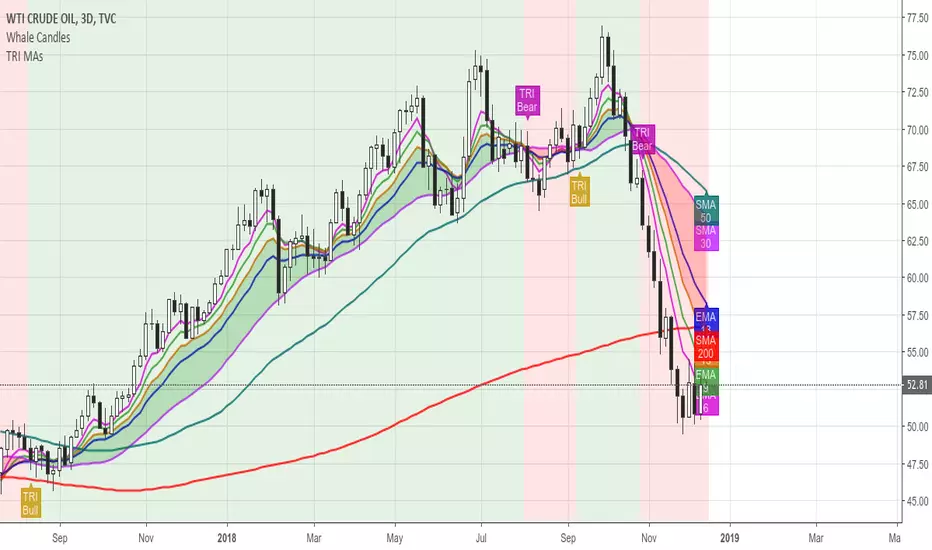
Institutional BiasShows what we at TRI call the institutional bias, i.e. a bull bias when 9 ema is above 18 ema and a bear bias when the 9 ema is below the 18 ema.
Plots the 9 and 18 ema, and fills the background green when the institutional bias is bullish and red when it is bearish.

Commitment of Traders (COT) NonCom with Average (by Lowphat)Commitment of Traders Non Commercial with Trailing Average
