Majors Rotation System [BackQuant]Majors Rotation System
Introducing BackQuant's Majors Rotation System, a comprehensive portfolio management tool for rotating among the major cryptocurrencies—BTC, ETH, and SOL. This system is designed to optimize returns by selecting the strongest-performing asset while avoiding periods of market weakness. It employs a long and cash-only strategy, meaning the system will only hold positions when market conditions are favorable, and will stay in cash during downtrends. Additionally, it incorporates a powerful regime filter to ensure the system is inactive during market-wide downturns.
This script is ideal for crypto traders looking to improve performance by dynamically allocating capital based on real-time performance metrics, rather than relying on a simple buy-and-hold strategy.
Key Features
Dynamic Asset Rotation: The system constantly evaluates the performance of BTC, ETH, and SOL, selecting the strongest asset based on a ratio matrix. This matrix compares the relative strength of each asset to one another, ensuring that your portfolio is always positioned in the cryptocurrency with the most momentum.
Long and Cash-Only Portfolio: This system only takes long positions or remains in cash. By avoiding short positions, it reduces exposure during market downturns. The built-in regime filter ensures the system only operates when the broader market (represented by the TOTAL crypto market cap) is trending up, offering additional protection against unfavorable market conditions.
Equity Tracking: The script provides a real-time visualization of portfolio equity compared to a buy-and-hold strategy. It displays the equity curve of the portfolio while allowing you to compare it against the hypothetical equity of holding BTC, ETH, or SOL individually (Buy and Hold).
Performance Metrics: In addition to equity visualization, the system provides detailed performance metrics, including:
Sharpe Ratio: Measures risk-adjusted returns.
Sortino Ratio: Focuses on downside risk.
Omega Ratio: Evaluates returns relative to risk.
Maximum Drawdown: The maximum observed loss from a peak to a trough.
These metrics allow traders to assess the efficiency of the rotation system compared to simply holding assets.
Visual Cues:
Painted Candles: The script provides a visual trend indicator by painting candles according to the trend of the selected chart, helping traders quickly identify momentum shifts.
Support for Multiple Assets: The system allows users to toggle between BTC, ETH, and SOL or view the entire portfolio at once. It displays key metrics for each asset and offers an intuitive way to understand which asset is currently outperforming.
Regime Filter: A key aspect of this system is the regime filter, which only allows trading in favorable market conditions. It uses a Universal TPI (Trend Performance Indicator) to evaluate whether the overall crypto market (TOTAL Market Cap) and key assets (BTC, ETH) are in a bullish trend. If the market is in a downtrend, the system will exit positions and move into cash.
Customizable Parameters: Users can customize several important aspects of the system:
Starting Date: Choose when the backtest or live trading begins.
Starting Capital: Set the initial capital for backtesting purposes.
Visualization Options: Toggle between base data, ratioed data, and equity plots. Users can also customize the line width and color settings for better chart clarity.
Adaptive Momentum Scoring: The system uses advanced indicators, which are not disclosed (proprietary) to assess the trend and momentum of the selected cryptocurrencies dynamically.
How the Rotation Works
The system uses a universal algorithm to calculate trend and momentum signals for BTC, ETH, and SOL. These signals are processed through a ratio matrix, which compares the performance of each asset against the others. Based on this comparison, the system identifies the strongest asset and allocates capital accordingly.
BTC, ETH, and SOL Scores: These scores represent the relative strength of each asset based on the universal algorithm. The system dynamically selects the asset with the highest score, rotating out of underperforming assets and into the top performer.
Allocation Decisions: The system determines whether to allocate capital to BTC, ETH, SOL, or Cash based on the scores. If none of the assets show strength, the system defaults to cash to protect the portfolio from market downturns.
Equity and Buy-and-Hold Comparisons
This script provides a side-by-side comparison of the portfolio’s equity curve and a buy-and-hold strategy:
Portfolio Equity: Shows the performance of the system as it rotates between BTC, ETH, and SOL.
Buy-and-Hold Equity: Displays how the portfolio would have performed if you simply held BTC, ETH, or SOL without trading.
These comparisons allow traders to see how the dynamic rotation system performs relative to a passive holding strategy.
Alerts and Visual Feedback
The system provides real-time alerts when asset allocations change, notifying traders when the system moves capital between assets or into cash. Additionally, the system offers detailed visual feedback, including:
Equity Curve Plots: Displays the equity curve of the portfolio and the individual assets.
Score Labels: Shows the strength scores for BTC, ETH, and SOL directly on the chart for easy monitoring.
Final Thoughts
The Majors Rotation System offers a powerful way to navigate the highly volatile crypto market by rotating between the strongest performing assets and staying in cash when conditions are unfavorable. With its advanced metrics, equity tracking, and built-in regime filter, this system is designed to optimize returns while minimizing risk.
Matrix

Autotable█ OVERVIEW
The library allows to automatically draw a table based on a string or float matrix (or both) controlling all of the parameters of the table (including merging cells) with parameter matrices (like, e.g. matrix of cell colors).
All things you would normally do with table.new() and table.cell() are now possible using respective parameters of library's main function, autotable() (as explained further below).
Headers can be supplied as arrays.
Merging of the cells is controlled with a special matrix of "L" and "U" values which instruct a cell to merged with the cell to the left or upwards (please see examples in the script and in this description).
█ USAGE EXAMPLES
The simplest and most straightforward:
mxF = matrix.new(3,3, 3.14)
mxF.autotable(bgcolor = color.rgb(249, 209, 29)) // displays float matrix as a table in the top right corner with defalult settings
mxS = matrix.new(3,3,"PI")
// displays string matrix as a table in the top right corner with defalult settings
mxS.autotable(Ypos = "bottom", Xpos = "right", bgcolor = #b4d400)
// displays matrix displaying a string value over a float value in each cell
mxS.autotable(mxF, Ypos = "middle", Xpos = "center", bgcolor = color.gray, text_color = #86f62a)
Draws this:
Tables with headers:
if barstate.islast
mxF = matrix.new(3,3, 3.14)
mxS = matrix.new(3,3,"PI")
arColHeaders = array.from("Col1", "Col2", "Col3")
arRowHeaders = array.from("Row1", "Row2", "Row3")
// float matrix with col headers
mxF.autotable(
bgcolor = #fdfd6b
, arColHeaders = arColHeaders
)
// string matrix with row headers
mxS.autotable(arRowHeaders = arRowHeaders, Ypos = "bottom", Xpos = "right", bgcolor = #b4d400)
// string/float matrix with both row and column headers
mxS.autotable(mxF
, Ypos = "middle", Xpos = "center"
, arRowHeaders = arRowHeaders
, arColHeaders = arColHeaders
, cornerBgClr = #707070, cornerTitle = "Corner cell", cornerTxtClr = #ffdc13
, bgcolor = color.gray, text_color = #86f62a
)
Draws this:
█ FUNCTIONS
One main function is autotable() which has only one required argument mxValS, a string matrix.
Please see below the description of all of the function parameters:
The table:
tbl (table) (Optional) If supplied, this table will be deleted.
The data:
mxValS (matrix ) (Required) Cell text values
mxValF (matrix) (Optional) Numerical part of cell text values. Is concatenated to the mxValS values via `string_float_separator` string (default " ")
Table properties, have same effect as in table.new() :
defaultBgColor (color) (Optional) bgcolor to be used if mxBgColor is not supplied
Ypos (string) (Optional) "top", "bottom" or "center"
Xpos (string) (Optional) "left", "right", or "center"
frame_color (color) (Optional) frame_color like in table.new()
frame_width (int) (Optional) frame_width like in table.new()
border_color (color) (Optional) border_color like in table.new()
border_width (int) (Optional) border_width like in table.new()
force_overlay (simple bool) (Optional) If true draws table on main pane.
Cell parameters, have same effect as in table.cell() ):
mxBgColor (matrix) (Optional) like bgcolor argument in table.cell()
mxTextColor (matrix) (Optional) like text_color argument in table.cell()
mxTt (matrix) (Optional) like tooltip argument in table.cell()
mxWidth (matrix) (Optional) like width argument in table.cell()
mxHeight (matrix) (Optional) like height argument in table.cell()
mxHalign (matrix) (Optional) like text_halign argument in table.cell()
mxValign (matrix) (Optional) like text_valign argument in table.cell()
mxTextSize (matrix) (Optional) like text_size argument in table.cell()
mxFontFamily (matrix) (Optional) like text_font_family argument in table.cell()
Other table properties:
tableWidth (float) (Optional) Overrides table width if cell widths are non zero. E.g. if there are four columns and cell widths are 20 (either as set via cellW or via mxWidth) then if tableWidth is set to e.g. 50 then cell widths will be 50 * (20 / 80), where 80 is 20*4 = total width of all cells. Works simialar for widths set via mxWidth - determines max sum of widths across all cloumns of mxWidth and adjusts cell widths proportionally to it. If cell widths are 0 (i.e. auto-adjust) tableWidth has no effect.
tableHeight (float) (Optional) Overrides table height if cell heights are non zero. E.g. if there are four rows and cell heights are 20 (either as set via cellH or via mxHeight) then if tableHeigh is set to e.g. 50 then cell heights will be 50 * (20 / 80), where 80 is 20*4 = total height of all cells. Works simialar for heights set via mxHeight - determines max sum of heights across all cloumns of mxHeight and adjusts cell heights proportionally to it. If cell heights are 0 (i.e. auto-adjust) tableHeight has no effect.
defaultTxtColor (color) (Optional) text_color to be used if mxTextColor is not supplied
text_size (string) (Optional) text_size to be used if mxTextSize is not supplied
font_family (string) (Optional) cell text_font_family value to be used if a value in mxFontFamily is no supplied
cellW (float) (Optional) cell width to be used if a value in mxWidth is no supplied
cellH (float) (Optional) cell height to be used if a value in mxHeight is no supplied
halign (string) (Optional) cell text_halign value to be used if a value in mxHalign is no supplied
valign (string) (Optional) cell text_valign value to be used if a value in mxValign is no supplied
Headers parameters:
arColTitles (array) (Optional) Array of column titles. If not na a header row is added.
arRowTitles (array) (Optional) Array of row titles. If not na a header column is added.
cornerTitle (string) (Optional) If both row and column titles are supplied allows to set the value of the corner cell.
colTitlesBgColor (color) (Optional) bgcolor for header row
colTitlesTxtColor (color) (Optional) text_color for header row
rowTitlesBgColor (color) (Optional) bgcolor for header column
rowTitlesTxtColor (color) (Optional) text_color for header column
cornerBgClr (color) (Optional) bgcolor for the corner cell
cornerTxtClr (color) (Optional) text_color for the corner cell
Cell merge parameters:
mxMerge (matrix) (Optional) A matrix determining how cells will be merged. "L" - cell merges to the left, "U" - upwards.
mergeAllColTitles (bool) (Optional) Allows to print a table title instead of column headers, merging all header row cells and leaving just the value of the first cell. For more flexible options use matrix arguments leaving header/row arguments na.
mergeAllRowTitles (bool) (Optional) Allows to print one text value merging all header row cells and leaving just the value of the first cell. For more flexible options use matrix arguments leaving header/row arguments na.
Format:
string_float_separator (string) (Optional) A string used to separate string and float parts of cell values (mxValS and mxValF). Default is " "
format (string) (Optional) format string like in str.format() used to format numerical values
nz (string) (Optional) Determines how na numerical values are displayed.
The only other available function is autotable(string,... ) with a string parameter instead of string and float matrices which draws a one cell table.
█ SAMPLE USE
E.g., CSVParser library demo uses Autotable's for generating complex tables with merged cells.
█ CREDITS
The library was inspired by @kaigouthro's matrixautotable . A true master. Many thanks to him for his creative, beautiful and very helpful libraries.

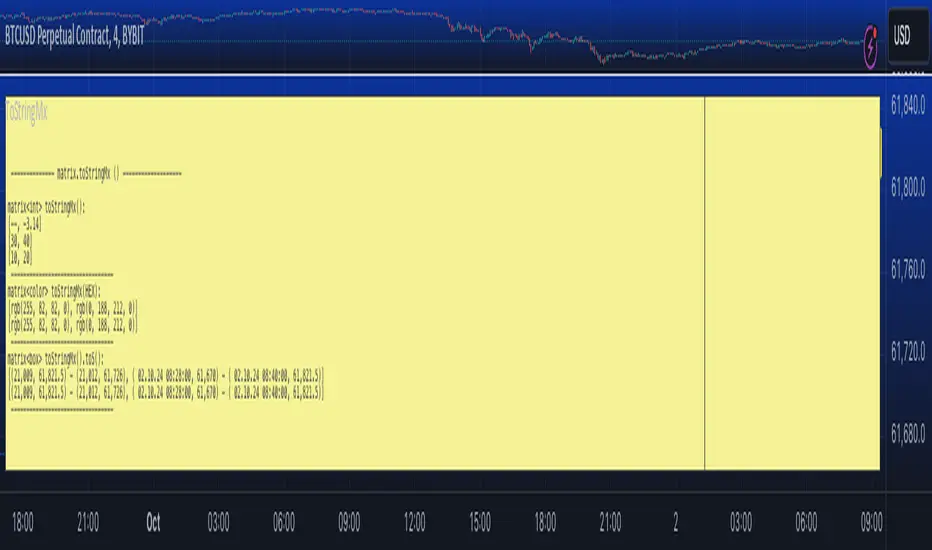
ToStringMx█ OVERVIEW
Contains methods for conversion of matrices to string.
Supports matrices of int/float/bool/string/color/line/label/box/.
- toStringMx(matrix) - converts matrix to a string matrix converting each of its elements to string
- toS(matrix) - converts matrix to a string matrix (using toStringMx()) and outputs as string using str.tostring(matrix)
Conversion of each item to string is made using toS() function from moebius1977/ToS/1 library.
█ GENERAL DESCRIPTION OF FUNCTIONS
All toStringMx(matrix) and toS(matrix) methods have same parameters. The only difference will be in format parameter as explained below.
Parameters:
this (matrix) Matrix to be converted to a string matrix.
format (string) Format string.
nz (string) Placeholder for na items.
format parameter depends on the type:
For matrix format parameter works in the same way as `str.format()` (i.e. you can use same format strings as with `str.format()` with `{0}` as a placeholder for the value) with some shorthand "format" options available:
--- number ---
- "" => "{0}"
- "number" => "{0}"
- "0" => "{0, number, 0 }"
- "0.0" => "{0, number, 0.0 }"
- "0.00" => "{0, number, 0.00 }"
- "0.000" => "{0, number, 0.000 }"
- "0.0000" => "{0, number, 0.0000 }"
- "0.00000" => "{0, number, 0.00000 }"
- "0.000000" => "{0, number, 0.000000 }"
- "0.0000000" => "{0, number, 0.0000000}"
--- date ---
- "date" => "{0, date, dd.MM.YY}"
- "date : time" => "{0, date, dd.MM.YY} : {0, time, HH.mm.ss}"
- "dd.MM" => "{0, date, dd:MM}"
- "dd" => "{0, date, dd}"
- "... ... " in any place is substituted with "{0, date, dd.MM.YY}"
--- time ---
- "time" => "{0, time, HH:mm:ss}"
- "HH:mm" => "{0, time, HH:mm}"
- "mm:ss" => "{0, time, mm:ss}"
- "date time" => "{0, date, dd.MM.YY\} {0, time, HH.mm.ss}"
- "date, time" => "{0, date, dd.MM.YY\}, {0, time, HH.mm.ss}"
- "date,time" => "{0, date, dd.MM.YY\},{0, time, HH.mm.ss}"
- "date time" => "{0, date, dd.MM.YY\} {0, time, HH.mm.ss}"
- "... ... " in any place is substituted with "{0, time, HH.mm.ss}"
For matrix :
format (string) : (string) (Optional) Use `x1` as placeholder for `x1` and so on. E.g. default format is `"(x1, y1) - (x2, y2)"`.
For matrix :
format (string) : (string) (Optional) Use `x1` as placeholder for `x`, `y1 - for `y` and `txt` for label's text. E.g. default format is `(x1, y1): "txt"` if ptint_text is true and `(x1, y1)` if false.
For matrix :
format (string) : (string) (Optional) Use `x1` as placeholder for `x`, `y1 - for `y` etc. E.g. default format is "(x1, y1) - (x2, y2)".
For matrix :
format (string) : (string) (Optional) Options are "HEX" (e.g. "#FFFFFF33") or "RGB" (e.g. "rgb(122,122,122,23)"). Default is "HEX".
█ FULL LIST OF FUNCTIONS AND PARAMETERS
method toStringMx(mx, format, nz)
Returns a string matrix made of original matrix items converted to string with toS().
Namespace types: matrix
Parameters:
mx (matrix)
format (string) : (string) Like in str.format()
nz (string) : (string) If val is na and nz is not na the value of nz param is returned instead.
method toStringMx(mx, format, nz)
Returns a string matrix made of original matrix items converted to string with toS().
Namespace types: matrix
Parameters:
mx (matrix)
format (string) : (string) Like in str.format() with some shorthand options:
```
--- number ---
- "" => "{0}"
- "number" => "{0}"
- "0" => "{0, number, 0 }"
- "0.0" => "{0, number, 0.0 }"
- "0.00" => "{0, number, 0.00 }"
- "0.000" => "{0, number, 0.000 }"
- "0.0000" => "{0, number, 0.0000 }"
- "0.00000" => "{0, number, 0.00000 }"
- "0.000000" => "{0, number, 0.000000 }"
- "0.0000000" => "{0, number, 0.0000000}"
--- date ---
- "date" => "{0, date, dd.MM.YY}"
- "date : time" => "{0, date, dd.MM.YY} : {0, time, HH.mm.ss}"
- "dd.MM" => "{0, date, dd:MM}"
- "dd" => "{0, date, dd}"
- "... ... " in any place is substituted with "{0, date, dd.MM.YY}"
--- time ---
- "time" => "{0, time, HH:mm:ss}"
- "HH:mm" => "{0, time, HH:mm}"
- "mm:ss" => "{0, time, mm:ss}"
- "date time" => "{0, date, dd.MM.YY\} {0, time, HH.mm.ss}"
- "date, time" => "{0, date, dd.MM.YY\}, {0, time, HH.mm.ss}"
- "date,time" => "{0, date, dd.MM.YY\},{0, time, HH.mm.ss}"
- "date time" => "{0, date, dd.MM.YY\} {0, time, HH.mm.ss}"
- "... ... " in any place is substituted with "{0, time, HH.mm.ss}"
nz (string) : (string) If val is na and nz is not na the value of nz param is returned instead.
method toStringMx(mx, format, nz)
Returns a string matrix made of original matrix items converted to string with toS().
Namespace types: matrix
Parameters:
mx (matrix)
format (string) : (string) Like in str.format()
nz (string) : (string) If val is na and nz is not na the value of nz param is returned instead.
method toStringMx(mx, format, nz)
Returns a string matrix made of original matrix items converted to string with toS().
Namespace types: matrix
Parameters:
mx (matrix)
format (string) : (string) "HEX" (default) or "RGB"
nz (string) : (string) If val is na and nz is not na the value of nz param is returned instead.
method toStringMx(mx, format, nz)
Returns a string matrix made of original matrix items converted to string with toS().
Namespace types: matrix
Parameters:
mx (matrix)
format (string) : (string) (Optional) Format string. By default "{0}: {1}" if showIDs = true or "{1}" otherwise. (use "{0}" as a placeholder for id and "{1}" for item value)
nz (string) : (string) If val is na and nz is not na the value of nz param is returned instead.
method toS(this, format, nz)
Converts each element of the matrix to string outputs using str.tostring(matrix)
Namespace types: matrix
Parameters:
this (matrix) : (matrix) Matrix to be converted to string
format (string) : (string) Format string as in str.format()
nz (string) : (string) If val is na and nz is not na the value of nz param is returned instead.export method toS(matrix this, string format = "", string nz = na) => str.tostring(this.toStringMx(format, nz))
method toS(this, format, nz)
Converts each element of the matrix to string outputs using str.tostring(matrix)
Namespace types: matrix
Parameters:
this (matrix) : (matrix) Matrix to be converted to string
format (string) : (string) Like in str.format() with some shorthand options:
```
--- number ---
- "" => "{0}"
- "number" => "{0}"
- "0" => "{0, number, 0 }"
- "0.0" => "{0, number, 0.0 }"
- "0.00" => "{0, number, 0.00 }"
- "0.000" => "{0, number, 0.000 }"
- "0.0000" => "{0, number, 0.0000 }"
- "0.00000" => "{0, number, 0.00000 }"
- "0.000000" => "{0, number, 0.000000 }"
- "0.0000000" => "{0, number, 0.0000000}"
--- date ---
- "date" => "{0, date, dd.MM.YY}"
- "date : time" => "{0, date, dd.MM.YY} : {0, time, HH.mm.ss}"
- "dd.MM" => "{0, date, dd:MM}"
- "dd" => "{0, date, dd}"
- "... ... " in any place is substituted with "{0, date, dd.MM.YY}"
--- time ---
- "time" => "{0, time, HH:mm:ss}"
- "HH:mm" => "{0, time, HH:mm}"
- "mm:ss" => "{0, time, mm:ss}"
- "date time" => "{0, date, dd.MM.YY\} {0, time, HH.mm.ss}"
- "date, time" => "{0, date, dd.MM.YY\}, {0, time, HH.mm.ss}"
- "date,time" => "{0, date, dd.MM.YY\},{0, time, HH.mm.ss}"
- "date time" => "{0, date, dd.MM.YY\} {0, time, HH.mm.ss}"
- "... ... " in any place is substituted with "{0, time, HH.mm.ss}"
nz (string) : (string) If val is na and nz is not na the value of nz param is returned instead.export method toS(matrix this, string format = "", string nz = na) => str.tostring(this.toStringMx(format, nz))
method toS(this, format, nz)
Converts each element of the matrix to string outputs using str.tostring(matrix)
Namespace types: matrix
Parameters:
this (matrix) : (matrix) Matrix to be converted to string
format (string) : (string) Format string as in str.format()
nz (string) : (string) If val is na and nz is not na the value of nz param is returned instead.export method toS(matrix this, string format = "", string nz = na) => str.tostring(this.toStringMx(format, nz))
method toS(this, format, nz)
Converts each element of the matrix to string outputs using str.tostring(matrix)
Namespace types: matrix
Parameters:
this (matrix) : (matrix) Matrix to be converted to string
format (string) : (string) "HEX" (default) or "RGB"
nz (string) : (string) If val is na and nz is not na the value of nz param is returned instead.export method toS(matrix this, string format = "", string nz = na) => str.tostring(this.toStringMx(format, nz))
method toS(this, format, nz)
Converts each element of the matrix to string outputs using str.tostring(matrix)
Namespace types: matrix
Parameters:
this (matrix) : (matrix) Matrix to be converted to string
format (string) : (string) (Optional) Format string. By default "{0}: {1}" if showIDs = true or "{1}" otherwise. (use "{0}" as a placeholder for id and "{1}" for item value)
nz (string) : (string) If val is na and nz is not na the value of nz param is returned instead.export method toS(matrix this, string format = "", string nz = na) => str.tostring(this.toStringMx(format, nz))
Matrix Glitch | FractalystThe Matrix Glitch indicator is a visually engaging tool for traders, inspired by the iconic Matrix movie effects. It overlays price charts with dynamic, multi-colored glitches that sync with market data, creating a striking, almost surreal visual experience.
The indicator uses characters from various languages (e.g., Japanese, Chinese, Russian, English) to mimic the digital rain effect from the movies. Users can select a language, which activates a corresponding array of characters. These characters are randomly picked from the chosen array and displayed on the chart.
Underlying Calculations and Logic
Arrays in the Indicator
1- Character Management:
The script uses arrays to store sets of characters representing different symbols or alphabets. These arrays allow the indicator to dynamically select and update characters for display. Each element in these arrays corresponds to a specific character that will be used to populate the grid.
2- Current and Previous States:
Arrays are employed to keep track of the current state of characters that are displayed on the grid. Simultaneously, another set of arrays records the previous state of these characters. This dual-state management allows the script to smoothly transition between updates, handling changes in characters and visual effects like fading.
3- Transparency Control:
Transparency levels for each character in the grid are managed through arrays. These arrays store the opacity values, ensuring that each character has the appropriate level of transparency. By comparing the current and previous transparency states, the script can create effects like gradual fading or intensifying visibility.
4- Rain Effect Simulation:
To create the "rain" effect, the script maintains arrays that simulate the falling text by continuously updating the position and visibility of characters. As new characters enter the top of the grid, older ones are removed from the bottom, with their transparency levels adjusted to simulate movement.
5- Operational Flow:
Initialization : Arrays are initialized to manage both the characters and their transparency. This setup allows the script to handle the dynamic display efficiently.
Updates : During each cycle, new characters are selected and old characters are shifted accordingly. The arrays ensure that both the content and appearance of the grid are updated seamlessly.
Rendering : The arrays dictate how characters and their transparency are rendered on the grid, ensuring a cohesive and visually appealing effect.
Here's how to use the indicator step-by-step:
1- Apply the Indicator to Your Charts:
Begin by adding the indicator to your chart. This will activate the visual effect on your selected trading instrument or time frame.
Select Your Preferred Language of the Matrix Characters:
In the settings, choose the language or symbol set you want the matrix characters to display. This could be anything from traditional matrix-style characters to different alphabets or custom symbols.
2- Choose the Matrix Effect (Rain, Burst):
Decide on the type of visual effect you prefer. You can select from options like the classic "rain" effect, where characters fall from the top of the screen, or a "burst" effect, where characters explode outward or appear in a different dynamic pattern.
3- Adjust the Color According to Your Preference:
Customize the color of the matrix characters to suit your aesthetic or chart theme. You can select from a range of colors or even set up a gradient for more complex visual effects.
4- Adjust the Width and Height of the Matrix According to Your Screen:
Fine-tune the dimensions of the matrix display. Set the width and height so that the matrix fits perfectly on your screen, ensuring that it aligns well with other chart elements and doesn't obstruct your view.
------
What Makes the Matrix Glitch Indicator Unique?
Language Selection:
Customizable Language: Unlike many indicators that might offer static or limited visual elements, the Matrix Glitch Indicator allows users to choose from a variety of languages for the characters displayed. This feature not only personalizes the user experience but also adds a cultural or linguistic element to trading charts. Users can select languages like Japanese, Chinese, Russian, or English, and many more.
This flexibility ensures that traders from different backgrounds can feel a connection with their charts through familiar or exotic scripts.
Dynamic Effects:
Effect Modes: The indicator offers two distinct modes - Rain Mode and Burst Mode. In Rain Mode, characters fall from the top of the chart, mimicking the iconic digital rain from the Matrix films.
In Burst Mode, characters radiate outward from a central point, creating a unique visual effect that can be synchronized with market volatility.
This dual-mode functionality allows traders to choose how they want their data to be visually represented, providing both aesthetic variety and potentially different insights into market behavior.
Color Customization:
Full Color Control: The ability to fully customize the color of the characters is a standout feature. Traders can match the indicator's colors to their trading platform's theme, their mood, or even specific market conditions (e.g., red for downturns, green for upturns). This level of customization not only aids in creating a personalized trading environment but can also serve as a visual cue for different market states.
Universal Display Compatibility:
Adjustability for All Displays: The indicator is designed to be fully adjustable for various screen resolutions and sizes. This ensures that whether you're trading on a high-resolution monitor, a laptop, or even a mobile device, the Matrix Glitch effect remains clear and impactful without compromising on the functionality of the trading chart. This adaptability is crucial in an era where trading can happen anywhere, making the indicator a versatile tool for traders on the go or in a static setup.
------
Terms and Conditions | Disclaimer
Our charting tools are provided for informational and educational purposes only and should not be construed as financial, investment, or trading advice. They are not intended to forecast market movements or offer specific recommendations. Users should understand that past performance does not guarantee future results and should not base financial decisions solely on historical data.
Built-in components, features, and functionalities of our charting tools are the intellectual property of @Fractalyst use, reproduction, or distribution of these proprietary elements is prohibited.
By continuing to use our charting tools, the user acknowledges and accepts the Terms and Conditions outlined in this legal disclaimer and agrees to respect our intellectual property rights and comply with all applicable laws and regulations.

ICT IPDA Liquidity Matrix By AlgoCadosThe ICT IPDA Liquidity Matrix by AlgoCados is a sophisticated trading tool that integrates the principles of the Interbank Price Delivery Algorithm (IPDA), as taught by The Inner Circle Trader (ICT). This indicator is meticulously designed to support traders in identifying key institutional levels and liquidity zones, enhancing their trading strategies with data-driven insights. Suitable for both day traders and swing traders, the tool is optimized for high-frequency and positional trading, providing a robust framework for analyzing market dynamics across multiple time horizons.
# Key Features
Multi-Time Frame Analysis
High Time Frame (HTF) Levels : The indicator tracks critical trading levels over multiple days, specifically at 20, 40, and 60-day intervals. This functionality is essential for identifying long-term trends and significant support and resistance levels that aid in strategic decision-making for swing traders and positional traders.
Low Time Frame (LTF) Levels : It monitors price movements within 20, 40, and 60-hour intervals on lower time frames. This granularity provides a detailed view of intraday price actions, which is crucial for scalping and short-term trading strategies favored by day traders.
Daily Open Integration : The indicator includes the daily opening price, providing a crucial reference point that reflects the market's initial sentiment. This feature helps traders assess the market's direction and volatility, enabling them to make informed decisions based on the day's early movements, which is particularly useful for day trading strategies.
IPDA Reference Points : By leveraging IPDA's 20, 40, and 60-period lookbacks, the tool identifies Key Highs and Lows, which are used by IPDA as Draw On Liquidity. IPDA is an electronic and algorithmic system engineered for achieving price delivery efficiency, as taught by ICT. These reference points serve as benchmarks for understanding institutional trading behavior, allowing traders to align their strategies with the dominant market forces and recognize institutional key levels.
Dynamic Updates and Overlap Management : The indicator is updated daily at the beginning of a new daily candle with the latest market data, ensuring that traders operate with the most current information. It also features intelligent overlap management that prioritizes the most relevant levels based on the timeframe hierarchy, reducing visual clutter and enhancing chart readability.
Comprehensive Customization Options : Traders can tailor the indicator to their specific needs through an extensive input menu. This includes toggles for visibility, line styles, color selections, and label display preferences. These customization options ensure that the tool can adapt to various trading styles and preferences, enhancing user experience and analytical capabilities.
User-Friendly Interface : The tool is designed with a user-friendly interface that includes clear, concise labels for all significant levels. It supports various font families and sizes, making it easier to interpret and act upon the displayed data, ensuring that traders can focus on making informed trading decisions without being overwhelmed by unnecessary information.
# Usage Note
The indicator is segmented into two key functionalities:
LTF Displays : The Low Time Frame (LTF) settings are exclusive to timeframes up to 1 hour, providing detailed analysis for intraday traders. This is crucial for traders who need precise and timely data to make quick decisions within the trading day.
HTF Displays : The High Time Frame (HTF) settings apply to the daily timeframe and any shorter intervals, allowing for comprehensive analysis over extended periods. This is beneficial for swing traders looking to identify broader trends and market directions.
# Inputs and Configurations
BINANCE:BTCUSDT
Offset: Adjustable setting to shift displayed data horizontally for better visibility, allowing traders to view past levels and make informed decisions based on historical data.
Label Styles: Choose between compact or verbose label formats for different levels, offering flexibility in how much detail is displayed on the chart.
Daily Open Line: Customizable line style and color for the daily opening price, providing a clear visual reference for the start of the trading day.
HTF Levels: Configurable high and low lines for HTF with options for style and color customization, allowing traders to highlight significant levels in a way that suits their trading style.
LTF Levels: Similar customization options for LTF levels, ensuring flexibility in how data is presented, making it easier for traders to focus on the most relevant intraday levels.
Text Utils: Settings for font family, size, and text color, allowing for personalized display preferences and ensuring that the chart is both informative and aesthetically pleasing.
# Advanced Features
Overlap Management : The script intelligently handles overlapping levels, particularly where multiple timeframes intersect, by prioritizing the more significant levels and removing redundant ones. This ensures that the charts remain clear and focused on the most critical data points, allowing traders to concentrate on the most relevant market information.
Real-Time Updates : The indicator updates its calculations at the start of each new daily bar, incorporating the latest market data to provide timely and accurate trading signals. This real-time updating is crucial for traders who rely on up-to-date information to execute their strategies effectively and make informed trading decisions.
# Example Use Cases
Scalpers/Day traders: Can utilize the LTF features to make rapid decisions based on hourly market movements, identifying short-term trading opportunities with precision.
Swing Traders: Will benefit from the HTF analysis to identify broader trends and key levels that influence longer-term market movements, enabling them to capture significant market swings.
By providing a clear, detailed view of key market dynamics, the ICT IPDA Liquidity Matrix by AlgoCados empowers traders to make more informed and effective trading decisions, aligning with institutional trading methodologies and enhancing their market understanding.
# Usage Disclaimer
This tool is designed to assist in trading decisions, but it should be used in conjunction with other analysis methods and risk management strategies. Trading involves significant risk, and it is essential to understand the market conditions thoroughly before making trading decisions.

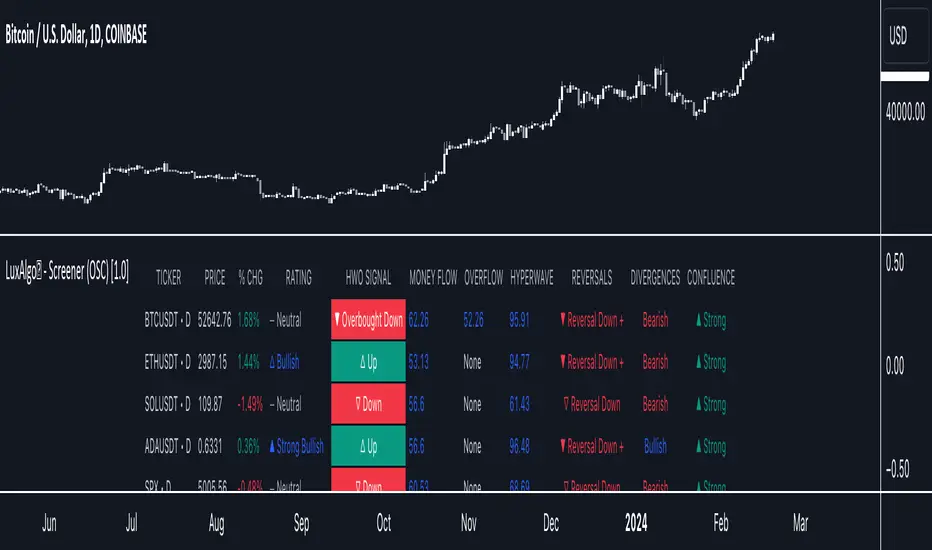
LuxAlgo® - Screener (OSC)The LuxAlgo® - Screener (OSC) is a complete tool allowing users to check returned information from the Oscillator Matrix™ toolkit's features for various user selected tickers and timeframes.
Users can customize the returned information by the screener, as well as filtering out displayed tickers based on custom user set rules.
🔶 FEATURES
Users can place the location of the screener everywhere they want, multiple locations are supported, you can even have it on your chart by drag and dropping the screener to your chart, allowing you to analyze them alongside your favorite indicators.
Keeping track of various tickers is crucial to have a deeper understanding of the overall market activity.
Our screener let you quickly access your preferred information in a convenient way thanks to the described features below:
Screening of the main Oscillator Matrix™ features on up to 10 user selected tickers and timeframes.
Ticker filtering based on custom user set rules.
Ticker sorting based on ascending/descending user selected data returned by the screener.
The LuxAlgo® - Screener (OSC) returns the following information:
Current price
Current volume
Current price percent change (% CHG)
Current price change (CHG)
Current rating
Most recent HyperWave signal
Current Money Flow value
Current Overflow value
Current HyperWave value
Most recent reversal signal
Most recent divergence
Current Confluence status
🔹 Rating
Users can quickly check the overall sentiment based on the screeners returned information by looking at the Rating column. Tickers can be rated as follows:
▲ Strong Bullish (more than 80% of the returned information is bullish)
△ Bullish (60% to 80% of the returned information is bullish)
― Neutral (40% to 60% of the returned information is bullish)
▽ Bearish (20% to 60% of the returned information is bullish)
▼ Strong Bearish (less than 20% of the returned information is bullish)
This can be a quick way to asses the confluence between all the returned information on the screener for a specific ticker.
🔹 Filtering
Thanks to the integrated filtering capabilities of the LuxAlgo® - Screener (OSC) you will be able to keep track of the information from tickers that return specific information you want to see.
For example do you want to only see the information from tickers with bullish money flow?
Nothing easier, all you need is to select the "Above" option in the Money Flow dropdown menu and set the value 50 in the input to the right.
However, you don't have to stop at 1 filtering condition, create more complex ones that fits your trading style for the tickers you truly want to look at!
🔹 Sorting
As traders we want to quickly spot the tickers with most volume, most volatility, with the strongest uptrend or downtrend.
The LuxAlgo® - Screener (OSC) lets you do that by sorting supported information in an ascending or descending order, letting you access the most relevant information faster.
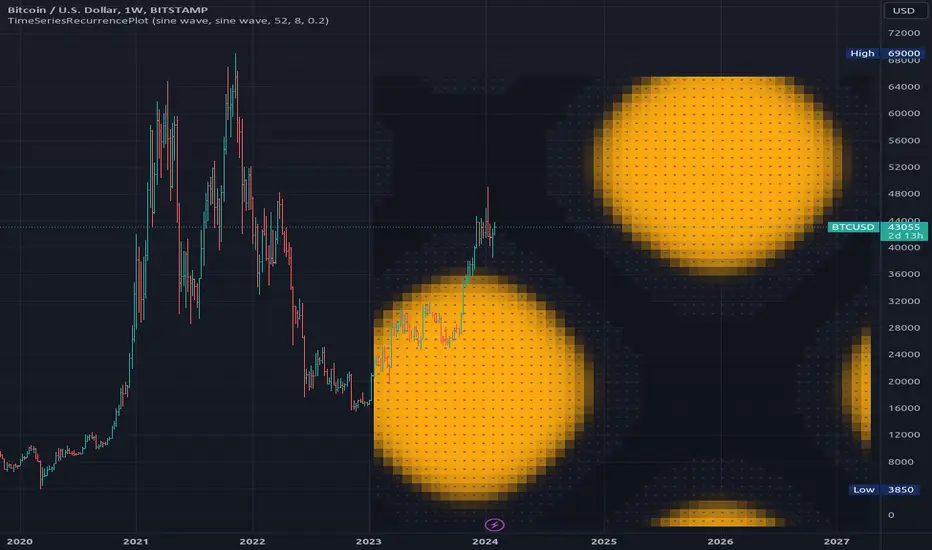
TimeSeriesRecurrencePlotLibrary "TimeSeriesRecurrencePlot"
In descriptive statistics and chaos theory, a recurrence plot (RP) is a plot showing, for each moment i i in time, the times at which the state of a dynamical system returns to the previous state at `i`, i.e., when the phase space trajectory visits roughly the same area in the phase space as at time `j`.
```
A recurrence plot (RP) is a graphical representation used in the analysis of time series data and dynamical systems. It visualizes recurring states or events over time by transforming the original time series into a binary matrix, where each element represents whether two consecutive points are above or below a specified threshold. The resulting Recurrence Plot Matrix reveals patterns, structures, and correlations within the data while providing insights into underlying mechanisms of complex systems.
```
~starling7b
___
Reference:
en.wikipedia.org
github.com
github.com
github.com
github.com
juliadynamics.github.io
distance_matrix(series1, series2, max_freq, norm)
Generate distance matrix between two series.
Parameters:
series1 (float) : Source series 1.
series2 (float) : Source series 2.
max_freq (int) : Maximum frequency to inpect or the size of the generated matrix.
norm (string) : Norm of the distance metric, default=`euclidean`, options=`euclidean`, `manhattan`, `max`.
Returns: Matrix with distance values.
method normalize_distance(M)
Normalizes a matrix within its Min-Max range.
Namespace types: matrix
Parameters:
M (matrix) : Source matrix.
Returns: Normalized matrix.
method threshold(M, threshold)
Updates the matrix with the condition `M(i,j) > threshold ? 1 : 0`.
Namespace types: matrix
Parameters:
M (matrix) : Source matrix.
threshold (float)
Returns: Cross matrix.
rolling_window(a, b, sample_size)
An experimental alternative method to plot a recurrence_plot.
Parameters:
a (array) : Array with data.
b (array) : Array with data.
sample_size (int)
Returns: Recurrence_plot matrix.
TimeSeriesGrammianAngularFieldLibrary "TimeSeriesGrammianAngularField"
provides Grammian angular field and associated utility functions.
___
Reference:
*Time Series Classification: A review of Algorithms and Implementations*.
www.researchgate.net
method normalize(data, a, b)
Normalize the series to a optional range, usualy within `(-1, 1)` or `(0, 1)`.
Namespace types: array
Parameters:
data (array) : Sample data to normalize.
a (float) : Minimum target range value, `default=-1.0`.
b (float) : Minimum target range value, `default= 1.0`.
Returns: Normalized array within new range.
___
Reference:
*Time Series Classification: A review of Algorithms and Implementations*.
normalize_series(source, length, a, b)
Normalize the series to a optional range, usualy within `(-1, 1)` or `(0, 1)`.\
*Note that this may provide a different result than the array version due to rolling range*.
Parameters:
source (float) : Series to normalize.
length (int) : Number of bars to sample the range.
a (float) : Minimum target range value, `default=-1.0`.
b (float) : Minimum target range value, `default= 1.0`.
Returns: Normalized series within new range.
method polar(data)
Turns a normalized sample array into polar coordinates.
Namespace types: array
Parameters:
data (array) : Sampled data values.
Returns: Converted array into polar coordinates.
polar_series(source)
Turns a normalized series into polar coordinates.
Parameters:
source (float) : Source series.
Returns: Converted series into polar coordinates.
method gasf(data)
Gramian Angular Summation Field *`GASF`*.
Namespace types: array
Parameters:
data (array) : Sampled data values.
Returns: Matrix with *`GASF`* values.
method gasf_id(data)
Trig. identity of Gramian Angular Summation Field *`GASF`*.
Namespace types: array
Parameters:
data (array) : Sampled data values.
Returns: Matrix with *`GASF`* values.
Reference:
*Time Series Classification: A review of Algorithms and Implementations*.
method gadf(data)
Gramian Angular Difference Field *`GADF`*.
Namespace types: array
Parameters:
data (array) : Sampled data values.
Returns: Matrix with *`GADF`* values.
method gadf_id(data)
Trig. identity of Gramian Angular Difference Field *`GADF`*.
Namespace types: array
Parameters:
data (array) : Sampled data values.
Returns: Matrix with *`GADF`* values.
Reference:
*Time Series Classification: A review of Algorithms and Implementations*.

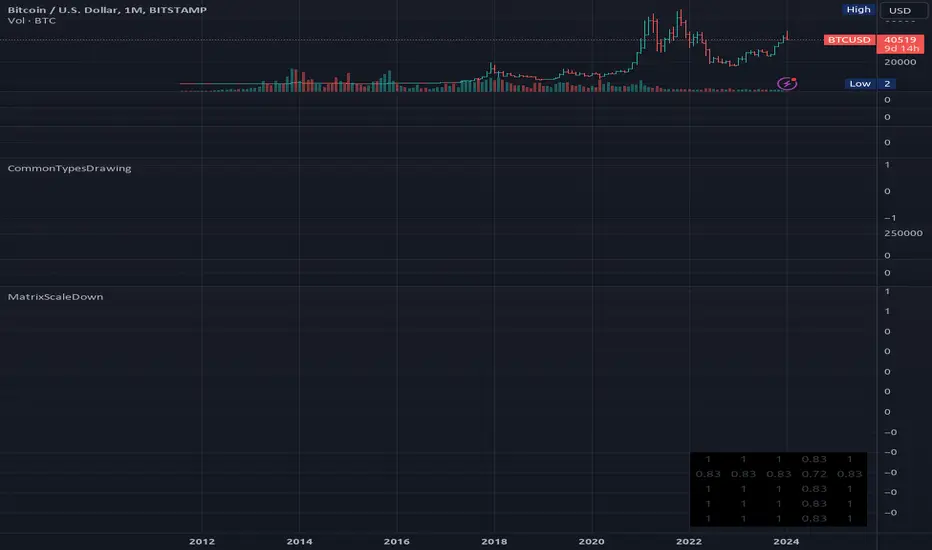
MatrixScaleDownLibrary "MatrixScaleDown"
Provides a function to scale down a matrix into a smaller square format were its values are averaged to mantain matrix topology.
method scale_down(mat, size)
scale a matrix to a new smaller square size.
Namespace types: matrix
Parameters:
mat (matrix) : Source matrix.
size (int) : New matrix size.
Returns: New matrix with scaled down size. Source values will be averaged together.
LuxAlgo - Backtester (OSC)The OSC Backtester is an innovative strategy script that allows users to create a wide variety of strategies using various unique oscillators.
By utilizing our 'Step' and 'Match' algorithms, users can create custom and complex strategy entries from each of the supported oscillators and included conditions, as well as any external sources, allowing users to create entries from a sequence of conditions and/or multiple matching conditions.
We included a complete alert system that will send a notification for each action taken by the strategy and we also allow users to set custom messages for each action taken by a strategy.
🔶 Features
🔹 Step & Match Algorithm
More complex entry rules can be created by using multiple conditions together, this is done thanks to the Step dropdown setting on the right of each condition.
The Step setting is directly related to the Step & Match algorithm and works in two ways:
When two or more conditions have the same step number, both conditions are evaluated. Used to test matching conditions.
When two or more conditions have different step numbers, each conditions will be evaluated in order, testing for the first step and switching to the next step once the previous one is true. When the final step is true the strategy will open a market order. Used to create sequence of conditions.
This operation is complementary, as you can create a sequence of conditions with one step consisting of two or more matching conditions as long as they have the same step number.
🔹 Fully Customizable Entries From Various Oscillators And Conditions
We allow the users to set entries using our unique HyperWave, Smart Money Flow, and their derived conditions as entries.
The Hyper Wave is a normalized adaptive oscillator aiming to reflect price trends without returning a high amount of noise.
The Smart Money Flow aims to detect trends based on market activity, by doing a comparative analysis between current volume and historical volume. A Smart Money Flow above 50 suggest market participants are bullish, else bearish. Derived from this oscillator we have Overflow indications, this indicator detects when market is overbought or oversold based on participants activity.
Other entries include proprietary reversal signals, real-time divergence detection, oscillator confluence (indicating how aligned each oscillator is), as well as entries using external sources.
🔹 Complete Alert System
Users can get alerted for any action executed by a strategy, from opening positions to closing them.
The message field in the Alert Messages setting section allows for the strategy to send a custom alert message depending on the action taken by the strategy, if no messages are set the strategy will send default messages.
🔶 Usage
Users can create a wide variety of strategies from this script, whether they are trend-following or contrarian traders.
Let's see a contrarian (revesal-based) strategy example using the following entry conditions:
Long: Hyperwave bullish divergence and oversold Hyperwave (lower than 20).
Short: Hyperwave bearish divergence and overbought Hyperwave (greater than 20).
We can also introduce take-profit and stop-loss exit conditions based on external indicators, allowing more control over exits in our strategy. For example:
Long: Hyperwave crossing over 50 while money flow is bearish.
Short: Hyperwave crossing under 50 while money flow is bullish.
Exit Long on a profit (long exit tp): Hyperwave crossing 80.
Exit Short on a profit (short exit tp): Hyperwave crossing 20.
While this strategy script can be used as a standalone, we recommend using other indicators creatively to assist with entries and exits as well as TP/SLs.
Our Step & Match algorithm can magnify interoperability, allowing for way more complete strategies through complex conditions, let's demonstrate this using the following entries:
Long: Any bullish reversal occurring after the price crosses over the lowest upper reversal zone of the Signals & Overlays™.
Short: Any bearish reversal occurring after the price crosses under the highest lower reversal zone of the Signals & Overlays™.
Long TP/SL: 5 ATR's away from the entry price.
Short TP/SL: 5 ATR's away from the entry price.
🔶 Strategy Properties (Important)
This script backtest is done on daily EURGBP, using the following backtesting properties:
Balance (default): 10 000 (default base currency)
Order Size: 10% of the equity
Comission: 3.4 pips (average spread for EURGBP)
Slippage: 3 tick
Stop Loss: 0.02 points away from entry price
We use these properties to ensure a realistic preview of the backtesting system, do note that default properties can be different for various reasons described below:
Order Size: 1 contract by default, this is to allow the strategy to run properly on most instruments such as futures.
Comission: Comission can vary depending on the market and instrument, there is no default value that might return realistic results.
We strongly recommend all users to ensure they adjust the Properties within the script settings to be in line with their accounts & trading platforms of choice to ensure results from the strategies built are realistic.
🔶 How To Access
You can see the Author's Instructions below to learn how to get access.

RSI Radar Multi Time FrameHello All!
First of all many Thanks to Tradingview and Pine Team for developing Pine Language all the time! Now we have a new feature and it's called Polylines and I developed RSI Radar Multi Time Frame . This script is an example and experimental work, you can use it as you wish.
The scripts gets RSI values from 6 different time frames, it doesn't matter the time frame you choose is higher/lower or chart time frame. it means that the script can get RSI values from higher or lower time frames than chart time frame.
It's designed to show RSI Radar all the time on the chart even if you zoom in/out or scroll left/right.
You can set OB/OS or RSI line colors. Also RSI polyline is shown as Curved/Hexagon optionally.
Some screenshots here:
Doesn't matter if you zoom out, it can show RSI radar in the visible area:
Another example:
You can change the colors, or see the RSI as Hexagon:
Time frames from seconds to 1Day in this example while chart time frame is any ( 30mins here )
Enjoy!

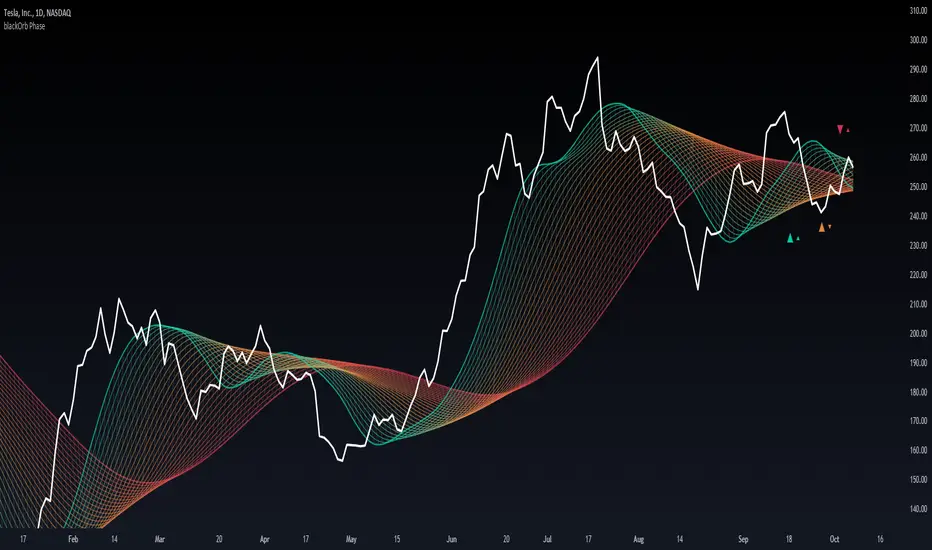
blackOrb PhaseMA matrix for identification of bullish/bearish macro phases and strategy implementation through the definition of effective MA lengths.
Moving Averages, when conventionally employed in either single-line or dual-line configurations, come with inherent limitations that hinder their effectiveness in capturing the complexities of varying market conditions.
In response to this challenge, blackOrb Phase utilizes a combination of quantitative and relational MA analysis techniques, providing users with a more comprehensive understanding of market trends and a granular derivation of price-dynamic phases by using the following features:
I. MA matrix to identify effective MA lengths for strategy implementation
II. Stochastic coloring for trend tracking and macro phase identification
III. Diverse MA options for enhanced analytical flexibility
Technical Methodology
I. MA Matrix to Identify Effective MA Lengths for Strategy Implementation
Central to the methodology is the ability to identify optimal MA lengths for effective strategy implementation. blackOrb Phase utilizes a matrix of multiple MAs, each characterized by unique parameters, to establish a relational grid structure. By systematically examining price data within predefined vertical segments, this matrix offers a linear multi-level modulation of historical price data, providing access to up to 500 prior data instances. This methodology enhances the analysis of both micro price dynamics shifts and bullish or bearish macro trend changes. It has been empirically validated that this approach can assist users to refine their analysis and adapt to varying market conditions*.
Crossings of MA lines with different colors signify potential shifts in price dynamic phases. When green MA lines intersect red MA lines, it suggests a higher likelihood of a macro trend change (bullish or bearish market environment). Conversely, when green MA lines cross over orange MA lines, it indicates a lower probability of a macro trend change but still suggests a potential micro trend shift. This micro trend shift can be viewed as a subordinate price dynamic change within the broader macro trend.
*Source: Prof. Pätäri, Eero. "Performance of moving average trading strategies over varying stock market conditions." Applied Economics, vol. 46, no. 24, 2014, pp. 2851-2872.
II. Stochastic Coloring for Trend Tracking and Macro Phase Identification
To provide a comprehensive view, this indicator includes a stochastic tracking feature, displayed through an intuitive single-color system across the entire matrix grid. The color scheme transitions from red lines, indicating the beginning of bearish trend phases, to green lines, indicating the initiation of bullish trend phases and vice versa. The greater the number of lines with the same color, the stronger the trend.
This tool enhances price trend monitoring, allowing traders not only to track their initiation and continuation but also to confirm trend culmination. By observing color shifts from red/green lines, traders can assess the sustainability and persistence of broader macro trends.
Note: Stochastic coloring aids in probability-based orientation and provides valuable insights for trading strategy implementation. It is most effective when used in conjunction with other analysis and risk management techniques.
III. Diverse MA Options for Enhanced Analytical Flexibility
Users have the flexibility to choose from 14 different MA types (e.g. including ALMA, KAMA, T3, VWMA, TriMA and ZLEMA). This versatility allows for precise configurations tailored to specific market conditions.
For example, among the array of these 14 MA alternatives, VWMA (Volume Weighted MA) stands out as a suitable implementation choice for integrating volume data. It goes beyond the scope of a simple moving average, considering both price and volume in its calculation, as shown in the following formula:
(C1 x V1 + C2 x V2 + ... + Cn x Vn) / (V1 + V2 + ... + Vn)
Alongside this variety of MA types, users can select from a range of OHLC combination options (open, high, low and close price data), further enhancing analytical flexibility.
Note: While these choices offer substantial flexibility, they also require a solid understanding of the various MA types and data combinations, making risk management essential.
Note on Usability
blackOrb Phase can have synergies with blackOrb Price and blackOrb Zone as all three indicators combined can give a bigger picture for supporting comprehensive and multifaceted data-driven trading analysis.
This tool was meticulously created to serve as an additional frame for the seamless integration of other more granular trading indicators. This indicator isn't intended for standalone trading application. Instead, it is serving as a supplementary tool for orientation within broader trading strategies.
Irrespective of market conditions, it can harmonize with a wider range of trading styles and instruments / trading pairs / indices like Stocks, Gold, FX, EURUSD, SPX500, GBPUSD, BTCUSD and Oil.
Inspiration and Publishing
Taking genesis from the inspirations amongst others provided by TradingView Pine Script Wizard Kodify, blackOrb Phase is a multi-encompassing script meticulously forged from scratch. It aspires to furnish a comprehensive approach, borne out of personal experiences and a strong dedication in supporting the trading community. We eagerly await valuable feedback to refine and further enhance this tool.
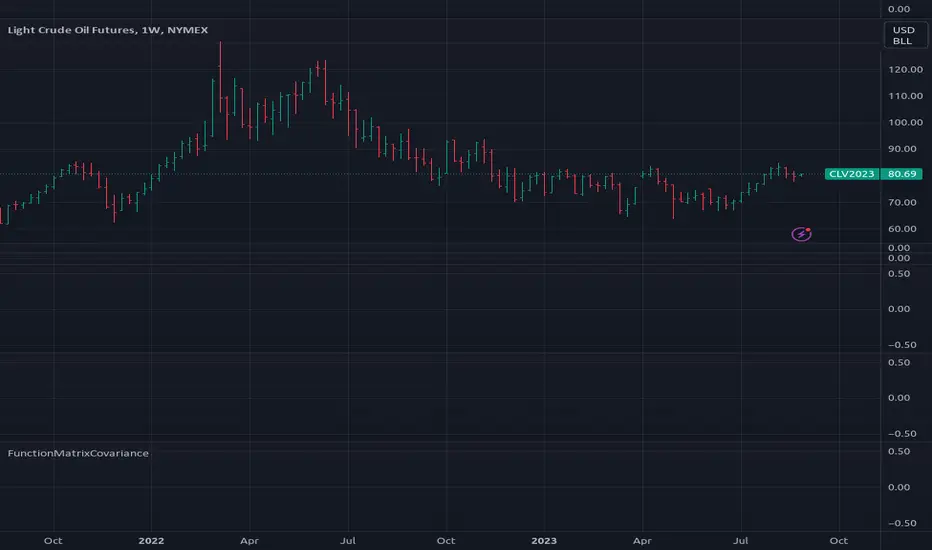
FunctionMatrixCovarianceLibrary "FunctionMatrixCovariance"
In probability theory and statistics, a covariance matrix (also known as auto-covariance matrix, dispersion matrix, variance matrix, or variance–covariance matrix) is a square matrix giving the covariance between each pair of elements of a given random vector.
Intuitively, the covariance matrix generalizes the notion of variance to multiple dimensions. As an example, the variation in a collection of random points in two-dimensional space cannot be characterized fully by a single number, nor would the variances in the `x` and `y` directions contain all of the necessary information; a `2 × 2` matrix would be necessary to fully characterize the two-dimensional variation.
Any covariance matrix is symmetric and positive semi-definite and its main diagonal contains variances (i.e., the covariance of each element with itself).
The covariance matrix of a random vector `X` is typically denoted by `Kxx`, `Σ` or `S`.
~wikipedia.
method cov(M, bias)
Estimate Covariance matrix with provided data.
Namespace types: matrix
Parameters:
M (matrix) : `matrix` Matrix with vectors in column order.
bias (bool)
Returns: Covariance matrix of provided vectors.
---
en.wikipedia.org
numpy.org
debugLibrary "debug"
Show Array or Matrix Elements In Table
Use anytime you want to see the elements in an array or a matrix displayed.
Effective debugger, particularly for strategies and complex logic structures.
Look in code to find instructions. Reach out if you need assistance.
Functionality includes:
Viewing the contents of an array or matrix on screen.
Track variables and variable updates using debug()
Track if and when local scopes fire using debugs()
Types Allowed:
string
float
int
string
debug(_col, _row, _name, _value, _msg, _ip)
Debug Variables in Matrix
Parameters:
_col (int) : (int) Assign Column
_row (int) : (int) Assign Row
_name (matrix) : (simple matrix) Matrix Name
_value (string) : (string) Assign variable as a string (str.tostring())
_msg (string)
_ip (int) : (int) (default 1) 1 for continuous updates. 2 for barstate.isnew updates. 3 for barstate.isconfirmed updates. -1 to only add once
Returns: Returns Variable _value output and _msg formatted as '_msg: variableOutput' in designated column and row
debug(_col, _row, _name, _value, _msg, _ip)
Parameters:
_col (int)
_row (int)
_name (matrix)
_value (float)
_msg (string)
_ip (int)
debug(_col, _row, _name, _value, _msg, _ip)
Parameters:
_col (int)
_row (int)
_name (matrix)
_value (int)
_msg (string)
_ip (int)
debug(_col, _row, _name, _value, _msg, _ip)
Parameters:
_col (int)
_row (int)
_name (matrix)
_value (bool)
_msg (string)
_ip (int)
debugs(_col, _row, _name, _msg)
Debug Scope in Matrix - Identify When Scope Is Accessed
Parameters:
_col (int) : (int) Column Number
_row (int) : (int) Row Number
_name (matrix) : (simple matrix) Matrix Name
_msg (string) : (string) Message
Returns: Message appears in debug panel using _col/_row as the identifier
viewArray(_arrayName, _pos, _txtSize, _tRows, s_index, s_border, _rowCol, bCol, _fillCond, _offset)
Array Element Display (Supports float , int , string , and bool )
Parameters:
_arrayName (float ) : ID of Array to be Displayed
_pos (string) : Position for Table
_txtSize (string) : Size of Table Cell Text
_tRows (int) : Number of Rows to Display Data In (columns will be calculated accordingly)
s_index (bool) : (Optional. Default True.) Show/Hide Index Numbers
s_border (bool) : (Optional. Default False.) Show/Hide Border
_rowCol (string)
bCol (color) : = (Optional. Default Black.) Frame/Border Color.
_fillCond (bool) : (Optional) Conditional statement. Function displays array only when true. For instances where size is not immediately known or indices are na. Default = true, indicating array size is set at bar_index 0.
_offset (int) : (Optional) Use to view historical array states. Default = 0, displaying realtime bar.
Returns: A Display of Array Values in a Table
viewArray(_arrayName, _pos, _txtSize, _tRows, s_index, s_border, _rowCol, bCol, _fillCond, _offset)
Parameters:
_arrayName (int )
_pos (string)
_txtSize (string)
_tRows (int)
s_index (bool)
s_border (bool)
_rowCol (string)
bCol (color)
_fillCond (bool)
_offset (int)
viewArray(_arrayName, _pos, _txtSize, _tRows, s_index, s_border, _rowCol, bCol, _fillCond, _offset)
Parameters:
_arrayName (string )
_pos (string)
_txtSize (string)
_tRows (int)
s_index (bool)
s_border (bool)
_rowCol (string)
bCol (color)
_fillCond (bool)
_offset (int)
viewArray(_arrayName, _pos, _txtSize, _tRows, s_index, s_border, _rowCol, bCol, _fillCond, _offset)
Parameters:
_arrayName (bool )
_pos (string)
_txtSize (string)
_tRows (int)
s_index (bool)
s_border (bool)
_rowCol (string)
bCol (color)
_fillCond (bool)
_offset (int)
viewMatrix(_matrixName, _pos, _txtSize, s_index, _resetIdx, s_border, bCol, _fillCond, _offset)
Matrix Element Display (Supports , , , and )
Parameters:
_matrixName (matrix) : ID of Matrix to be Displayed
_pos (string) : Position for Table
_txtSize (string) : Size of Table Cell Text
s_index (bool) : (Optional. Default True.) Show/Hide Index Numbers
_resetIdx (bool)
s_border (bool) : (Optional. Default False.) Show/Hide Border
bCol (color) : = (Optional. Default Black.) Frame/Border Color.
_fillCond (bool) : (Optional) Conditional statement. Function displays matrix only when true. For instances where size is not immediately known or indices are na. Default = true, indicating matrix size is set at bar_index 0.
_offset (int) : (Optional) Use to view historical matrix states. Default = 0, displaying realtime bar.
Returns: A Display of Matrix Values in a Table
viewMatrix(_matrixName, _pos, _txtSize, s_index, _resetIdx, s_border, bCol, _fillCond, _offset)
Parameters:
_matrixName (matrix)
_pos (string)
_txtSize (string)
s_index (bool)
_resetIdx (bool)
s_border (bool)
bCol (color)
_fillCond (bool)
_offset (int)
viewMatrix(_matrixName, _pos, _txtSize, s_index, _resetIdx, s_border, bCol, _fillCond, _offset)
Parameters:
_matrixName (matrix)
_pos (string)
_txtSize (string)
s_index (bool)
_resetIdx (bool)
s_border (bool)
bCol (color)
_fillCond (bool)
_offset (int)
viewMatrix(_matrixName, _pos, _txtSize, s_index, _resetIdx, s_border, bCol, _fillCond, _offset)
Parameters:
_matrixName (matrix)
_pos (string)
_txtSize (string)
s_index (bool)
_resetIdx (bool)
s_border (bool)
bCol (color)
_fillCond (bool)
_offset (int)

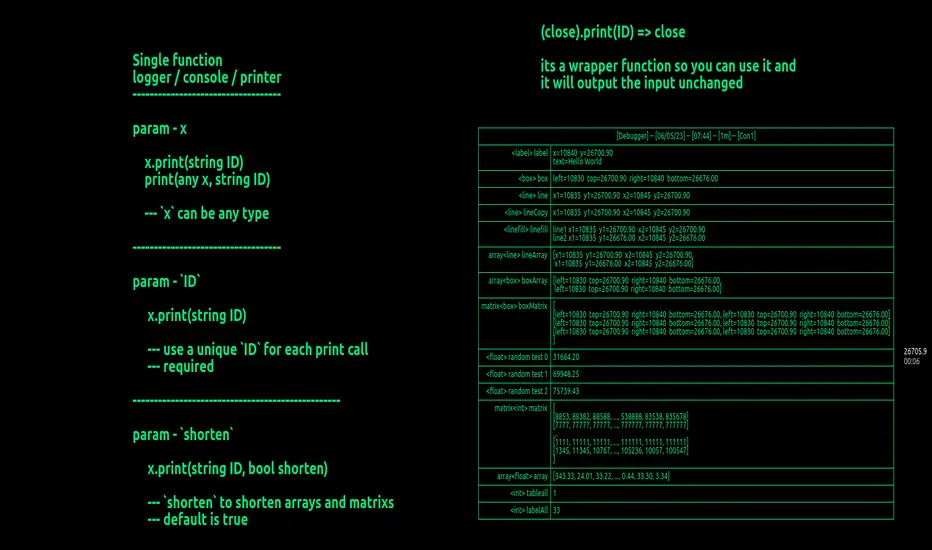
.print()
You don't need to initialize anything..
After you import the library you can use .print() as easy as that..!
Hope this helps
* use a unique ID for each .print() call
let me know if you run into any bugs
by trying to make it as user friendly as possible i had to do
some not ideal things so there's a chance it could present some bugs with
a lot of labels present on the chart
and if you use label.all to parse and manipulate the labels on the chart..
most likely it will cause an issue but not a lot of people use this so
I don't think that will be a problem.
thanks,
FFriZz | frizlabz
Library "print"
Single function to print any type to console
method str(inp)
`method` convert all types to string
```
(overload)
*.str(any inp) => string
```
Namespace types: series string, simple string, input string, const string
Parameters:
inp (string) : `any` - desc | Required
Returns: `string` formatted string
method str(inp)
Namespace types: series int, simple int, input int, const int
Parameters:
inp (int)
method str(inp)
Namespace types: series float, simple float, input float, const float
Parameters:
inp (float)
method str(inp)
Namespace types: series bool, simple bool, input bool, const bool
Parameters:
inp (bool)
method str(inp)
Namespace types: series linefill
Parameters:
inp (linefill)
method str(inp)
Namespace types: series line
Parameters:
inp (line)
method str(inp)
Namespace types: series box
Parameters:
inp (box)
method str(inp)
Namespace types: series label
Parameters:
inp (label)
method str(inp)
Namespace types: matrix
Parameters:
inp (matrix)
method str(inp)
Namespace types: matrix
Parameters:
inp (matrix)
method str(inp)
Namespace types: matrix
Parameters:
inp (matrix)
method str(inp)
Namespace types: matrix
Parameters:
inp (matrix)
method str(inp)
Namespace types: matrix
Parameters:
inp (matrix)
method str(inp)
Namespace types: matrix
Parameters:
inp (matrix)
method str(inp)
Namespace types: matrix
Parameters:
inp (matrix)
method str(inp)
Namespace types: matrix
Parameters:
inp (matrix)
method str(inp)
Namespace types: linefill
Parameters:
inp (linefill )
method str(inp)
Namespace types: line
Parameters:
inp (line )
method str(inp)
Namespace types: box
Parameters:
inp (box )
method str(inp)
Namespace types: label
Parameters:
inp (label )
method str(inp)
Namespace types: string
Parameters:
inp (string )
method str(inp)
Namespace types: int
Parameters:
inp (int )
method str(inp)
Namespace types: float
Parameters:
inp (float )
method str(inp)
Namespace types: bool
Parameters:
inp (bool )
method arrayShorten(str)
arrayShorten
Namespace types: series string, simple string, input string, const string
Parameters:
str (string) : `string` - the string to shorten | Required
Returns: `string` - a shortened version of the input string if it is an array with more than 7 elements, otherwise the original string
method matrixShorten(str)
matrixShorten
Namespace types: series string, simple string, input string, const string
Parameters:
str (string) : `string` - the string to shorten | Required
Returns: `string` - the shortened matrix string if the input is a matrix, otherwise returns the input string as is
method print(x, ID)
print all types to theh same console with just this `method/function`
```
(overload)
*.print(any x, string ID, bool shorten=true?) => console
"param 'shorten' - only for arrays and matrixs" | true
```
Namespace types: series string, simple string, input string, const string
Parameters:
x (string) : - `any` input to convert
ID (string) : - `string` unique id for label on console `MUST BE UNIQUE`
Returns: adds the `ID` and the `inp` to the console on the chart
method print(x, ID)
Namespace types: series float, simple float, input float, const float
Parameters:
x (float)
ID (string)
method print(x, ID)
Namespace types: series int, simple int, input int, const int
Parameters:
x (int)
ID (string)
method print(x, ID)
Namespace types: series box
Parameters:
x (box)
ID (string)
method print(x, ID)
Namespace types: series bool, simple bool, input bool, const bool
Parameters:
x (bool)
ID (string)
method print(x, ID)
Namespace types: series label
Parameters:
x (label)
ID (string)
method print(x, ID)
Namespace types: series line
Parameters:
x (line)
ID (string)
method print(x, ID)
Namespace types: series linefill
Parameters:
x (linefill)
ID (string)
method print(x, ID, shorten)
Namespace types: string
Parameters:
x (string )
ID (string)
shorten (bool)
method print(x, ID, shorten)
Namespace types: float
Parameters:
x (float )
ID (string)
shorten (bool)
method print(x, ID, shorten)
Namespace types: int
Parameters:
x (int )
ID (string)
shorten (bool)
method print(x, ID, shorten)
Namespace types: box
Parameters:
x (box )
ID (string)
shorten (bool)
method print(x, ID, shorten)
Namespace types: bool
Parameters:
x (bool )
ID (string)
shorten (bool)
method print(x, ID, shorten)
Namespace types: label
Parameters:
x (label )
ID (string)
shorten (bool)
method print(x, ID, shorten)
Namespace types: line
Parameters:
x (line )
ID (string)
shorten (bool)
method print(x, ID, shorten)
Namespace types: linefill
Parameters:
x (linefill )
ID (string)
shorten (bool)
method print(x, ID, shorten)
Namespace types: matrix
Parameters:
x (matrix)
ID (string)
shorten (bool)
method print(x, ID, shorten)
Namespace types: matrix
Parameters:
x (matrix)
ID (string)
shorten (bool)
method print(x, ID, shorten)
Namespace types: matrix
Parameters:
x (matrix)
ID (string)
shorten (bool)
method print(x, ID, shorten)
Namespace types: matrix
Parameters:
x (matrix)
ID (string)
shorten (bool)
method print(x, ID, shorten)
Namespace types: matrix
Parameters:
x (matrix)
ID (string)
shorten (bool)
method print(x, ID, shorten)
Namespace types: matrix
Parameters:
x (matrix)
ID (string)
shorten (bool)
method print(x, ID, shorten)
Namespace types: matrix
Parameters:
x (matrix)
ID (string)
shorten (bool)
method print(x, ID, shorten)
Namespace types: matrix
Parameters:
x (matrix)
ID (string)
shorten (bool)
Crypto Correlation MatrixA crypto correlation matrix or table is a tool that displays the correlation between different cryptocurrencies and other financial assets. The matrix provides an overview of the degree to which various cryptocurrencies move in tandem or independently of each other. Each cell represents the correlation between the row and column assets respectively.
The correlation matrix can be useful for traders and investors in several ways:
First, it allows them to identify trends and patterns in the behavior of different cryptocurrencies. By looking at the correlations between different assets, traders can gain insight into the intra-relationships of the crypto market and make more informed trading decisions. For example, if two cryptocurrencies have a high positive correlation, meaning that they tend to move in the same direction, a trader may want to diversify their portfolio by choosing to invest in only one of the two assets.
Additionally, the correlation matrix can help traders and investors to manage risk. By analyzing the correlations between different assets, traders can identify opportunities to hedge their positions or limit their exposure to particular risks. For example, if a trader holds a portfolio of cryptocurrencies that are highly correlated with each other, they may be at greater risk of losses if the market moves against them. By diversifying their portfolio with assets that are less correlated with each other, they can reduce their overall risk.
Some of the unique properties for this specific script are the correlation strength levels in conjunction with the color gradient of cells, intended for clearer readability.
Features:
Supports up to 64 different crypto assets.
Dark/Light mode.
Correlation strength levels and cell coloring.
Adjustable positioning on the chart.
Alerts at the close of a bar. (Daily timeframe or higher recommended)

Volume Profile Matrix [LuxAlgo]The Volume Profile Matrix indicator extends from regular volume profiles by also considering calculation intervals within the calculation window rather than only dividing the calculation window in rows.
Note that this indicator is subject to repainting & back-painting, however, treating the indicator as a tool for identifying frequent points of interest can still be very useful.
🔶 SETTINGS
Lookback: Number of most recent bars used to calculate the indicator.
Columns: Number of columns (intervals) used to calculate the volume profile matrix.
Rows: Number of rows (intervals) used to calculate the volume profile matrix.
🔶 USAGE
The Volume Profile Matrix indicator can be used to obtain more information regarding liquidity on specific time intervals. Instead of simply dividing the calculation window into equidistant rows, the calculation is done through a grid.
Grid cells with trading activity occurring inside them are colored. More activity is highlighted through a gradient and by default, cells with a color that are closer to red indicate that more trading activity took place within that cell. The cell with the highest amount of trading activity is always highlighted in yellow.
Each interval (column) includes a point of control which highlights an estimate of the price level with the highest traded volume on that interval. The level with the highest traded volume of the overall grid is extended to the most recent bar.

toolsLibrary "tools"
A library of many helper methods, plus a comprehensive print method and a printer object.
This is a newer version of the helpers library. This script uses pinescripts v5 latest objects and methods.

PSv5 3D Array/Matrix Super Hack"In a world of ever pervasive and universal deceit, telling a simple truth is considered a revolutionary act."
INTRO:
First, how about a little bit of philosophic poetry with another dimension applied to it?
The "matrix of control" is everywhere...
It is all around us, even now in the very place you reside. You can see it when you look at your digitized window outwards into the world, or when you turn on regularly scheduled television "programs" to watch news narratives and movies that subliminally influence your thoughts, feelings, and emotions. You have felt it every time you have clocked into dead end job workplaces... when you unknowingly worshiped on the conformancy alter to cultish ideologies... and when you pay your taxes to a godvernment that is poisoning you softly and quietly by injecting your mind and body with (psyOps + toxicCompounds). It is a fictitiously generated world view that has been pulled over your eyes to blindfold, censor, and mentally prostrate you from spiritually hearing the real truth.
What TRUTH you must wonder? That you are cognitively enslaved, like everyone else. You were born into mental bondage, born into an illusory societal prison complex that you are entirely incapable of smelling, tasting, or touching. Its a contrived monetary prison enterprise for your mind and eternal soul, built by pretending politicians, corporate CONartists, and NonGoverning parasitic Organizations deploying any means of infiltration and deception by using every tactic unimaginable. You are slowly being convinced into becoming a genetically altered cyborg by acclimation, socially engineered and chipped to eventually no longer be 100% human.
Unfortunately no one can be told eloquently enough in words what the matrix of control truly is. You have to experience it and witness it for yourself. This is your chance to program a future paradigm that doesn't yet exist. After visiting here, there is absolutely no turning back. You can continually take the blue pill BIGpharmacide wants you to repeatedly intake. The story ends if you continually sleep walk through a 2D hologram life, believing whatever you wish to believe until you cease to exist. OR, you can take the red pill challenge, explore "question every single thing" wonderland, program your arse off with 3D capabilities, ultimately ascertaining a new mathematical empyrean. Only then can you fully awaken to discover how deep the rabbit hole state of affairs transpire worldwide with a genuine open mind.
Remember, all I'm offering is a mathematical truth, nothing more...
PURPOSE:
With that being said above, it is now time for advanced developers to start creating their own matrix constructs in 3D, in Pine, just as the universe is created spatially. For those of you who instantly know what this script's potential is easily capable of, you already know what you have to do with it. While this is simplistically just a 3D array for either integers or floats, additional companion functions can in the future be constructed by other members to provide a more complete matrix/array library for millions of folks on TV. I do encourage the most courageous of mathemagicians on TV to do so. I have been employing very large 2D/3D array structures for quite some time, and their utility seems to be of great benefit. Discovering that for myself, I fully realized that Pine is incomplete and must be provided with this agility to process complex datasets that traders WILL use in the future. Mark my words!
CONCEPTION:
While I have long realized and theorized this code for a great duration of time, I was finally able to turn it into a Pine reality with the assistance and training of an "artificially intuitive" program while probing its aptitude. Even though it knows virtually nothing about Pine Script 4.0 or 5.0 syntax, functions, and behavior, I was able to conjure code into an identity similar to what you see now within a few minutes. Close enough for me! Many manual edits later for pine compliance, and I had it in chart, presto!
While most people consider the service to be an "AI", it didn't pass my Pine Turing test. I did have to repeatedly correct it, suffered through numerous apologies from it, was forced to use specifically tailored words, and also rationally debate AND argued with it. It is a handy helper but beware of generating Pine code from it, trust me on this one. However... this artificially intuitive service is currently available in its infancy as version 3. Version 4 most likely will have more diversity to enhance my algorithmic expertise of Pine wizardry. I do have to thank E.M. and his developers for an eye opening experience, or NONE of this code below would be available as you now witness it today.
LIMITATIONS:
As of this initial release, Pine only supports 100,000 array elements maximum. For example, when using this code, a 50x50x40 element configuration will exceed this limit, but 50x50x39 will work. You will always have to keep that in mind during development. Running that size of an array structure on every single bar will most likely time out within 20-40 seconds. This is not the most efficient method compared to a real native 3D array in action. Ehlers adepts, this might not be 100% of what you require to "move forward". You can try, but head room with a low ceiling currently will be challenging to walk in for now, even with extremely optimized Pine code.
A few common functions are provided, but this can be extended extensively later if you choose to undertake that endeavor. Use the code as is and/or however you deem necessary. Any TV member is granted absolute freedom to do what they wish as they please. I ultimately wish to eventually see a fully equipped library version for both matrix3D AND array3D created by collaborative efforts that will probably require many Pine poets testing collectively. This is just a bare bones prototype until that day arrives. Considerably more computational server power will be required also. Anyways, I hope you shall find this code somewhat useful.
Notice: Unfortunately, I will not provide any integration support into members projects at all. I have my own projects that require too much of my time already.
POTENTIAL APPLICATIONS:
The creation of very large coefficient 3D caches/buffers specifically at bar_index==0 can dramatically increase runtime agility for thousands of bars onwards. Generating 1000s of values once and just accessing those generated values is much faster. Also, when running dozens of algorithms simultaneously, a record of performance statistics can be kept, self-analyzed, and visually presented to the developer/user. And, everything else under the sun can be created beyond a developers wildest dreams...
EPILOGUE:
Free your mind!!! And unleash weapons of mass financial creation upon the earth for all to utilize via the "Power of Pine". Flying monkeys and minions are waging economic sabotage upon humanity, decimating markets and exchanges. You can always see it your market charts when things go horribly wrong. This is going to be an astronomical technical challenge to continually navigate very choppy financial markets that are increasingly becoming more and more unstable and volatile. Ordinary one plot algorithms simply are not enough anymore. Statistics and analysis sits above everything imagined. This includes banking, godvernment, corporations, REAL science, technology, health, medicine, transportation, energy, food, etc... We have a unique perspective of the world that most people will never get to see, depending on where you look. With an ever increasingly complex world in constant dynamic flux, novel ways to process data intricately MUST emerge into existence in order to tackle phenomenal tasks required in the future. Achieving data analysis in 3D forms is just one lonely step of many more to come.
At this time the WesternEconomicFraudsters and the WorldHealthOrders are attempting to destroy/reset the world's financial status in order to rain in chaos upon most nations, causing asset devaluation and hyper-inflation. Every form of deception, infiltration, and theft is occurring with a result of destroyed wealth in preparation to consolidate it. Open discussions, available to the public, by world leaders/moguls are fantasizing about new dystopian system as a one size fits all nations solution of digitalID combined with programmableDemonicCurrencies to usher in a new form of obedient servitude to a unipolar digitized hegemony of monetary vampires. If they do succeed with economic conquest, as they have publicly stated, people will be converted into human cattle, herded within smart cities, you will own nothing, eat bugs for breakfast/lunch/dinner, live without heat during severe winter conditions, and be happy. They clearly haven't done the math, as they are far outnumbered by a ratio of 1 to millions. Sith Lords do not own planet Earth! The new world disorder of human exploitation will FAIL. History, my "greatest teacher" for decades reminds us over, and over, and over again, and what are time series for anyways? They are for an intense mathematical analysis of prior historical values/conditions in relation to today's values/conditions... I imagine one day we will be able to ask an all-seeing AI, "WHO IS TO BLAME AND WHY AND WHEN?" comprised of 300 pages in great detail with images, charts, and statistics.
What are the true costs of malignant lies? I will tell you... 64bit numbers are NOT even capable of calculating the extreme cost of pernicious lies and deceit. That's how gigantic this monstrous globalization problem has become and how awful the "matrix of control" truly is now. ALL nations need a monumental revision of its CODE OF ETHICS, and that's definitely a multi-dimensional problem that needs solved sooner than later. If it was up to me, economies and technology would be developed so extensively to eliminate scarcity and increase the standard of living so high, that the notion of war and conflict would be considered irrelevant and extremely appalling to the future generations of humanity, our grandchildren born and unborn. The future will not be owned and operated by geriatric robber barons destined to expire quickly. The future will most likely be intensely "guided" by intelligent open source algorithms that youthful generations will inherit as their birth right.
P.S. Don't give me that politco-my-diction crap speech below in comments. If they weren't meddling with economics mucking up 100% of our chart results in 100% of tickers, I wouldn't have any cause to analyze any effects generated by them, nor provide this script's code. I am performing my analytical homework, but have you? Do you you know WHY international affairs are in dire jeopardy? Without why, the "Power of Pine" would have never existed as it specifically does today. I'm giving away much of my mental power generously to TV members so you are specifically empowered beyond most mathematical agilities commonly existing. I'm just a messenger of profound ideas. Loving and loathing of words is ALWAYS in the eye of beholders, and that's why the freedom of speech is enshrined as #1 in the constitutional code of the USA. Without it, this entire site might not have been allowed to exist from its founder's inceptions.
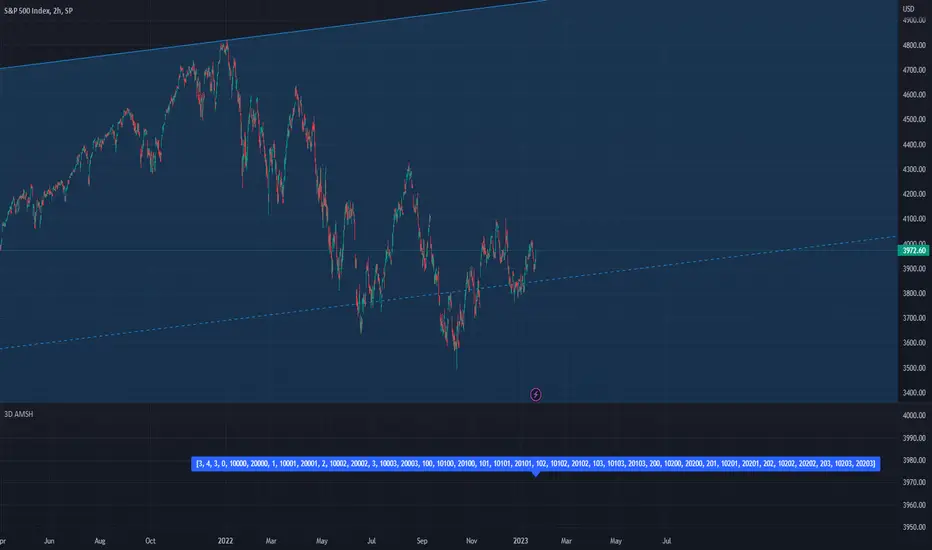
columnsLibrary "columns"
Error Tolerant Matrix Setter/Getter Operations. Easy ways to add/remove items into start and end of Columns as well as arrays to grow and shrink matrix.
if mismatched sizes occur the typified NA value will be there to prevent catastrophic crashing.
Rows and Columns are split into 2 libraries due to limitations on number of exports as well as ease of style (columns.shift(), rows.pop() )
pop(_matrix)
do pop last Column off of matrix
Parameters:
_matrix : Matrix To Edit
Returns: Array of Last Column, removing it from matrix
shift(_matrix)
do shift the first Column off of matrix
Parameters:
_matrix : Matrix To Edit
Returns: Array of First Column, removing it from matrix
get(_matrix, _clmnNum)
retrieve specific Column of matrix
Parameters:
_matrix : Matrix To Edit
_clmnNum : Column being Targeted
Returns: Array of selected Column number, leaving in place
push(_matrix, _clmnNum, _item)
add single item onto end of Column
Parameters:
_matrix : Matrix To Edit
_clmnNum : Column being Targeted
_item : Item to Push on Column
Returns: shifted item from Column start
push(_matrix, _array)
add single item onto end of matrix
Parameters:
_matrix : Matrix To Edit
_array : Array to Push on Matrix
Returns: Void
unshift(_matrix, _clmnNum, _item)
slide single item into start of Column remove last
Parameters:
_matrix : Matrix To Edit
_clmnNum : Column being Targeted
_item : Item to Unshift on Column
Returns: popped item from Column end
unshift(_matrix, _array)
add single item into first Column of matrix
Parameters:
_matrix : Matrix To Edit
_array : Array to unshift into Matrix
Returns: Void
set(_matrix, _clmnNum, _array)
replace an array to an existing Column
Parameters:
_matrix : Matrix To Edit
_clmnNum : Column being Targeted
_array : Array to place in Matrix
Returns: Column that was replaced
insert(_matrix, _clmnNum, _array)
insert an array to a new Column
Parameters:
_matrix : Matrix To Edit
_clmnNum : Column being Targeted
_array : Array to place in Matrix
Returns: void
slideDown(_matrix, _array)
add single item onto end of Column
Parameters:
_matrix : Matrix To Edit
_array : Array to push to Matrix
Returns: shifted first Column
slideUp(_matrix, _array)
add single item onto end of Column
Parameters:
_matrix : Matrix To Edit
_array : Array to unshift to Matrix
Returns: poppeed last Column
pullOut(_matrix, _clmnNum)
add single item onto end of Column
Parameters:
_matrix : Matrix To Edit
_clmnNum : Column being Targeted
Returns: removed selected Column

rowsLibrary "rows"
Error Tolerant Matrix Setter/Getter Operations. Easy ways to add/remove items into start and end of rows as well as arrays to grow and shrink matrix.
if mismatched sizes occur the typified NA value will be there to prevent catastrophic crashing.
columns and rows are split into 2 libraries due to limitations on number of exports as well as ease of style (columns.shift(), rows.pop() )
pop(_matrix)
do pop last row off of matrix
Parameters:
_matrix : Matrix To Edit
Returns: Array of Last row, removing it from matrix
shift(_matrix)
do shift the first row off of matrix
Parameters:
_matrix : Matrix To Edit
Returns: Array of First row, removing it from matrix
get(_matrix, _rowNum)
retrieve specific row of matrix
Parameters:
_matrix : Matrix To Edit
_rowNum : Row being Targeted
Returns: Array of selected row number, leaving in place
push(_matrix, _rowNum, _item)
add single item onto end of row
Parameters:
_matrix : Matrix To Edit
_rowNum : Row being Targeted
_item : Item to Push on Row
Returns: shifted item from row start
push(_matrix, _array)
add single item onto end of matrix
Parameters:
_matrix : Matrix To Edit
_array : Array to Push on Matrix
Returns: Void
unshift(_matrix, _rowNum, _item)
slide single item into start of row remove last
Parameters:
_matrix : Matrix To Edit
_rowNum : Row being Targeted
_item : Item to Unshift on Row
Returns: popped item from row end
unshift(_matrix, _array)
add single item into first row of matrix
Parameters:
_matrix : Matrix To Edit
_array : Array to unshift into Matrix
Returns: Void
set(_matrix, _rowNum, _array)
replace an array to an existing row
Parameters:
_matrix : Matrix To Edit
_rowNum : Row being Targeted
_array : Array to place in Matrix
Returns: row that was replaced
insert(_matrix, _rowNum, _array)
insert an array to a new row
Parameters:
_matrix : Matrix To Edit
_rowNum : Row being Targeted
_array : Array to place in Matrix
Returns: void
slideDown(_matrix, _array)
add single item onto end of row
Parameters:
_matrix : Matrix To Edit
_array : Array to push to Matrix
Returns: shifted first row
slideUp(_matrix, _array)
add single item onto end of row
Parameters:
_matrix : Matrix To Edit
_array : Array to unshift to Matrix
Returns: popped last row
pullOut(_matrix, _rowNum)
add single item onto end of row
Parameters:
_matrix : Matrix To Edit
_rowNum : Row being Targeted
Returns: removed selected row
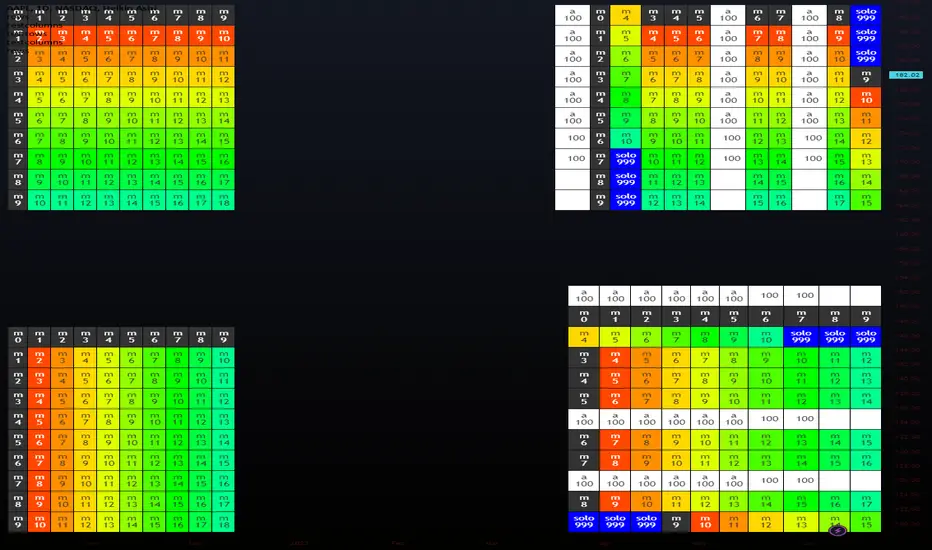
intoLibrary "into"
convert literals by type,
Same-types left in for bulk reasons.
TODO: Expand Types
b(string)
Convert string to bool.
Parameters:
string : val A string value.
Returns: Bool.
b(bool)
Pass Bool/bool
Parameters:
bool :
Returns: Bool.
b(float)
Convert Float (True if exists and not 0)
Parameters:
float : val A float value.
Returns: Bool.
b(int)
Convert integer (True if exists and not 0)
Parameters:
int : val An integer value.
Returns: Bool.
f(bool)
Convert bool to float.
Parameters:
bool : val A boolean value.
Returns: Float.
f(string, int)
Convert with decimal
Parameters:
string : val A string value.
int : decimals Decimal places. def = 6
Returns: Float.
f(float, int)
Convert float bypass with decimals
Parameters:
float : val A float value.
int : decimals Decimal places. def = 6
Returns: Float.
f(int)
Convert integer to float.
Parameters:
int : val An integer value.
Returns: Float.
i(bool)
Convert bool to int.
Parameters:
bool : val A boolean value.
Returns: Int.
i(string)
Convert string number to int.
Parameters:
string : val A string value.
Returns: Int.
i(float)
Convert float to int.
Parameters:
float : val A float value.
Returns: Int.
i(int)
Convert int to int.
Parameters:
int : val An int value.
Returns: Int.
s(bool)
Convert bool value to string.
Parameters:
bool : val A boolean value.
Returns: String.
s(str)
bypass string
Parameters:
str : val A string value.
Returns: String.
s(float)
Convert float value to string.
Parameters:
float : val A float value.
Returns: String.
s(int)
Convert int value to string.
Parameters:
int : val An integer value.
Returns: String.
s(val)
Array Convert Each Item
Parameters:
val : Array Input (Str,Bool,Int,Float)
Returns: String.
s(val)
Array Convert Each Item
Parameters:
val : Array Input (Str,Bool,Int,Float)
Returns: String.
s(val)
Array Convert Each Item
Parameters:
val : Array Input (Str,Bool,Int,Float)
Returns: String.
s(val)
Array Convert Each Item
Parameters:
val : Array Input (Str,Bool,Int,Float)
Returns: String.
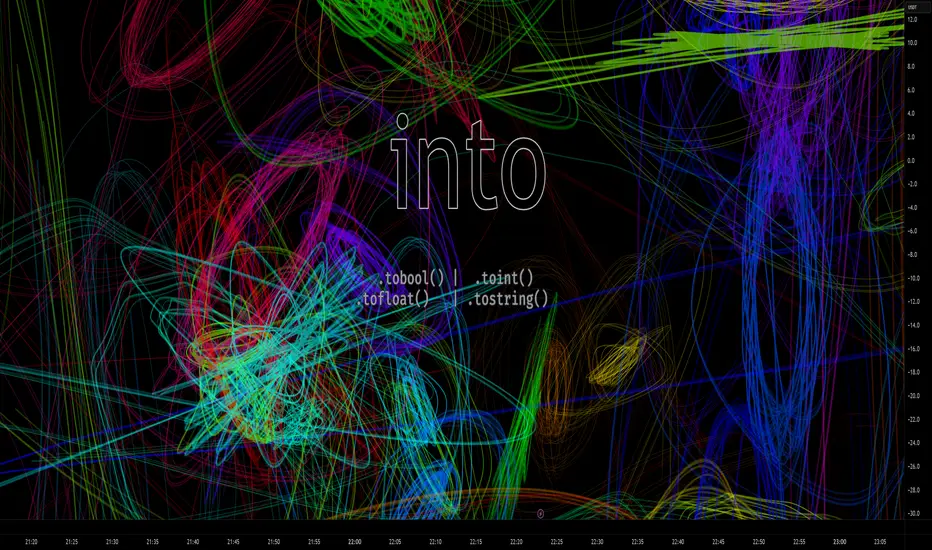
Support Resistance Channels/Zones Multi Time FrameHello All,
For long time I have been getting a lot of requests for Support/Resistance Multi Time Frame script. Here ' Support Resistance Channels/Zones Multi Time Frame ' is in your service.
This script works if the Higher Time Frame you set is higher than the chart time frame. so the time frame in the options should be higher than the chart time frame.
The script checks total bars and highest/lowest in visible part of the chart and shows all S/R zones that fits according the highest/lowest in visible part. you can see screenshots below if it didn't make sense or if you didn't understand
Let see the options:
Higher Time Frame : the time frame that will be used to get Support/Resistance zones, should be higher than chart time frame
Pivot Period : is the number to find the Pivot Points on Higher time frame, these pivot points are used while calculating the S/R zones
Loopback Period : is the number of total bars on higher time frame which is used while finding pivot points
Maximum Channel Width % : is the percent for maximum width for each channel
Minimum Strength : each zone should contain at least a 1 or more pivot points, you set it here. (Open/High/Low/Close also are considered while calculating the strength)
Maximum Number of S/R : the number of maximum Support/Resistance zones. there can be less S/Rs than this number if it can not find enough S/Rs
Show S/R that fits the Chart : because of we use higher time frame, you should enable this option then the script shows only S/Rs that fits the current chart. if you disable this option, all S/R zones are shown and it may shrink the chart. also you may not see any S/R zone if you don't choose the higher time frame wisely ;)
Show S/R channels in a table : if you enable this option (by default it's enabled) then lower/upper bands of all S/R zones shown in a table ( even if it doesn't fit the chart ). you can change its location. zones are sorted according to their strengths. first one is the strongest.
and the other options is about colors and transparency.
Screenshots before and after zoom-out:
after zoom-out number of visible bars and highest/lowest change and it shows more S/R zones that fits the current chart!
if you see Support Resistance zone like below then you should decrease ' Maximum Channel Width ' or you should set higher time frame better:
You can change colors and transparency:
You can change Table location:
Alerts added :)
P.S. I haven't tested it so much, if you see any issue please drop a comment or send me message
Enjoy!
