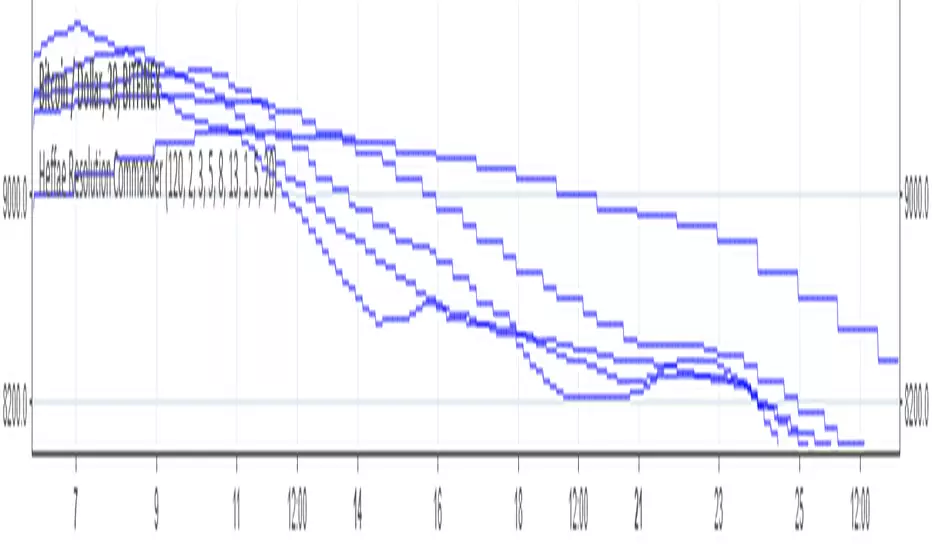
Heffae Resolution CommanderThis is a script to call resolutions with some math on top of your base resolution.
THIS IS NOT AN INDICATOR TO USE ON A CHART!!! The resolution call function is really useful for your own scripting ideas!
Using the modulo operator to quantize integer values, it works by converting the modified resolution integer to a 4 digit string value.
The function within this script is what is valuable, use it within your own scripts to call funny resolutions otherwise difficult to calculate.
You cannot add series expressions to the resolution value since pine does not allow "series " as a resolution for a security call
However, you could easily stack a crapload of these together and use
an expression to switch the referenced security function for your purposes.
The SMA and plot overlay are just there to show a visual example of how the function works.
You can view the raw timeframe output integer by getting rid of tostring(x) and // out the security calls,
plotting the raw function outputs.
For those interested in the verbose version of the timeframe mod function, showing all the steps, here is a pastebin:
pastebin.com
Cheers! Drop a line / comment if you enjoy or have any questions on how to integrate this into your script@!
The Modulo operator is so much fun!
Security
Security Tracker - BronzeThis Indicator will be the most simple form of this code, with Silver and Gold versions to come.
Tracked Security - BTCUSD in this example but can be changed anything.
Index - Current Security / Tracked Security
Inverse Index - (1 / Index)
(Current Security = ETHUSD in this example)
Works across all periods and Securities.
Can format lines and colours, but won't be appropriate to plot all three lines at once.
Easily see currency pair without cluttering up your chart or requiring another chart (especially for members with free subscriptions).
Can be BTC vs SNP...if you wanted, something which you couldn't find in the standard list.
I have experimented with several combinations, but if there are any issues, let me know.

C320up RSI Compare X2C320up RSI Compare X2
- Compare the strength of any two securities at once including Bitcoin and EOS shorts and longs.
Simply click on the Ticker Input, type the first letter or two of the security you wish to compare then select from the list.
All tickers listed on TradingView are available.
Default settings are a black line for the first ticker (Bitcoin), and gray for the second (EOS), with the RSI length set at 14.
You can change these colours to suit your preferences.
For example, let’s say you wanted to compare EOS shorts and longs, search for EOSUSDSHORTS and EOSUSDLONGS, and change the colour of the first line to red for shorts, and change the second to green for longs.
You can also change the background colour, and adjust the 70% and 30% lines to suit.
Any questions, just leave a comment.
Check out our scripts page for more indicators.
Happy Trading!

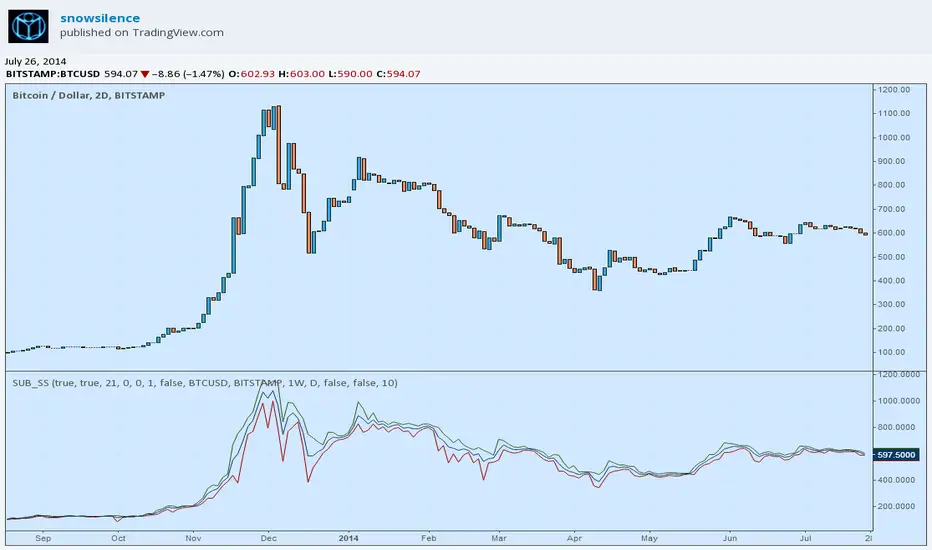
Substratum Module [snowsilence]This module is meant to act as a framework and platform over which to develop other indicators. On its own it does essentially nothing, yet simplifies the work of adding basic customizations and flexibility to ideas immediately. The chart on this post is not a demo, so its better to just try adding the indicator to a test chart — you may find it more convenient to set "overlay=true" in the study header — and look into the settings for an intuitive sense of its purpose.
Please build off of this, let me know if you find it useful, and credit/reference me where it seems reasonable. Feedback is always appreciated!