Breton Composite BTC Volume -turningpoint -strategyComposite BTCUSD Volume strategy compiled from 9 different exchanges, attempting to isolate turning points by trading on volume spikes and bag holding bars
Volume

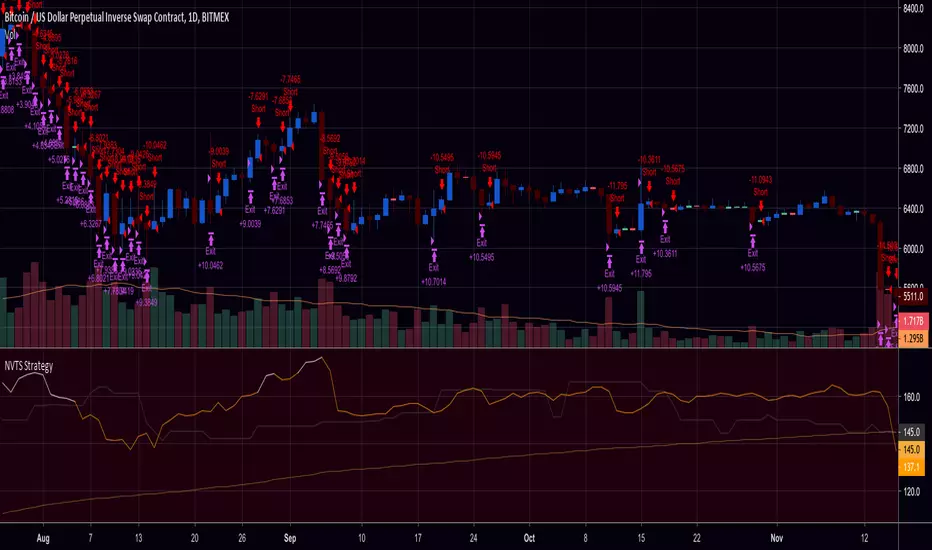
NVT Signal with RMA and Thresholds (Strategy / Backtest)This is the strategy w/ backtester and trailing-stop / stop-loss for kishin's NVT alerts


On Balance Volume w MA StratI couldn't find an OBV MA strategy, so I modified one into what i wanted. Now for all to enjoy.


Try Me I'm NewThis script can be used on the Forex Majors. When you apply it to the chart open the properties box and click the 'recalculate after update' box. It open only long positions when the conditions are met.
This is my very first attempt so dont crit me too much.

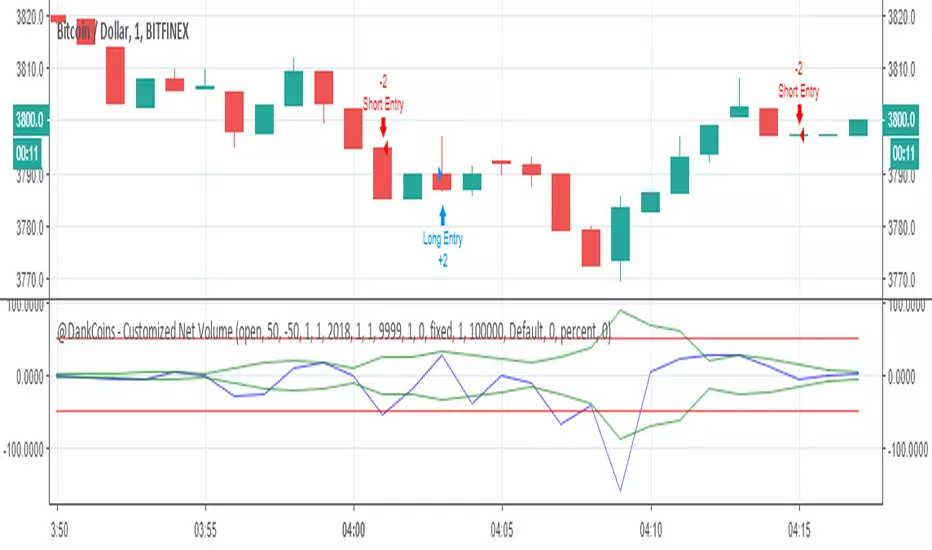
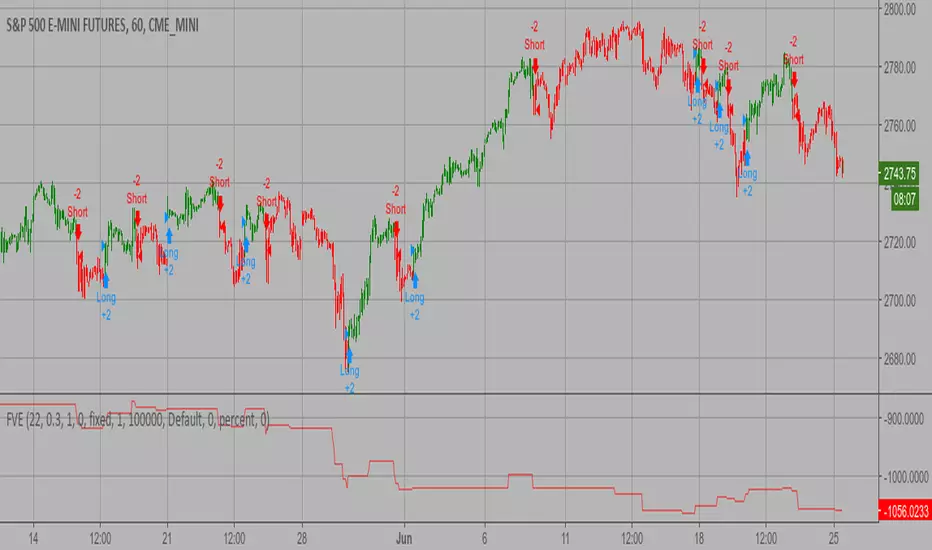
Help Requested - "Time-Slot" Delay for Crossover StrategyHello Tradingview Community,
I've been playing around with some various volume-based indicators, and recently have been experiencing a delay in the entries for my strategy for 2 minutes in this scenario. If the time is adjusted, it also is delayed 2 bars.
In this example, the "Short" position should enter when the blue line Crosses under the upper green line, and visa vera for the "Long" position. A simplified Pine Script is available below as well.
I have Googled this issue and attempted to modify the code with => criteria instead, but too no avail. Would appreciate any help or anyone who could point me in the right direction on this Time Delay Issue. Thanks!

MCI and VCI - Modified CCI FormulasFor private peeps only
- Takes a modified version of the CCI formula into 2 parts
VCI - Volume Channel Index (Yellow Histogram)
- Measures accurate accumulation and distribution levels and times
MCI - Modified Channel Index
- Measures (when compared to VCI) levels where clearly buys are interested vs not interested.
Example:
If VCI > MCI
- Shows buyer's are more than interested in buying, you've either hit a bottom or heavy resistance
if MCI > VCI
- Show's buyer's aren't interested and will most likely result in a dump/lower price
Great for monitoring accumulation and distribution, these auto buy and sells look for the transition points over 0, works on EVERY commodity/stock/FOREX/Crypto
Results are from trading 1 BTC x25 leveraging. Not all trades will get in if put in at limit, but it does survive with profits after the massive 0.075 fee (results shown are after fees)

Noro's BitFinex Long/Shorts Strategy v1.0The lime line - long positions at the BitFinex.com exchange.
The red line - short positions at the BitFinex.com exchange.
Strategy
If long positions it is more than short positions - to open long position.
And vice versa. If short it is more than long - to close long position.
You can change a symbol in settings.

VB Strategy
VB Indicator
VB Indicator PRO (with Alarm function)
With this strategy, you can test VB indicator.
This strategy use entry and close price
entry price = (high price + low price) / 2
close price = (high price + low price) / 2
이 전략으로 VB 지표에 대해 테스트할 수 있습니다.
이 전략의 진입가와 청산가는 아래와 같이 설정합니다.
진입가 = (고점+저점) / 2
청산가 = (고점+저점) / 2

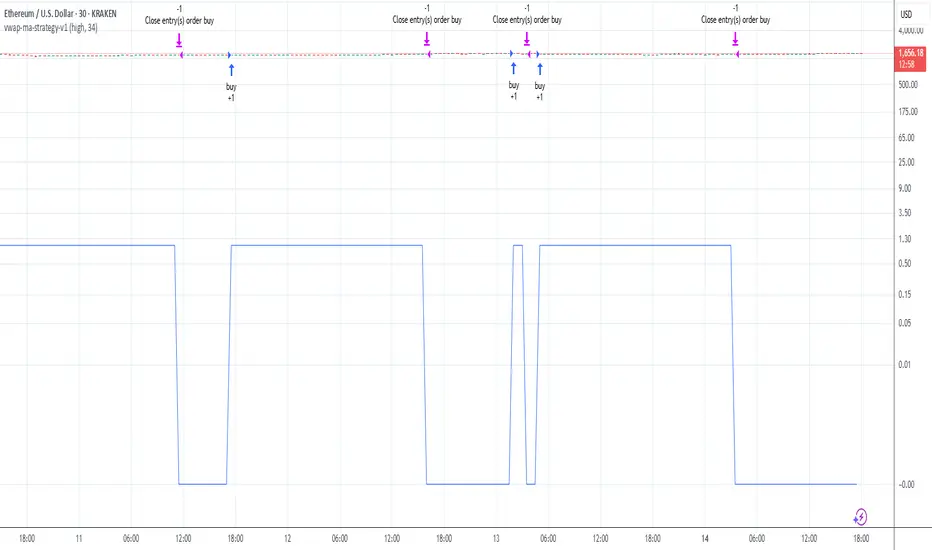
vwap-ma-strategy-v0.7This strategy was inspired by my Israeli fellow iAtiya.
I love it because it's my first pine v3 script that actually works.
Powerful with respect to it's simplicity.
Market Facilitation Index (MFI) Backtest The Market Facilitation Index is an indicator that relates price range to
volume and measures the efficency of price movement. Use the indicator to
determine if the market is trending. If the Market Facilitation Index increased,
then the market is facilitating trade and is more efficient, implying that the
market is trending. If the Market Facilitation Index decreased, then the market
is becoming less efficient, which may indicate a trading range is developing that
may be a trend reversal.
You can change long to short in the Input Settings
WARNING:
- For purpose educate only
- This script to change bars colors.

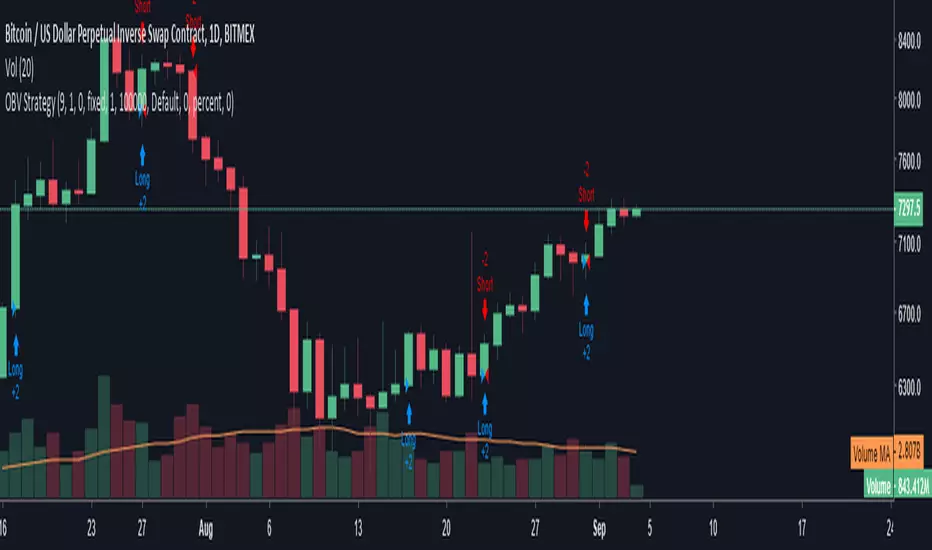
OBV StrategyA simple strategy to give buy/sell signals based on OBV and EMA crossover/crossunder.
When OBV crossunder the EMA it gives a sell signal. When OBV crossover EMA it gives a buy signal.
You can adjust the length of the EMA . By default it is set to 9
VWMA + SMA BBollinger + RSI Strategy (ChartArt) mod by BiO618This is a script I remade from the original ChartArt's "CA_RSI_Bolling_Strat".
I added a VWMA following the SMA basis curve.
BBand was made with the SMA curve, +2DS.
The point of adding VWMA to the script is to get a fast correlation between price change and volume change.
How to interpret it:
Since 3-Intervals-VWMA = (P1*V1 + P2*V2 + P3*V3) / (V1+V2+V3)
As the volume grows, VWMA get smaller.
If the price goes to the upper band, and the VWMA follows it, Price grew more than Volume, and a correction would happen soon.
If the price goes to the lower band, and the VWMA follows it, Price dipped with a lot of Volume, and a continuation of trend would be expected.
If the price goes to the upper band, and the VWMA stays close to SMA, Price grew with a correspondient Volume, and the continuation of trend would be expected.
If the price goes to the lower band, and the VWMA stays close to SMA, Price dipped with low Volume, a correction would happen soon.
Remember that NO INDICATOR is flawless, support your interpretation with other indicators like RSI and MACD.
Hope you enjoy it!
φ!

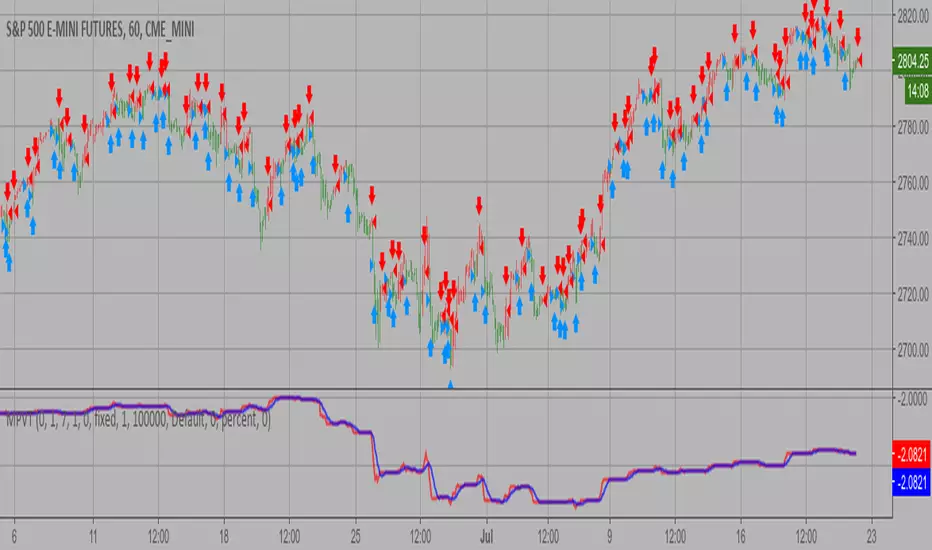
Modified Price-Volume Trend Backtest The related article is copyrighted material from
Stocks & Commodities.
Strategy by HPotter.
You can change long to short in the Input Settings
WARNING:
- For purpose educate only
- This script to change bars colors.
MACD + RSI + EMA + SMA + Ichimoku + overbought + buy, sell +Doji// MACD + EMA 200 *** buy and sell strategy (RSI, EMA, SMA) *** Doji Harami *** overbought and oversold *** trend direction *** divergence *** Ichimoku
Use this script in time 1h
Finite Volume Elements (FVE) Backtest The FVE is a pure volume indicator. Unlike most of the other indicators
(except OBV), price change doesn?t come into the equation for the FVE (price
is not multiplied by volume), but is only used to determine whether money is
flowing in or out of the stock. This is contrary to the current trend in the
design of modern money flow indicators. The author decided against a price-volume
indicator for the following reasons:
- A pure volume indicator has more power to contradict.
- The number of buyers or sellers (which is assessed by volume) will be the same,
regardless of the price fluctuation.
- Price-volume indicators tend to spike excessively at breakouts or breakdowns.
You can change long to short in the Input Settings
WARNING:
- For purpose educate only
- This script to change bars colors.
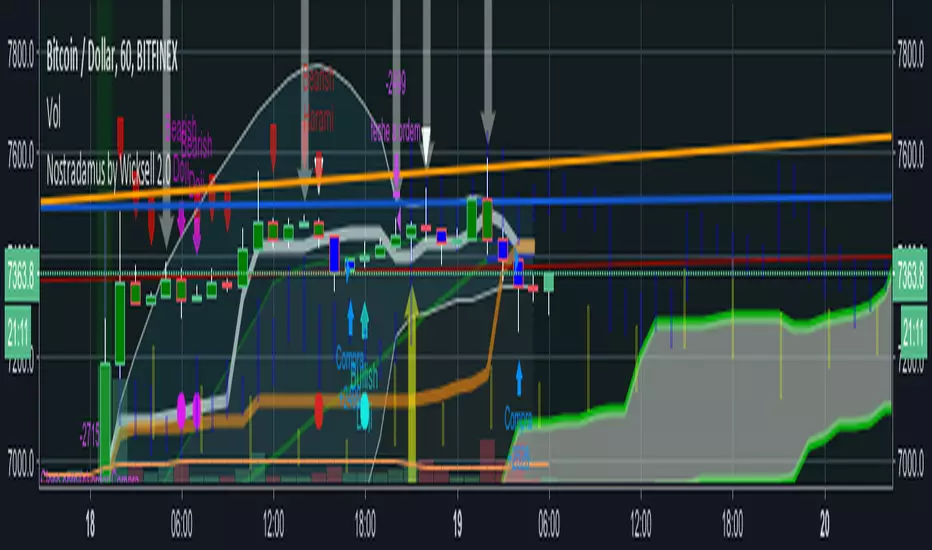
Multiple Moving Averages+TransientZones+Volumes///////////////////////////////////////////////////////////////////////////////////////////
//// MULTIPLE_MA+TRANSIENT_ZONES+VOLUMES ////
/////////////////////////////////////////////////////////////////////////////////////////
// @author GianlucaBezziccheri
// A simple script including:
// 1) 4x Simple Moving Averages
// 2) 4x Exponential Moving Averages
// 3) 4x Weighted Moving Averages
// 4) 4x Volume Weighted Moving Averages
// 5) 4x Hull Moving Averages
// 6) Transient Zones v1.1 (by Jurij)
// 7) Volumes
// You can choose MA type you prefer and even to activate all of them at the same time,
// though i don't recommend doing this.
// For more details about 6) check the original script
