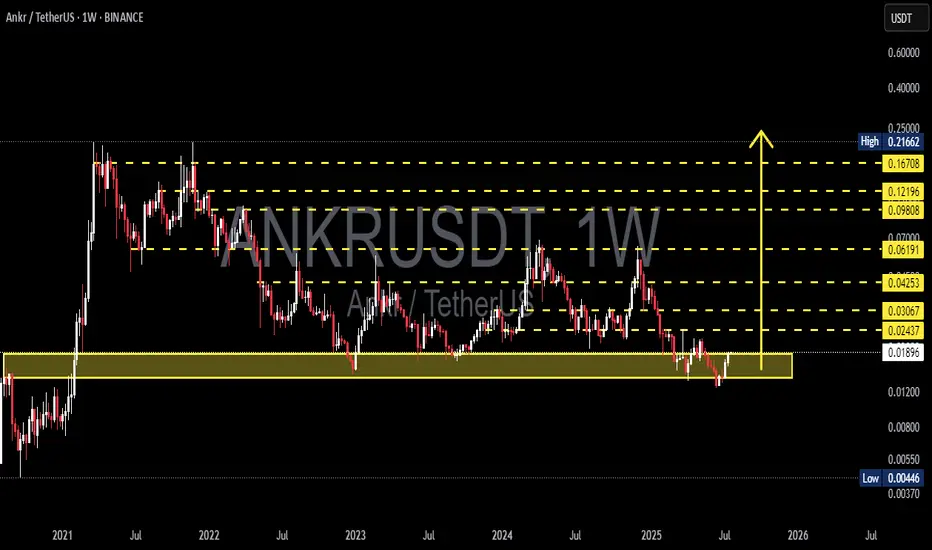
ANKR/USDT – Weekly Macro Reversal from Historical Demand Zone!🧠 Analysis Overview:
ANKR is showing strong signs of a potential macro reversal after bouncing off its historical demand zone around 0.017–0.019 USDT. This zone has proven to be a significant accumulation area in past cycles — fueling major rallies in both 2021 and 2023. The recent reaction at this
Related pairs
ankr short trade in my opinion this is a good trade with a good r/r hope hit the tp consider this is my trade not your trade and i just like to share my trades with world

ANKR USDTCP 0.01863
Buy: 0.017 0.019
Sell: 0.0218
SL: 0.017
1x2 ratio
Strong project
Very low value
Only Spot Trading with STOP LOSS.

ANKR/USDTKey Level Zone: 0.01655 - 0.01665
HMT v8 detected. The setup looks promising, supported by a previous upward/downward trend with increasing volume and momentum, presenting an excellent reward-to-risk opportunity.
HMT (High Momentum Trending):
HMT is based on trend, momentum, volume, and market str

Wyckoff Accumulation In Phase D of the Wyckoff Accumulation pattern, the key sign is strong price rallies aiming for the top of the channel.
To confirm that we’ve entered this phase, we need two main things:
1. A monthly close above the last resistance (now support)
2. Low volume during pullbacks — this shows that se

ANKRUSDT 1WANKR ~ 1W Analysis
#ANKR Buy back when testing this support with a short -term target of at least 15%+.

ANKRUSDT: A Strong Demand Zone or Breakdown Risk?ANKRUSDT is currently sitting at a crucial demand zone, a level that has historically triggered massive price movements. This same area in February 2021 acted as a springboard for huge gains, leading to a double top formation at $0.21 before experiencing a major downtrend. Since August 2022, the pri

ANKRUSDTANKR/USDT 1D Chart Overview
The ANKR/USDT pair on a 1-day timeframe displays a descending trendline extending from its peak in December 2024. The current price stands at 0.020429, reflecting a 1.69% increase. With Bollinger Bands and buy/sell signals in play, the chart suggests a possible short-term

ANKRUSDT(Ankr) Updated till 24-03-25ANKRUSDT(Ankr) Daily timeframe range. many alts got similar pattern. pushing back from its new low. if those alts can defend their new low they got long way to go. now recent resistance at 0.02244 it will be optimal if it can get over it.

ANKRUSDT – Watching Key Support Zones!I’ve marked the blue boxes as potential strong support levels—this is where smart money might step in! But remember, just because a level looks good doesn’t mean we blindly buy.
📊 How I’m Trading This:
✅ Step 1: Watch for CDV confirmation—is volume supporting the move?
✅ Step 2: Look for LTF market

See all ideas
Summarizing what the indicators are suggesting.
Oscillators
Neutral
SellBuy
Strong sellStrong buy
Strong sellSellNeutralBuyStrong buy
Oscillators
Neutral
SellBuy
Strong sellStrong buy
Strong sellSellNeutralBuyStrong buy
Summary
Neutral
SellBuy
Strong sellStrong buy
Strong sellSellNeutralBuyStrong buy
Summary
Neutral
SellBuy
Strong sellStrong buy
Strong sellSellNeutralBuyStrong buy
Summary
Neutral
SellBuy
Strong sellStrong buy
Strong sellSellNeutralBuyStrong buy
Moving Averages
Neutral
SellBuy
Strong sellStrong buy
Strong sellSellNeutralBuyStrong buy
Moving Averages
Neutral
SellBuy
Strong sellStrong buy
Strong sellSellNeutralBuyStrong buy
Displays a symbol's price movements over previous years to identify recurring trends.
Frequently Asked Questions
The current price of ANKRUSDT SPOT (ANKR) is 0.01556 USDT — it has fallen −1.65% in the past 24 hours. Try placing this info into the context by checking out what coins are also gaining and losing at the moment and seeing ANKR price chart.
ANKRUSDT SPOT price has fallen by −7.85% over the last week, its month performance shows a 15.92% increase, and as for the last year, ANKRUSDT SPOT has decreased by −45.99%. See more dynamics on ANKR price chart.
Keep track of coins' changes with our Crypto Coins Heatmap.
Keep track of coins' changes with our Crypto Coins Heatmap.
ANKRUSDT SPOT (ANKR) reached its highest price on Nov 27, 2021 — it amounted to 0.21310 USDT. Find more insights on the ANKR price chart.
See the list of crypto gainers and choose what best fits your strategy.
See the list of crypto gainers and choose what best fits your strategy.
ANKRUSDT SPOT (ANKR) reached the lowest price of 0.01247 USDT on Jun 22, 2025. View more ANKRUSDT SPOT dynamics on the price chart.
See the list of crypto losers to find unexpected opportunities.
See the list of crypto losers to find unexpected opportunities.
The safest choice when buying ANKR is to go to a well-known crypto exchange. Some of the popular names are Binance, Coinbase, Kraken. But you'll have to find a reliable broker and create an account first. You can trade ANKR right from TradingView charts — just choose a broker and connect to your account.
Crypto markets are famous for their volatility, so one should study all the available stats before adding crypto assets to their portfolio. Very often it's technical analysis that comes in handy. We prepared technical ratings for ANKRUSDT SPOT (ANKR): today its technical analysis shows the strong sell signal, and according to the 1 week rating ANKR shows the strong sell signal. And you'd better dig deeper and study 1 month rating too — it's sell. Find inspiration in ANKRUSDT SPOT trading ideas and keep track of what's moving crypto markets with our crypto news feed.
ANKRUSDT SPOT (ANKR) is just as reliable as any other crypto asset — this corner of the world market is highly volatile. Today, for instance, ANKRUSDT SPOT is estimated as 5.15% volatile. The only thing it means is that you must prepare and examine all available information before making a decision. And if you're not sure about ANKRUSDT SPOT, you can find more inspiration in our curated watchlists.
You can discuss ANKRUSDT SPOT (ANKR) with other users in our public chats, Minds or in the comments to Ideas.