ANKR USDTCP 0.01863
Buy: 0.017 0.019
Sell: 0.0218
SL: 0.017
1x2 ratio
Strong project
Very low value
Only Spot Trading with STOP LOSS.
ANKRUSDT trade ideas

ANKR/USDTKey Level Zone: 0.01655 - 0.01665
HMT v8 detected. The setup looks promising, supported by a previous upward/downward trend with increasing volume and momentum, presenting an excellent reward-to-risk opportunity.
HMT (High Momentum Trending):
HMT is based on trend, momentum, volume, and market structure across multiple timeframes. It highlights setups with strong potential for upward movement and higher rewards.
Whenever I spot a signal for my own trading, I’ll share it. Please note that conducting a comprehensive analysis on a single timeframe chart can be quite challenging and sometimes confusing. I appreciate your understanding of the effort involved.
Important Note :
Role of Key Levels:
- These zones are critical for analyzing price trends. If the key level zone holds, the price may continue trending in the expected direction. However, momentum may increase or decrease based on subsequent patterns.
- Breakouts: If the key level zone breaks, it signals a stop-out. For reversal traders, this presents an opportunity to consider switching direction, as the price often retests these zones, which may act as strong support-turned-resistance (or vice versa).
My Trading Rules
Risk Management
- Maximum risk per trade: 2.5%.
- Leverage: 5x.
Exit Strategy
Profit-Taking:
- Sell at least 70% on the 3rd wave up (LTF Wave 5).
- Typically, sell 50% during a high-volume spike.
- Adjust stop-loss to breakeven once the trade achieves a 1.5:1 reward-to-risk ratio.
- If the market shows signs of losing momentum or divergence, ill will exit at breakeven.
The market is highly dynamic and constantly changing. HMT signals and target profit (TP) levels are based on the current price and movement, but market conditions can shift instantly, so it is crucial to remain adaptable and follow the market's movement.
If you find this signal/analysis meaningful, kindly like and share it.
Thank you for your support~
Sharing this with love!
HMT v2.0:
- Major update to the Momentum indicator
- Reduced false signals from inaccurate momentum detection
- New screener with improved accuracy and fewer signals
HMT v3.0:
- Added liquidity factor to enhance trend continuation
- Improved potential for momentum-based plays
- Increased winning probability by reducing entries during peaks
HMT v3.1:
- Enhanced entry confirmation for improved reward-to-risk ratios
HMT v4.0:
- Incorporated buying and selling pressure in lower timeframes to enhance the probability of trending moves while optimizing entry timing and scaling
HMT v4.1:
- Enhanced take-profit (TP) target by incorporating market structure analysis
HMT v5 :
Date: 23/01/2025
- Refined wave analysis for trending conditions
- Incorporated lower timeframe (LTF) momentum to strengthen trend reliability
- Re-aligned and re-balanced entry conditions for improved accuracy
HMT v6 :
Date : 15/02/2025
- Integrated strong accumulation activity into in-depth wave analysis
HMT v7 :
Date : 20/03/2025
- Refined wave analysis along with accumulation and market sentiment
HMT v8 :
Date : 16/04/2025
- Fully restructured strategy logic

Wyckoff Accumulation In Phase D of the Wyckoff Accumulation pattern, the key sign is strong price rallies aiming for the top of the channel.
To confirm that we’ve entered this phase, we need two main things:
1. A monthly close above the last resistance (now support)
2. Low volume during pullbacks — this shows that sellers are weak
If the price breaks below the last swing low, the bullish outlook is no longer valid.
But if it closes back inside the accumulation range, the pattern is confirmed, and that’s usually a signal to enter right away.
We need to be patient — this is the stage where profits come, but only if you let the move play out.

ANKRUSDT 1WANKR ~ 1W Analysis
#ANKR Buy back when testing this support with a short -term target of at least 15%+.

ANKRUSDT: A Strong Demand Zone or Breakdown Risk?ANKRUSDT is currently sitting at a crucial demand zone, a level that has historically triggered massive price movements. This same area in February 2021 acted as a springboard for huge gains, leading to a double top formation at $0.21 before experiencing a major downtrend. Since August 2022, the price has been stuck in a sideways range, with no clear breakout in sight—until now.
Why This Demand Zone is Key
The weekly support level within the range has proven to be resilient, holding strong since 2021. Additionally, the Stochastic RSI is in oversold territory, signaling a potential loss of selling pressure. This setup suggests that buyers might step in soon, making this zone a prime accumulation area for long-term holders.
Best Buy Zone:
🔹 $0.015 - $0.022 → A historically strong support level, ideal for long-term positions.
Potential Targets:
📌 Short-Term Target: $0.057 - $0.066 (Top of the current range)
📌 Mid-Term Target: $0.097 (Potential supply zone)
📌 Long-Term Target: $0.21 (Previous all-time high)
Bearish Scenario: What If Support Breaks?
While the demand zone is strong, there's always a chance of a breakdown. If price fails to hold support, the next major demand zone lies at $0.008—a crucial level for long-term investors to watch.
Final Thoughts
✅ The setup is strong, with price at weekly support and indicators signaling a potential reversal.
⚠️ But always have a plan—if the demand zone breaks, be ready for lower levels.
💡 Risk management is key—stick to your strategy, and trade with confidence!
What’s your take on ANKR? Are you bullish or waiting for more confirmation? Let’s discuss in the comments! 🚀
Keep it shiny~!
KinaStar

ANKRUSDTANKR/USDT 1D Chart Overview
The ANKR/USDT pair on a 1-day timeframe displays a descending trendline extending from its peak in December 2024. The current price stands at 0.020429, reflecting a 1.69% increase. With Bollinger Bands and buy/sell signals in play, the chart suggests a possible short-term bounce near critical support levels. Check the chart for more insights!

ANKRUSDT(Ankr) Updated till 24-03-25ANKRUSDT(Ankr) Daily timeframe range. many alts got similar pattern. pushing back from its new low. if those alts can defend their new low they got long way to go. now recent resistance at 0.02244 it will be optimal if it can get over it.

ANKRUSDT – Watching Key Support Zones!I’ve marked the blue boxes as potential strong support levels—this is where smart money might step in! But remember, just because a level looks good doesn’t mean we blindly buy.
📊 How I’m Trading This:
✅ Step 1: Watch for CDV confirmation—is volume supporting the move?
✅ Step 2: Look for LTF market structure shifts—is price breaking upwards on lower time frames?
✅ Step 3: If support holds + volume confirms = I take the trade. No confirmation? I wait.
💡 Patience Pays:
The market doesn’t care about emotions. Most traders jump in too early and get stopped out. I let the market show its hand first. That’s why I catch moves before they happen.
🔥 Final Thought:
If price suddenly breaks below without support forming, I will not insist on a long. But if we get a strong reaction + a retest? Then it’s game time.
📈 Follow for precision trades—because guessing is for amateurs. 🔥
A tiny part of my runners:
🎯 ZENUSDT.P: Patience & Profitability | %230 Reaction from the Sniper Entry
🐶 DOGEUSDT.P: Next Move
🎨 RENDERUSDT.P: Opportunity of the Month
💎 ETHUSDT.P: Where to Retrace
🟢 BNBUSDT.P: Potential Surge
📊 BTC Dominance: Reaction Zone
🌊 WAVESUSDT.P: Demand Zone Potential
🟣 UNIUSDT.P: Long-Term Trade
🔵 XRPUSDT.P: Entry Zones
🔗 LINKUSDT.P: Follow The River
📈 BTCUSDT.P: Two Key Demand Zones
🟩 POLUSDT: Bullish Momentum
🌟 PENDLEUSDT.P: Where Opportunity Meets Precision
🔥 BTCUSDT.P: Liquidation of Highly Leveraged Longs
🌊 SOLUSDT.P: SOL's Dip - Your Opportunity
🐸 1000PEPEUSDT.P: Prime Bounce Zone Unlocked
🚀 ETHUSDT.P: Set to Explode - Don't Miss This Game Changer
🤖 IQUSDT: Smart Plan
⚡️ PONDUSDT: A Trade Not Taken Is Better Than a Losing One
💼 STMXUSDT: 2 Buying Areas
🐢 TURBOUSDT: Buy Zones and Buyer Presence
🌍 ICPUSDT.P: Massive Upside Potential | Check the Trade Update For Seeing Results
🟠 IDEXUSDT: Spot Buy Area | %26 Profit if You Trade with MSB
📌 USUALUSDT: Buyers Are Active + %70 Profit in Total
🌟 FORTHUSDT: Sniper Entry +%26 Reaction
🐳 QKCUSDT: Sniper Entry +%57 Reaction
📊 BTC.D: Retest of Key Area Highly Likely
📊 XNOUSDT %80 Reaction with a Simple Blue Box!

ANKR/USDT Will Bulls Take Control or Are We Heading Lower?
Yello Paradisers! Are we about to see #ANKRUSDT break out, or is another rejection incoming? Let’s break it down this is a crucial moment in the market, and you don’t want to miss it.
💎Right now, the 4-hour chart shows SEED_DONKEYDAN_MARKET_CAP:ANKR sitting above the EMA 50, signaling a short-term bullish push. But don’t get too excited just yet—price is still below the EMA 200, which keeps the overall market bias neutral to bearish. For the bulls to take over, a clean breakout above the EMA 200 resistance is needed. If ANKR fails here, we could see another test of the supply zone between 0.02019 - 0.02271, followed by a potential pullback toward the 0.01504 support level.
💎Now, zooming out to the 1-day chart, the picture gets even more interesting. The price is still trading below both the EMA 50 and EMA 200, confirming that the bigger trend remains bearish. What does this mean? Any bullish moves on the 4-hour chart could just be temporary retracements within a larger downtrend. With this structure, selling pressure is still dominant, and unless we see a major reversal, further downside remains on the table.
💎So, what’s the key takeaway? Short-term bullish opportunities exist, but they’re facing strong resistance from the EMA 200 and supply zone. Meanwhile, the longer-term trend remains bearish, meaning any failure to break higher could increase the risk of a deeper drop possibly toward the 0.01294 support area.
Patience and precision are key in these conditions wait for strong confirmation before making your moves.
MyCryptoParadise
iFeel the success🌴

ANKRUSDT 1WANKR ~ 1W Analysis
#ANKR If you still have a Conviction on this coin. Maybe this support block you can consider to start buying back with a short -term target of at least 20%+.

ANKR Ready for PUMP or what ?If the price holds this support level, there is a possibility of the price increasing up to the channel ceiling.
Give me some energy !!
✨We spend hours finding potential opportunities and writing useful ideas, we would be happy if you support us.
Best regards CobraVanguard.💚
_ _ _ _ __ _ _ _ _ _ _ _ _ _ _ _ _ _ _ _ _ _ _ _ _ _ _ _ _ _ _ _
✅Thank you, and for more ideas, hit ❤️Like❤️ and 🌟Follow🌟!
⚠️Things can change...
The markets are always changing and even with all these signals, the market changes tend to be strong and fast!!

Will ANKRUSDT Finally Break Out? Key Levels to Watch Now!Yello, Paradisers! Is ANKRUSDT gearing up for a breakout, or is more downside coming? Let’s break it down.
💎ANKRUSDT has been forming a well-defined descending channel with a triple zig-zag pattern and bullish divergence, increasing the probability of an upcoming bullish move.
💎For a confirmed breakout, ANKRUSDT must show strength, break above the descending channel and resistance, and close a candle with strong volume. If that happens, the probability of a bullish move significantly increases.
💎In case of a retracement, a short-term bounce could be possible if we get a bullish Internal Change of Character (I CHoCH). However, considering the broader crypto market conditions, this remains a low-probability setup.
💎On the other hand, if we see panic selling, leading to a breakdown and candle close below the key support level, it will invalidate the bullish setup entirely. In that case, it’s best to wait for a stronger price action formation before taking any trades.
🎖 Patience and discipline are key in such setups, Paradisers. The market will always offer new opportunities—our job is to wait for the highest probability trades and execute with confidence. Stay sharp!
MyCryptoParadise
iFeel the success🌴

ANKR's gonna decrease But...!BINANCE:ANKRUSDT
last time we talked about ANKR, It was still in the triangle.
but now the price is in a bearish situation!
if you expect the price would decrease as much as it's measured movement (AB=CD) the price shall reach a support so strong that would be the ultimate comeback for ANKR!😍
If you take a look back at the chart,The last time the price was there was around 13 years ago! and afterward the price went to the moon!
IT can be the ultimate turning back point for ANKR!
⚠️ Disclaimer:
This is not financial advice. Always manage your risks and trade responsibly.
👉 Follow me for daily updates,
💬 Comment and like to share your thoughts,
📌 And check the link in my bio for even more resources!
Let’s navigate the markets together—join the journey today! 💹✨

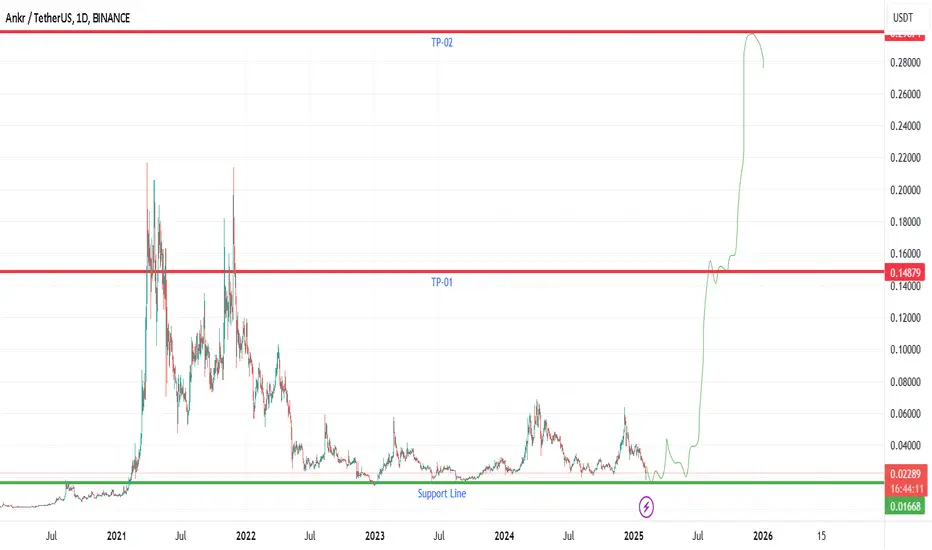
Ankr - Real Altseason indicatorSince 2021, every mini alt season cycle has reached the red zone, forming a top. It appears that the red zone marks the top for mini-alt seasons, while the green zone serves as the floor.
In the main alt season, I anticipate the red zone breaking to the upside.

can we say what is gonna happen to ANKR?BINANCE:ANKRUSDT
ANKR is gonna have a touch time!
we can't really say what will happen cause no break out has happened yet!
when It happens the price will change according to the measured movement (AB=CD)
wait for confirmation (Break out)
⚠️ Disclaimer:
This is not financial advice. Always manage your risks and trade responsibly.
👉 Follow me for daily updates,
💬 Comment and like to share your thoughts,
📌 And check the link in my bio for even more resources!
Let’s navigate the markets together—join the journey today! 💹✨

More than 1000% gain is possible for ANKRAnkr is a decentralized blockchain infrastructure provider that operates an array of nodes globally distributed across over 50 Proof-of-Stake networks. This infrastructure helps drive the growth of the crypto economy while powering a full suite of multi-chain tools for Web3 users:
ANKRUSDT 1WANKR ~ 1W Analysis
#ANKR So far this support block continues to be maintained in Time Frime 1W. Buy from here if you still have a Conviction on this coin with a minimum target of 20%+

Massive Symmetrical triangle , breakout soon!#ANKR is moving inside a huge symmetrical triangle , we can see sellers got tired and the a breakout will be immense soon, watch the chart and put your stop losses and tp carefully

ANKRUSDT 1WANKR ~ 1W
#ANKR This support block is the golden ratio. if you still have Conviction on this coin,. Buy from here with a minimum target of 20%++

ANKRUSD - SHORT - 15MINOnce Confirm the CH, after identified the Order Block are & FVG area, then place the entry in FVG area and Stop-loss - above BSL, & Profit Target fix the Below SSL areas

Will #ANKR See Another Bullish Push From the Bulls? Key LevelsYello, Paradisers! Is #ANKRUSDT poised for a breakout, or are we heading deeper? Let’s break down this critical setup for #Ankr:
💎#ANKR has been trading within a descending channel on the 4-hour chart. The price is approaching the descending resistance of this channel and the next few candles will determine whether bulls are ready to take control.
💎For #ANKRUSD to confirm a breakout, it must decisively close above the $0.0406 resistance level. This would open the door to a rally towards the major resistance zone at $0.0485, where sellers may return in force. A strong breakout here could fuel momentum for further upside, potentially targeting even higher levels.
💎If buyers push the price above $0.0485, it will signify a major shift in market sentiment, and we could see #ANKR head toward $0.0580 or higher. To confirm this breakout, you need to watch for increased trading volume and strong bullish candles. Without these signals, any upward move risks being a fakeout.
💎On the flip side, failure to break the descending resistance could lead to a pullback toward the $0.03307 support level. If this support doesn't hold, the price may retest the demand zone at $0.02776.
💎A 4-hour candle close below $0.02776 would invalidate the bullish setup and could trigger a sharp decline toward $0.02500 or even lower. Traders should exercise caution if this scenario unfolds.
Stay focused, patient, and disciplined, Paradisers🥂
MyCryptoParadise
iFeel the success🌴

TradeCityPro | ANKR: Weekly Long-Term Box and Gradual Channel👋 Welcome to TradeCityPro!
In this analysis, I will examine the ANKR coin, which is part of the infrastructure for Web3 and other blockchain projects, with significant partners like Binance and Polygon.
📅 Weekly Timeframe: Long-Term Box with a Slight Incline Channel I will perform this analysis mainly using Fibonacci levels to identify crucial areas. In this timeframe, we can see the price movement from the previous alt season, which had significant growth followed by a decline after breaking the 0.236 Fibonacci level, correcting down to the 0.5 Fibonacci level.
🔍 The support at $0.01728, which coincides with this Fibonacci level, is currently the most crucial support on this chart. Since the price bottomed out in this area, we have seen a very gently sloping upward channel that has reacted three times and had one fake break above the ceiling before returning to the box.
📊 Given the greater ratio of buying to selling volume, I see a higher likelihood of the channel breaking upwards and the price increasing. The RSI has also risen from the 50 level, which could generate bullish momentum. The current main ceiling appears to be $0.06131, which coincides with the 0.236 Fibonacci level and represents a strong resistance.
📈 If the price rises and breaks through $0.06131, the next resistance will be at $0.19012, which is the all-time high (ATH) for the price. I will determine higher targets using Fibonacci extensions.
🔽 In a bearish scenario, the first support is the dynamic floor of the channel. If this support breaks, the primary supports at $0.02223 and $0.01728 are very important levels, and reaching any of these supports could introduce bullish momentum into the market and prevent further declines. If these supports break, the next support will be at the 0.618 Fibonacci level.
✨ Moving on to finding targets based on Fibonacci, as you've seen, the price has corrected to the 0.5 Fibonacci retracement and has good momentum for continuing the upward move. According to Fibonacci rules, when a price corrects to 0.5, the likelihood of moving to the previous high with a break increases.
🧩 The previous price peak is at $0.19418, which coincides with the 0.5 Fibonacci extension. From a market cap perspective, this coin's price could move up to $0.34361. Therefore, we can consider logical targets between $0.19418 and $0.34361. Although the target box size is large and nearly 100% different, this is a weekly trend, and this target is approximate; we must wait for the price reaction to this range to find a more precise target.
🚀 I believe this range is a logical target for this coin, but if the market cap of the project increases and it becomes one of the more significant cryptocurrencies, the price could potentially move to the 1 or even 1.272 Fibonacci points.
📝 Final Thoughts
This analysis reflects our opinions and is not financial advice.
Share your thoughts in the comments, and don’t forget to share this analysis with your friends! ❤️

ANKR LongAnkr on the daily has confirmed a partial decline and has a 70% chance of breaking out of it's range to the upside.
The weekly has everything.
- Bullish divergence
- Bullish developments on the indicators
- Above key support level
-Three rising valleys indicating accumulation
We're not using leverage on this trade but it is one of our favourite assets to hold within these defined levels. Let's see how it goes.
