APT 4H – Holding the Higher Low, But Will Bulls Follow Through?APT is holding at a critical demand zone, testing both trendline support and prior consolidation structure.
Price action is forming a potential higher low, with a bullish reaction candle and a sharp Stoch RSI reversal from oversold.
🧠 What to Watch:
– Breakout from descending structure
– Higher hi
Key stats
About APT
Related coins

APT - HUGE POTENTIAL (130+% SPOT) You probably forgot about this altcoin but it is justified. Downtrend since 2023 and lower highs, lower lows but....
If we look more close and use tool fixed price volume we can see that price is above VAL (Value area low), we had break through but price returns..Also good reaction of FVG (Fair val

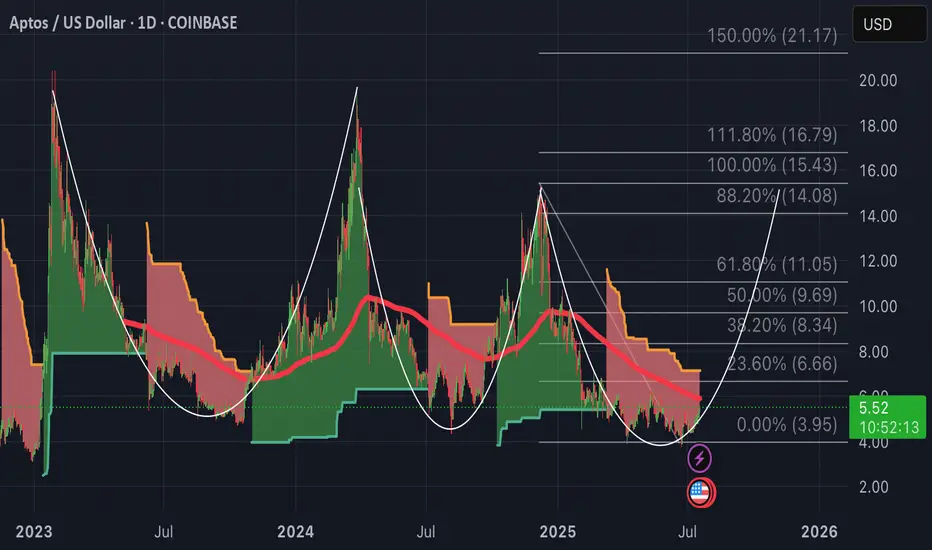
APT-Setup for another macro bullish swingStrictly looking macro time frames we can see APT is setup for another bullish swing to retest 100% Fibonacci near $14.90
Super Trend still flashing bearish red signals but this looks to be reverting soon as price ticks up closer to a 200MA convergence.
Breakout above $5.24 pivot: APT closed abov
APTUSD – Recovered and RechargingAPT broke out from $4.70 base and surged to $5.30+. After a deep pullback, it formed a solid V-bottom and reclaimed $5.00 quickly. Price now moves with strength toward previous high. The breakout level to clear is $5.25–$5.30 for fresh leg up.

APTUSD – Reloaded or Rejected?Aptos saw a textbook pump-dump-reclaim move. After peaking near $5.30 and crashing, it double-bottomed and reclaimed the $4.90 zone. Since then, we’ve seen a higher low form. If bulls push through $4.95, it opens $5.10+ again. Below $4.83, the structure weakens.

APT Bullish Breakout Holding Above $5.00APT made a strong breakout from $4.60, surging past $5.20 before pulling back. The climb was supported by strong impulse candles, and the pair is now ranging between $5.05–$5.15. If $5.00 holds, the bulls may resume control.
APTOS Stock Chart Fibonacci Analysis 051825Trading Idea
1) Find a FIBO slingshot
2) Check FIBO 61.80% level
3) Entry Point > 5.1/61.80%
Chart time frame: C
A) 15 min(1W-3M)
B) 1 hr(3M-6M)
C) 4 hr(6M-1year)
D) 1 day(1-3years)
Stock progress: A
A) Keep rising over 61.80% resistance
B) 61.80% resistance
C) 61.80% support
D) Hit the bottom

Aptos H&S in the making
Aptos H&S in the making
Target $8.20 if this turns into a bottom here—probably in a week or two. AMEX:APT long in place but might get a strong wick down first.

APT: The Solid Range#Aptos is a solid project that has traded within the same range ($3–$20) since its late 2022 launch.
Currently, #APT is in the demand zone of this long-term range.
A strong rebound is likely from current levels as long as $3 holds as the stop-loss.

Aptos (APT)Aptos is a new project in crypto market with a lot of attention as well as features to offer. There is not much price candles to tell the big picture pattern; but as can be seen after APT made a harmonic pattern, it went into a corrective phase which seems unfolded in a complex two a-b-c pattern. Pl

See all ideas
Summarizing what the indicators are suggesting.
Oscillators
Neutral
SellBuy
Strong sellStrong buy
Strong sellSellNeutralBuyStrong buy
Oscillators
Neutral
SellBuy
Strong sellStrong buy
Strong sellSellNeutralBuyStrong buy
Summary
Neutral
SellBuy
Strong sellStrong buy
Strong sellSellNeutralBuyStrong buy
Summary
Neutral
SellBuy
Strong sellStrong buy
Strong sellSellNeutralBuyStrong buy
Summary
Neutral
SellBuy
Strong sellStrong buy
Strong sellSellNeutralBuyStrong buy
Moving Averages
Neutral
SellBuy
Strong sellStrong buy
Strong sellSellNeutralBuyStrong buy
Moving Averages
Neutral
SellBuy
Strong sellStrong buy
Strong sellSellNeutralBuyStrong buy
Displays a symbol's price movements over previous years to identify recurring trends.
Frequently Asked Questions
The current price of APT (APT) is 4.64462949 USD — it has risen 4.97% in the past 24 hours. Try placing this info into the context by checking out what coins are also gaining and losing at the moment and seeing APT price chart.
The current market capitalization of APT (APT) is 3.12 B USD. To see this number in a context check out our list of crypto coins ranked by their market caps or see crypto market cap charts.
APT (APT) trading volume in 24 hours is 360.05 M USD. See how often other coins are traded in this list.
APT price has risen by 7.43% over the last week, its month performance shows a 4.01% increase, and as for the last year, APT has decreased by −8.59%. See more dynamics on APT price chart.
Keep track of coins' changes with our Crypto Coins Heatmap.
Keep track of coins' changes with our Crypto Coins Heatmap.
APT (APT) reached its highest price on Oct 19, 2022 — it amounted to 72.55884285 USD. Find more insights on the APT price chart.
See the list of crypto gainers and choose what best fits your strategy.
See the list of crypto gainers and choose what best fits your strategy.
APT (APT) reached the lowest price of 0.98360427 USD on Oct 19, 2022. View more APT dynamics on the price chart.
See the list of crypto losers to find unexpected opportunities.
See the list of crypto losers to find unexpected opportunities.
The current circulating supply of APT (APT) is 1.17 B USD. To get a wider picture you can check out our list of coins with the highest circulating supply, as well as the ones with the lowest number of tokens in circulation.
The safest choice when buying APT is to go to a well-known crypto exchange. Some of the popular names are Binance, Coinbase, Kraken. But you'll have to find a reliable broker and create an account first. You can trade APT right from TradingView charts — just choose a broker and connect to your account.
Crypto markets are famous for their volatility, so one should study all the available stats before adding crypto assets to their portfolio. Very often it's technical analysis that comes in handy. We prepared technical ratings for APT (APT): today its technical analysis shows the neutral signal, and according to the 1 week rating APT shows the sell signal. And you'd better dig deeper and study 1 month rating too — it's sell. Find inspiration in APT trading ideas and keep track of what's moving crypto markets with our crypto news feed.
APT (APT) is just as reliable as any other crypto asset — this corner of the world market is highly volatile. Today, for instance, APT is estimated as 8.24% volatile. The only thing it means is that you must prepare and examine all available information before making a decision. And if you're not sure about APT, you can find more inspiration in our curated watchlists.
You can discuss APT (APT) with other users in our public chats, Minds or in the comments to Ideas.