AUDCAD: Respecting Structure, Repeating OpportunityWhat we’re looking at here is a beautifully balanced range market, the kind I love trading, because it speaks so clearly when you take a moment to listen. Price is respecting both sides of this range clearly. The lows are being protected and respected multiple times before.
We’ve already tapped into that lower bound, and the reaction has been good, together with liquidity collecting. And when price finds its feet in these kinds of zones, I immediately think of what the range is offering, right now, with risk clearly defined and reward just sitting at the other edge, waiting.
If price gives us one more small retest, I’m watching for confirmation: not just in candlestick structure, but also in volume behavior. I have my eyes set straight on that upper resistance zone near 0.90000.
And from there unless there’s a news catalyst or volume breakout, that’s where the move likely might exhaust… and that’s where I’m out, before the reversal can bite.
If the structure shifts, I’ll shift too. But until then, this is a perfect range.
Just sharing my thoughts for the charts, this isn’t financial advice. Always confirm your setups and manage your risk properly.
Disclosure: I am part of Trade Nation's Influencer program and receive a monthly fee for using their TradingView charts in my analysis.
AUDCAD trade ideas

AUDCAD Trade plan: Waiting for bullish confirmation at RetestPrice broke above resistance with a momentum candle, indicating buyer control. This is our first clue that a structure shift might have occurred.
This retest is essential. Many traders make the mistake of entering too early without confirmation. But it's right here, once price touches the former resistance, that you must observe how price reacts. Look for price exhaustion or reversal candlesticks such as bullish engulfing patterns, or even inside bars.
Once rejection is confirmed, I'm looking to go long to 0.90450.
Just sharing my thoughts for the charts, this isn’t financial advice. Always confirm your setups and manage your risk properly.

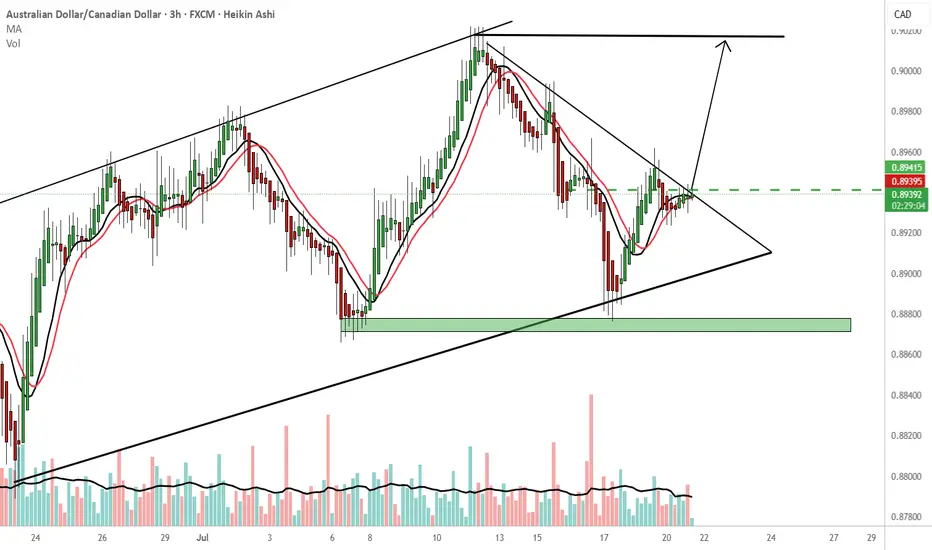
AUDCAD BULLS Looking for buys, consider the following confirmation.
-Inverse Head and Shoulder formation, you can consider buys above the green broken line, you could wait for a retest @ 0.89420 before liftoff.
-Consider 0.90200 as the first TP
-TP 2: 0.91200
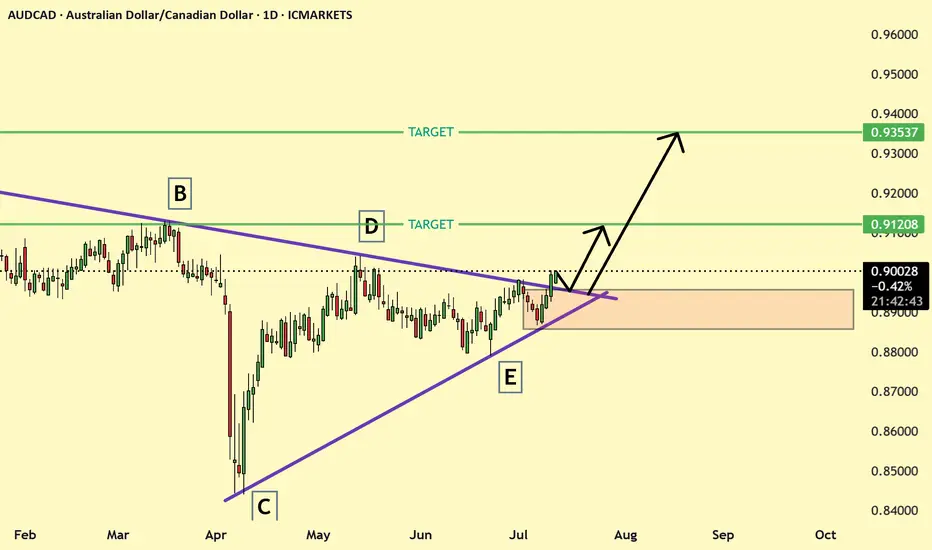
AUDCAD breakout of resistance trend lineAUDCAD was trading in symmetrical triangle and recently broke the resistance and soon may retest it and trade can be entered
121Hello awesome traders! 👋
Hope you’ve managed to grab some solid pips from the markets this week. As we head into the weekend, I’m wrapping things up by dropping a few clean chart setups for you to review and reflect on.
Enjoy the weekend, recharge well — and I’ll see you sharp and ready next week for more structure-led opportunities.
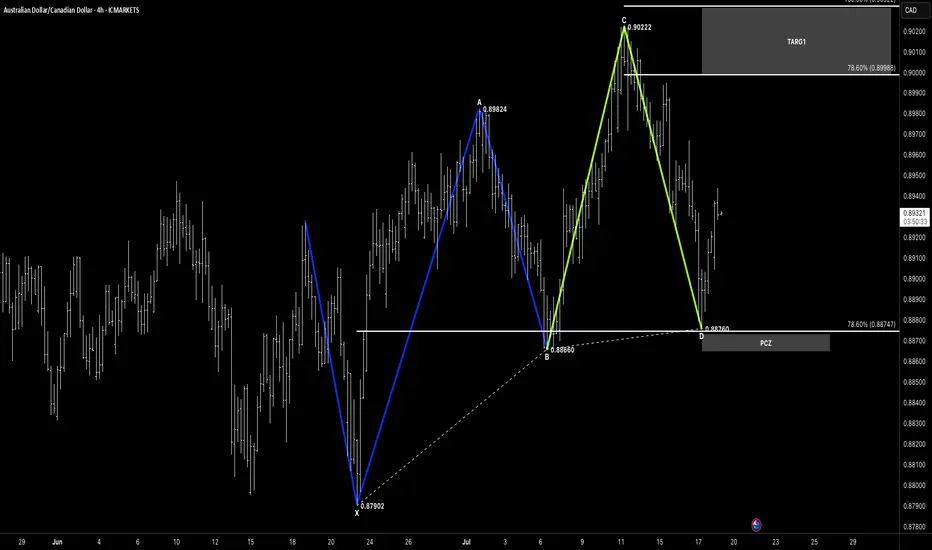
📌 Pattern Breakdown
This one's a 1-2-1 Bullish Formation — clear, clean, and already reacting:
🔹 XA: 0.87902 → 0.89824
🔹 AB retracement → 0.88660
🔹 BC extension: 0.88660 → 0.90222
🔹 CD drops into the PCZ at 0.88760 — aligning with 78.6% retracement
We’ve now seen a clear bullish reaction off the PCZ, confirming it as a valid demand zone.
🎯 Targets Now in Play
With structure holding and price climbing from the PCZ:
✅ Target 1:
• 78.6% = 0.89988
• 100% = 0.90322
🔄 Target 2 (Extension):
• 78.6% = 0.90584
• 100% = 0.91080
We’ll keep managing toward Target 1, then reassess momentum and candle structure for continuation into Target 2 next week.
🧠 Key Concepts in Play
✅ 121 Bullish pattern
✅ Reaction at fib-based PCZ
✅ Controlled impulse off demand zone
✅ Target structure mapped + invalidation clearly below PCZ
🗝 Final Thoughts
Textbook measured move off the 1-2-1 setup, with price now rotating higher from structure.
This is what we look for every week — precision, confirmation, and opportunity.
Let’s protect gains, lock partials near Target 1, and come back Monday with a clear head.
“Structure gives you the zone — reaction gives you the trade.”
AUDCAD SHORTMarket structure bearish on HTFs 3
Entry at both Weekly and Daily AOi
Weekly Rejection at AOi
Weekly Previous Structure Point
Weekly Rejection at AOi
Daily Rejection at AOi
Daily Previous Structure Point
Around Psychological Level 0.89500
H4 EMA retest
H4 Candlestick rejection
Rejection from Previous structure
Levels 4.17
Entry 120%
REMEMBER : Trading is a Game Of Probability
: Manage Your Risk
: Be Patient
: Every Moment Is Unique
: Rinse, Wash, Repeat!
: Christ is King.

AUDCAD in Downtrend ContinuationSell Limit
Entry Price 0.8945
Stop Loss 0.8975
Risk 1%
Lot Size 1.14
TP (1RR) 0.8915
TP (2.5RR) 0.8866

Bullish bounce?AUD/CAD is falling towards the support level which is an overlap support that aligns with the 71% Fibonacci retracement and could bounce from this level to our take profit.
Entry: 0.89106
Why we like it:
There is an overlap support that lines up with the 71% Fibonacci retracement.
Stop loss: 0.88668
Why we like it:
There is a pullback support.
Take profit: 0.90090
Why we like it:
There is a pullback resistance.
Enjoying your TradingView experience? Review us!
Please be advised that the information presented on TradingView is provided to Vantage (‘Vantage Global Limited’, ‘we’) by a third-party provider (‘Everest Fortune Group’). Please be reminded that you are solely responsible for the trading decisions on your account. There is a very high degree of risk involved in trading. Any information and/or content is intended entirely for research, educational and informational purposes only and does not constitute investment or consultation advice or investment strategy. The information is not tailored to the investment needs of any specific person and therefore does not involve a consideration of any of the investment objectives, financial situation or needs of any viewer that may receive it. Kindly also note that past performance is not a reliable indicator of future results. Actual results may differ materially from those anticipated in forward-looking or past performance statements. We assume no liability as to the accuracy or completeness of any of the information and/or content provided herein and the Company cannot be held responsible for any omission, mistake nor for any loss or damage including without limitation to any loss of profit which may arise from reliance on any information supplied by Everest Fortune Group.

AUDCAD Q3 | D21 | W30 | Y25 📊AUDCAD Q3 | D21 | W30 | Y25
Daily Forecast 🔍📅
Here’s a short diagnosis of the current chart setup 🧠📈
Higher time frame order blocks have been identified — these are our patient points of interest 🎯🧭.
It’s crucial to wait for a confirmed break of structure 🧱✅ before forming a directional bias.
This keeps us disciplined and aligned with what price action is truly telling us.
📈 Risk Management Protocols
🔑 Core principles:
Max 1% risk per trade
Only execute at pre-identified levels
Use alerts, not emotion
Stick to your RR plan — minimum 1:2
🧠 You’re not paid for how many trades you take, you’re paid for how well you manage risk.
🧠 Weekly FRGNT Insight
"Trade what the market gives, not what your ego wants."
Stay mechanical. Stay focused. Let the probabilities work.
FRGNT 📊

AUDCAD SHORTMarket structure bearish on HTFs DW
Entry at both Weekly and Daily AOi
Weekly Rejection at AOi
Weekly Previous Structure Point
Weekly Rejection at AOi
Daily Rejection at AOi
Daily Previous Structure Point
Around Psychological Level 0.89500
H4 EMA retest
H4 Candlestick rejection
Levels 4.17
Entry 100%
REMEMBER : Trading is a Game Of Probability
: Manage Your Risk
: Be Patient
: Every Moment Is Unique
: Rinse, Wash, Repeat!
: Christ is King.

AUD/CAD LIVE TRADE STARTEDAUD/CAD – Short Position Taken
This one was on our watchlist earlier, and it just printed a clean engulfing candle trigger. Here’s what I look for before entering a VMS pullback trade:
A clear new high/low before the pullback
A clean pullback (no choppy mini-pullbacks inside)
Pullback into support/resistance zone
Price action at or near the 50 EMA
Engulfing candle in trend direction
Strong volume (trigger candle should stand out)
Momentum “hooking” in trend direction and below/above 0
We took a short position based on this alignment.
What do you think — continuation or reversal? Up or down from here?

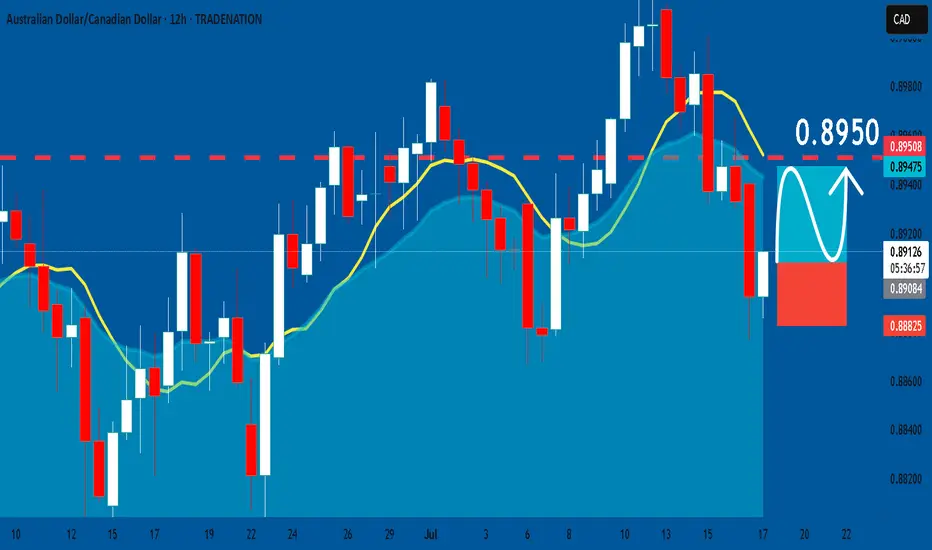
AUDCAD: Long Signal Explained
AUDCAD
- Classic bullish formation
- Our team expects pullback
SUGGESTED TRADE:
Swing Trade
Long AUDCAD
Entry - 0.8908
Sl - 0.8882
Tp - 0.8950
Our Risk - 1%
Start protection of your profits from lower levels
Disclosure: I am part of Trade Nation's Influencer program and receive a monthly fee for using their TradingView charts in my analysis.
❤️ Please, support our work with like & comment! ❤️
BUY AUDCADAUDCAD has triggered the buy order. Pricing is climbing up towards the 0,89800 supply area.

audcad Short
We have a break of structure. we waiting for a fair value gap on lower time frame in order to sell to those zone. lets wait and see how it goes

Australian Dollar to Weaken Against Canadian Dollar Over Next 6 AUD/CAD has broken below key support at **0.8900**, confirming a bearish trend. The pair is trading below the 200-day MA (~0.8950), with RSI holding below 50, indicating sustained selling pressure. Next downside targets: **0.8750** (2024 low) and potentially **0.8600** (2023 support zone).
Canada’s oil-linked CAD benefits from resilient crude prices (supply risks, geopolitical tensions), while Australia’s iron ore exports face demand concerns (China slowdown).
RBA may cut rates before the BoC as Australia’s growth slows, while Canada’s sticky inflation delays easing. AUD (risk-sensitive) suffers if global growth fears rise, while CAD gains from safe-haven flows into oil.
CFTC data shows net-short AUD positions growing, reflecting bearish bias. Speculative longs on oil (supporting CAD) remain elevated.
Sasha Charkhchian

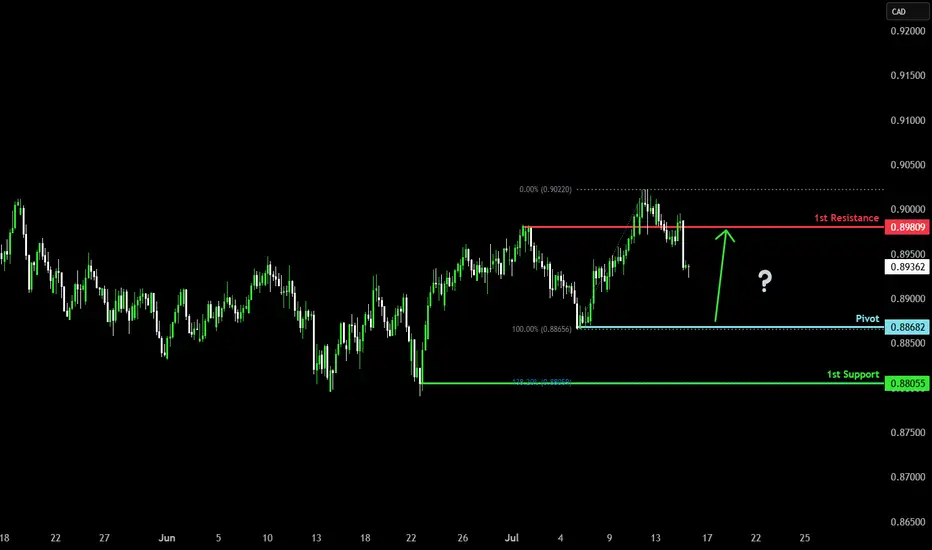
Bullish bounce off pullback support?AUD/CAD is falling towards the pivot which is a pullback support and could bounce to the 1st resistance which is a pullback resistance.
Pivot: 0.88682
1st Support: 0.88055
1st Resistance: 0.89809
Risk Warning:
Trading Forex and CFDs carries a high level of risk to your capital and you should only trade with money you can afford to lose. Trading Forex and CFDs may not be suitable for all investors, so please ensure that you fully understand the risks involved and seek independent advice if necessary.
Disclaimer:
The above opinions given constitute general market commentary, and do not constitute the opinion or advice of IC Markets or any form of personal or investment advice.
Any opinions, news, research, analyses, prices, other information, or links to third-party sites contained on this website are provided on an "as-is" basis, are intended only to be informative, is not an advice nor a recommendation, nor research, or a record of our trading prices, or an offer of, or solicitation for a transaction in any financial instrument and thus should not be treated as such. The information provided does not involve any specific investment objectives, financial situation and needs of any specific person who may receive it. Please be aware, that past performance is not a reliable indicator of future performance and/or results. Past Performance or Forward-looking scenarios based upon the reasonable beliefs of the third-party provider are not a guarantee of future performance. Actual results may differ materially from those anticipated in forward-looking or past performance statements. IC Markets makes no representation or warranty and assumes no liability as to the accuracy or completeness of the information provided, nor any loss arising from any investment based on a recommendation, forecast or any information supplied by any third-party.
+AUDCAD (0,89100 to 0,89800) All eyes on AUDCAD. Price is testing the resistance trend line and will soon break above it. A bullish flag pattern can be spotted on the 4 hour chart.

AUD/CAD LIVE TRADE UPDATELIVE TRADE – VMS Pullback Strategy
We entered this trade based on a classic VMS pullback setup:
Price pulled back into a 3-touch S/R zone
Volume and momentum aligned with the direction
Engulfing candle trigger confirmed the move near the 50EMA
Now we’re simply letting the trade play out.
📌 The work is done before entry. Discipline does the rest.

AUDCAD Wk Top Down Bullish Price Action Analysis 1.The weekly price is reaching a premium zone, suggesting a potential reversal or reaction area.
2. Daily BOS + Tap into Daily imbalance FVG.
3. HR is still in a bullish sentiment
4. Waiting for 15 minutes for displacement or BOS
5. Tap into 15 minutes of FVG.
5: Pending price action...

AUD_CAD RISKY LONG|
✅AUD_CAD is trading in an
Uptrend and the pair made
A nice pullback and retested
The falling support so we are
Locally bullish biased and
We will be expecting a
Local bullish rebound
LONG🚀
✅Like and subscribe to never miss a new idea!✅
Disclosure: I am part of Trade Nation's Influencer program and receive a monthly fee for using their TradingView charts in my analysis.

AUDCAD LONG 14-7-2025indices
axy : bullish
cxy : bearish
trade long with proper risk management only 0.5 % per trade

AUDCAD – Bearish Rejection at Key Resistance ZoneAUDCAD is showing signs of weakness near the 0.8980 supply zone after an extended rally. The pair is now reacting to a historically respected resistance area, with bearish momentum building as exhaustion sets in.
🔍 Technical Outlook:
✅ Price rejected at multi-touch resistance around 0.8980
📐 Clean bearish structure forming after wedge-like exhaustion
📉 Expecting a move down toward:
TP1: 0.89365 – recent minor structure
TP2: 0.89080 – key demand zone from early July
TP3: 0.88654 – full measured target from range
📛 Invalidation above: 0.8985
🌍 Fundamental Breakdown:
🇦🇺 Australia:
📉 Softening inflation and retail sales
🏦 RBA cautious with limited appetite for further hikes
🇨🇳 Weak Chinese demand adds pressure on AUD
🇨🇦 Canada:
💪 Supported by rising oil prices and solid employment data
🏦 BoC remains vigilant on inflation, though on hold
🛢️ Strong WTI prices continue to support CAD
⚠️ Risks to the Bearish View:
⚡ Unexpectedly strong China data could boost AUD
📉 Sudden drop in oil prices would hurt CAD
🗣️ Surprise hawkish shift from RBA
🔗 Correlation & Flow:
AUDCAD is a lagging asset, heavily influenced by WTI crude (boosting CAD) and China-linked risk flows (affecting AUD).
Keep an eye on AUDUSD and USDCAD for early signals.
📆 Upcoming Key Events:
🇦🇺 RBA Minutes, Jobs Data, Wages Index
🇨🇦 BoC Business Outlook, CPI Print
🛢️ US Oil Inventories (affects CAD)
🧭 Summary:
🔻 Bias: Bearish
📊 Drivers: Oil strength, RBA caution, CAD resilience
⚠️ Risk: China rebound or oil correction
🕵️ Watch: Canadian CPI + Australian jobs data
📉 Likely to Follow: Oil and AUDUSD/USDCAD macro trends

Lingrid | AUDCAD Shoring Opportunity at Monthly HighThe price perfectly fulfilled my last idea . FX:AUDCAD surged through the previous resistance and is now testing the 0.9045–0.9050 zone, where both a horizontal supply and red descending trendline converge. This area is a critical junction, and current price action shows early hesitation with a potential rounding top formation. A deeper pullback is possible if buyers fail to break above this resistance convincingly, with downside targets near prior breakout levels. The broader uptrend remains intact, but short-term correction risks are rising from this confluence zone.
📉 Key Levels
Sell trigger: confirmed rejection below 0.9050 with bearish engulfing or wick exhaustion
Sell zone: 0.9025–0.9050 (key resistance + trendline)
Target: 0.8960 initially, with deeper extension to 0.8822
Invalidation: clean hourly close above 0.9060 signals continuation of uptrend
💡 Risks
Minor support near 0.9000 could stall decline
Stronger-than-expected AUD data could lift price through resistance
False breakout wicks above 0.9050 might trap early sellers
If this idea resonates with you or you have your own opinion, traders, hit the comments. I’m excited to read your thoughts!
