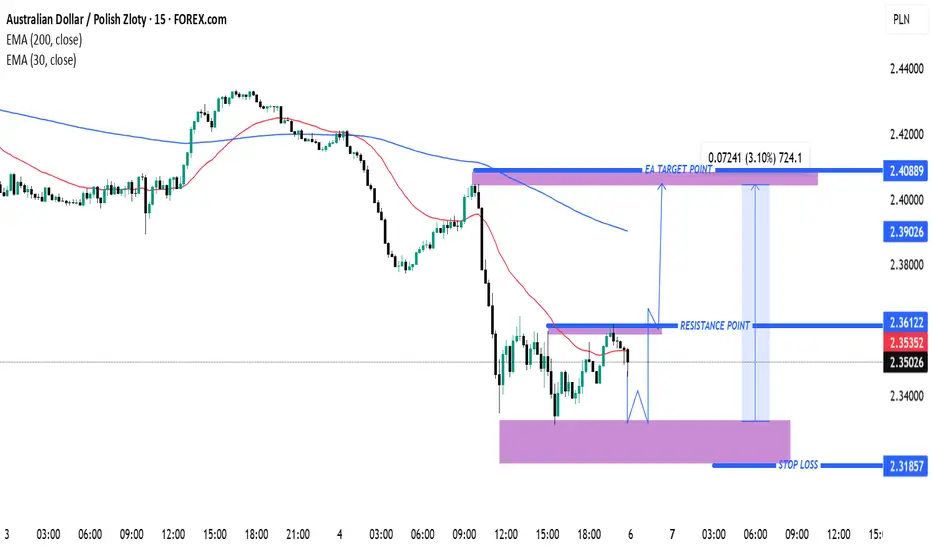
AUD/PLN Bullish Reversal Setup – Buy from Demand Zone Toward 200EMA 30 (Red): 2.35352
EMA 200 (Blue): 2.39026
🧠 Trade Setup: Potential Long Opportunity
📍 Current Price: 2.35026
📌 Key Levels:
Entry Zone (Demand Zone): Around 2.31857 – 2.34500
Strong historical support (highlighted in purple).
Market is expected to pull back here before bouncing.
Stop Loss: 2
Related currencies
AUD/PLN Technical Analysis: Potential Reversal from Resistance ZThis is a technical analysis chart of the Australian Dollar (AUD) against the Polish Zloty (PLN) on a 30-minute timeframe from TradingView. Here are the key observations:
1. Resistance Zone (Purple Box at the Top):
The price is approaching a key resistance area around 2.4350 - 2.4450.
This zone h

AUD/PLN Technical Analysis – Reversal Opportunity AUD/PLN Chart Analysis (1H) on TradingView 📊 🔴 Overall Trend: ➡️ The price is following a bearish trend 📉, trading below the 200 EMA (🔵 2.45308) and the 30 EMA (🔴 2.43309). ➡️ The market is showing selling pressure, but the price has reached a key support zone 🟣. 🟣 Support Zone (Possible Reversal)

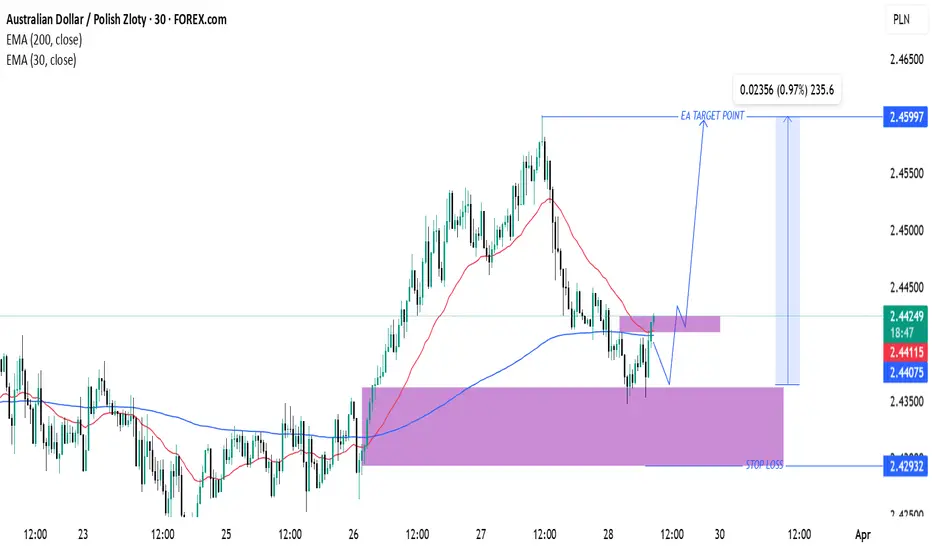
AUD/PLN Trade Setup: Bullish Reversal & Target ProjectionAUD/PLN Technical Analysis & Trade Setup
Chart Overview:
Currency Pair: Australian Dollar (AUD) / Polish Zloty (PLN)
Timeframe: 30-minute chart
Indicators:
200 EMA (Blue): 2.44075
30 EMA (Red): 2.44113
Key Levels & Strategy:
Support & Resistance:
Major Support Zone: Around 2.42932 (Stop Loss A
AUDPLN UpdateAUD weakness across the board and this air is primed to move lower. The price is currently rejecting the 50 day moving average after ranging for the entirety of 2021. I expect the pair to try go for the lower range

Short Idea for AUDPLN. Head and Shoulders Top PatternHere we can see that the previous uptrend is in the process of reversing. Price ran up to a key level and then began to lose momentum and consolidate in a distribution, eventually forming a head and shoulders and breaking out to the downside. This presents a very good opportunity to sell again. Wait

AUDPLN 4 month #rectangle #ChartPatternBeen consolidating for 4 months forming a rectangle chart pattern. A daily close above rectangle resistance would set the stage for the next leg up.


See all ideas
Summarizing what the indicators are suggesting.
Oscillators
Neutral
SellBuy
Strong sellStrong buy
Strong sellSellNeutralBuyStrong buy
Oscillators
Neutral
SellBuy
Strong sellStrong buy
Strong sellSellNeutralBuyStrong buy
Summary
Neutral
SellBuy
Strong sellStrong buy
Strong sellSellNeutralBuyStrong buy
Summary
Neutral
SellBuy
Strong sellStrong buy
Strong sellSellNeutralBuyStrong buy
Summary
Neutral
SellBuy
Strong sellStrong buy
Strong sellSellNeutralBuyStrong buy
Moving Averages
Neutral
SellBuy
Strong sellStrong buy
Strong sellSellNeutralBuyStrong buy
Moving Averages
Neutral
SellBuy
Strong sellStrong buy
Strong sellSellNeutralBuyStrong buy
Displays a symbol's price movements over previous years to identify recurring trends.