AAPL triangle breakout pattern (bullish bias in this case).📈 Chart Pattern Observed:
This is a symmetrical triangle breakout pattern (bullish bias in this case).
Price has broken out or is near breakout above the descending trendline.
Ichimoku cloud thinning and flattening indicates potential bullish momentum building up.
---
🎯 Target Levels Based on
Key facts today
0.30 USD
75.08 B USD
313.21 B USD
About Apple Inc
Sector
Industry
CEO
Timothy Donald Cook
Website
Headquarters
Cupertino
Founded
1976
ISIN
ARDEUT116183
FIGI
BBG000S0MSK0
Apple, Inc. engages in the design, manufacture, and sale of smartphones, personal computers, tablets, wearables and accessories, and other varieties of related services. It operates through the following geographical segments: Americas, Europe, Greater China, Japan, and Rest of Asia Pacific. The Americas segment includes North and South America. The Europe segment consists of European countries, as well as India, the Middle East, and Africa. The Greater China segment comprises China, Hong Kong, and Taiwan. The Rest of Asia Pacific segment includes Australia and Asian countries. Its products and services include iPhone, Mac, iPad, AirPods, Apple TV, Apple Watch, Beats products, AppleCare, iCloud, digital content stores, streaming, and licensing services. The company was founded by Steven Paul Jobs, Ronald Gerald Wayne, and Stephen G. Wozniak in April 1976 and is headquartered in Cupertino, CA.
Related stocks

Light at the end of the Tunnel for AAPLI have been tracking this pattern that NASDAQ:AAPL started forming in April for some time now.
This is a classic symmetrical triangle formation with significant consolidation in the last trading sessions. This patterns typically lead to a breakout in either direction, and since price is near the

Time to buy? Too much negative press. Buy in Fear- Updated 25/6Apple has recently faced significant negative press, leading to fear and critical perceptions among investors. This situation highlights a common investment principle: buy in times of fear and sell in times of greed. As a result, I have taken a considerable long position on Apple, which I have since

AAPL death cat bounceAAPL is looking like a technical death cat bounce (0.5 fib retracement).
Targets around $100 probably lower...

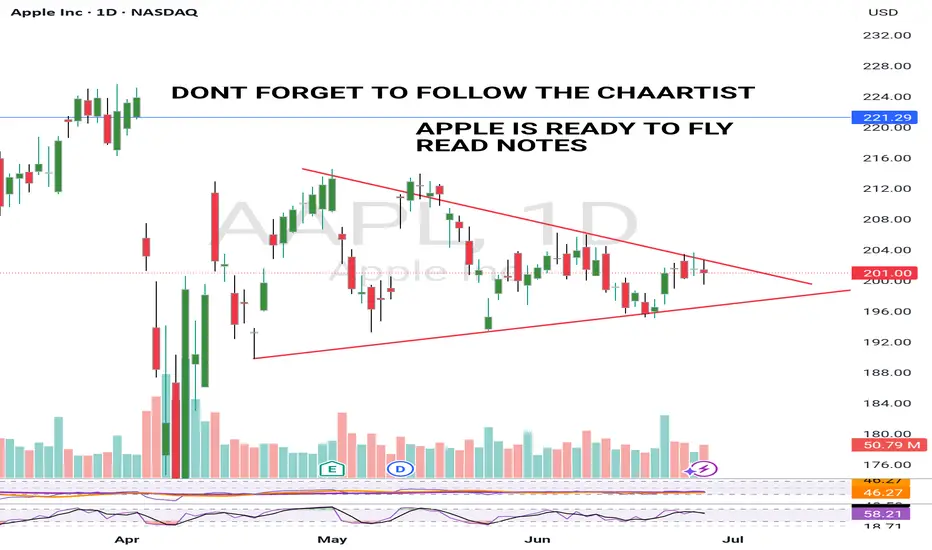
APPLE BULLISH 26 JUNE 2025Apple looks ready to breakout.It is really well squeezed now and ready to form a Green candle.
Breakout is an expectation so dont trade blindly.
I will upload video analysis Asap.
I am bullish and my price target is a minimum $220 from here.
NOTE: RISK MANAGEMENT IS A MUST
Compounders: 5 Simple Rules to Build Long-Term WealthImagine this:
…it’s 18 years ago. The very first iPhone has just hit the market.
Meanwhile, Nokia’s legendary “Snake” game, once the height of mobile fun, was starting to feel… dated.
⚡ And you can sense it: something big is coming. You don’t know exactly what, but something is about to shake the s

AAPL: Update - Key Levels to Watch for Price DevelopmentAAPL: Update - Key Levels to Watch for Price Development
Overall nothing changed and AAPL remains a valuable and strong structure
Apple's stock (AAPL) has been range-bound between $193 and $212.50 for the past two months, repeatedly testing support near $193 on three occasions.
Each time, the

Apple about to popTight BB squeeze — contractions like these are usually followed by heightened volatility.

AppleNo change in regard to my Apple analysis. I am still waiting for price to either break down to the target box or head straight to the upper target box from here. I think given the current price action we have a higher probability of moving lower first, but the fact remains it is not required. This w

AAPL Inside a Coil – Big Move Loading from the $200 Zone 🧠 GEX-Based Options Sentiment:
Apple (AAPL) is caught between tight gamma compression and heavy resistance.
The $205–$207 zone is packed with GEX9 and multiple Call Walls. This is the key ceiling that has rejected price repeatedly over the past week. On the other side, the Highest Positive Net GEX /

See all ideas
Summarizing what the indicators are suggesting.
Oscillators
Neutral
SellBuy
Strong sellStrong buy
Strong sellSellNeutralBuyStrong buy
Oscillators
Neutral
SellBuy
Strong sellStrong buy
Strong sellSellNeutralBuyStrong buy
Summary
Neutral
SellBuy
Strong sellStrong buy
Strong sellSellNeutralBuyStrong buy
Summary
Neutral
SellBuy
Strong sellStrong buy
Strong sellSellNeutralBuyStrong buy
Summary
Neutral
SellBuy
Strong sellStrong buy
Strong sellSellNeutralBuyStrong buy
Moving Averages
Neutral
SellBuy
Strong sellStrong buy
Strong sellSellNeutralBuyStrong buy
Moving Averages
Neutral
SellBuy
Strong sellStrong buy
Strong sellSellNeutralBuyStrong buy
Displays a symbol's price movements over previous years to identify recurring trends.
US37833DZ0
APPLE 20/50Yield to maturity
6.78%
Maturity date
Aug 20, 2050
US37833EF3
APPLE 21/51Yield to maturity
6.63%
Maturity date
Feb 8, 2051
US37833EG1
APPLE 21/61Yield to maturity
6.62%
Maturity date
Feb 8, 2061
US37833EK2
APPLE 21/51Yield to maturity
6.58%
Maturity date
Aug 5, 2051
US37833DW7
APPLE 20/50Yield to maturity
6.57%
Maturity date
May 11, 2050
US37833EL0
APPLE 21/61Yield to maturity
6.55%
Maturity date
Aug 5, 2061
US37833EA4
APPLE 20/60Yield to maturity
6.46%
Maturity date
Aug 20, 2060
US37833DQ0
APPLE 19/49Yield to maturity
6.34%
Maturity date
Sep 11, 2049
US37833EE6
APPLE 21/41Yield to maturity
6.13%
Maturity date
Feb 8, 2041
APCL
APPLE 15/42Yield to maturity
5.92%
Maturity date
Jul 31, 2042
US37833BA7
APPLE 15/45Yield to maturity
5.92%
Maturity date
Feb 9, 2045
See all AAPLD bonds
Curated watchlists where AAPLD is featured.


