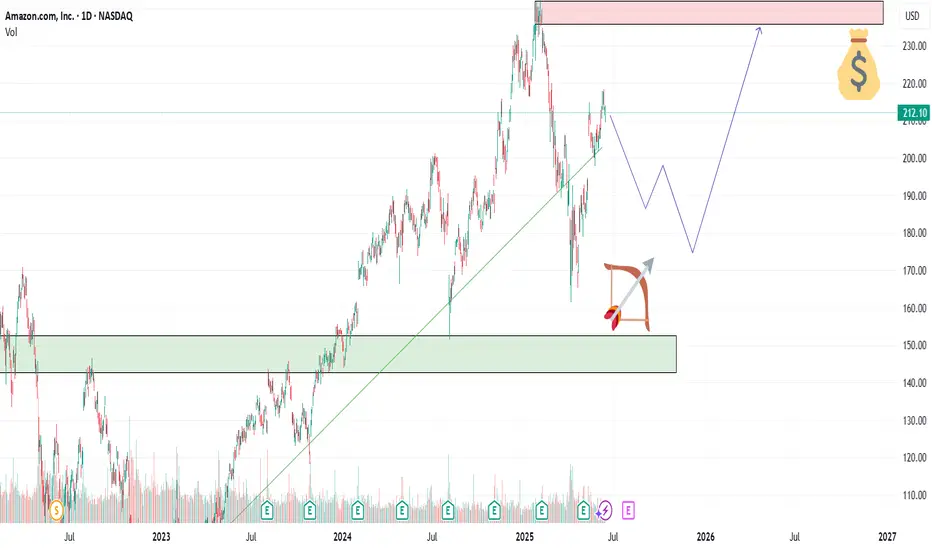
AMAZON Local Short! Sell!
Hello,Traders!
AMAZON made a retest
Of the horizontal resistance
Around 219$ and the stock
Is already making a local
Bearish pullback so a further
Bearish correction
Is to be expected
Sell!
Comment and subscribe to help us grow!
Check out other forecasts below too!
Disclosure: I am part
Key facts today
40 ARS
54.25 T ARS
584.16 T ARS
About Amazon.com
Sector
Industry
CEO
Andrew R. Jassy
Website
Headquarters
Seattle
Founded
1994
ISIN
ARBCOM460176
FIGI
BBG00P2FT6Y6
Amazon.com, Inc. engages in the provision of online retail shopping services. It operates through the following business segments: North America, International, and Amazon Web Services (AWS). The North America segment includes retail sales of consumer products and subscriptions through North America-focused websites such as amazon.com and amazon.ca. The International segment offers retail sales of consumer products and subscriptions through internationally-focused websites. The Amazon Web Services segment involves in the global sales of compute, storage, database, and AWS service offerings for start-ups, enterprises, government agencies, and academic institutions. The company was founded by Jeffrey P. Bezos in July 1994 and is headquartered in Seattle, WA.
Related stocks

Amazon: Continuing to RiseWith Amazon’s recent climb, prices are edging closer to the top of wave (1) in magenta. However, there is still a bit of upside potential in the short term before wave (2) makes its corrective move. Our primary scenario does not anticipate a new low below $160.50. Instead, we expect wave (3) in mage

AMAZON TROUBLENASDAQ:AMZN Is currently trading Just 11% below its all time high and currently Facing exhaustion.
Amazon is currently trading 217$ range which was previous support now turned resistance (Daily Timeframe) , making a double top pattern and a negative divergence on the RSI.
The best Trades are th

AMZN Quick Take: GEX & Chart Analysis- jun 161️⃣ Gamma Context (1‑Hour Chart)
* Call gamma wall clusters around $214–220, with the strongest resistance near $218–220—dealers may hedge/delta-neutralize here, creating selling pressure at that zone.
* Implied volatility is low (~13%) relative to average (~38%), making call spreads cheaper and app

AMZN — Accumulation Zone or Just a Healthy Pullback?📦Amazon (AMZN) is offering an interesting opportunity after a healthy correction from its 2025 highs. With continued AWS expansion and aggressive investment in AI infrastructure, the fundamentals remain solid — but short-term volatility opens the door for strategic entries.
🎯 Entry Points
🔹 $194 –
AMZN on WatchLooking for a pull back to around $209.50 or a break out above $215.
Why:
20EMA and $209 resistance are lining up
On an uptrend
Possible Cup and Handle forming

$AMZN Rolling Over?Amazon is showing a bearish divergence and looks like it's ready to roll over. Of course this is contingent on other global factors, but the last time we saw a bearish divergence, there was a drop that followed.
Not financial advice, good luck to all :)

Amazon ($AMZN) – Bullish Breakout WatchPublished by: Wavervanir_International_LLC
🗓️ May 19, 2025 | 1D Chart
Amazon is showing strong momentum with a confirmed break above the $200.92 resistance zone (now flipped support). The price is currently consolidating around the 0.786 Fibonacci level ($208.21), and a clean daily close above this

Imbalance, FVG & Short Trend Flag Strategy / Estrategia basada..*************************
* ENGLISH VERSION *
*************************
This analysis blends institutional structure with price action to identify high-probability zones on AMZN.
🔍 Setup Structure:
Imbalance breaks PH/L of the trend: Confirmation of institutional strength breaking a Previous Hig

AMZN – Breaking Out From Handle in Cup & Handle BaseAmazon ( NASDAQ:AMZN ) is breaking out from the handle of a well-formed cup and handle base, offering a defined, low-risk entry with a strong technical structure.
📈 Entry Zone: 214.84 – 225.25
🛑 Stop Range: 203.88 – 197.23 (5–8% below entry, based on risk preference)
🎯 Target: 242.50
📌 Will conside

See all ideas
Summarizing what the indicators are suggesting.
Oscillators
Neutral
SellBuy
Strong sellStrong buy
Strong sellSellNeutralBuyStrong buy
Oscillators
Neutral
SellBuy
Strong sellStrong buy
Strong sellSellNeutralBuyStrong buy
Summary
Neutral
SellBuy
Strong sellStrong buy
Strong sellSellNeutralBuyStrong buy
Summary
Neutral
SellBuy
Strong sellStrong buy
Strong sellSellNeutralBuyStrong buy
Summary
Neutral
SellBuy
Strong sellStrong buy
Strong sellSellNeutralBuyStrong buy
Moving Averages
Neutral
SellBuy
Strong sellStrong buy
Strong sellSellNeutralBuyStrong buy
Moving Averages
Neutral
SellBuy
Strong sellStrong buy
Strong sellSellNeutralBuyStrong buy
Displays a symbol's price movements over previous years to identify recurring trends.
Curated watchlists where AMZN is featured.


