Coca-Cola Stock Falls Despite Strong EarningsDuring the latest trading session, Coca-Cola stock maintained a clear neutral bias after a nearly 1% decline, falling below the $70 per share level. This movement came despite the company reporting better-than-expected results, with earnings per share (EPS) of $0.87, above the $0.83 expected, and to
Key facts today
0.50 USD
9.44 B USD
41.54 B USD
About Coca-Cola Company (The)
Sector
Industry
CEO
James Quincey
Website
Headquarters
Atlanta
Founded
1886
ISIN
ARDEUT110111
FIGI
BBG000D7D5V9
The Coca-Cola Co. engages in the manufacturing and marketing of non-alcoholic beverages. It operates through the following segments: Europe, Middle East and Africa, Latin America, North America, Asia Pacific, Global Ventures, and Bottling Investments. The company was founded by Asa Griggs Candler on May 8, 1886 and is headquartered in Atlanta, GA.
Related stocks
KO: Coca-Cola (CFD) Earnings 23-07-2025Yesterday we have the Coca-Cola earnings report came out and beat on both earning and revenue. But due to the technical position I do not see it a good entry on the stock CFD, still see PepsiCo stock CFD is a better option.
Disclaimer: This content is NOT a financial advise, it is for educational pu

Coca Cola to protect my portfolio and help it growOne of the most important things we must try to determine as investors is what company is the best at what they do in their field. In my opinion Coca Cola is and has always been the number one soft drink manufacturer, always finding new yet subtle ways to stay ahead of their competition.
The reason
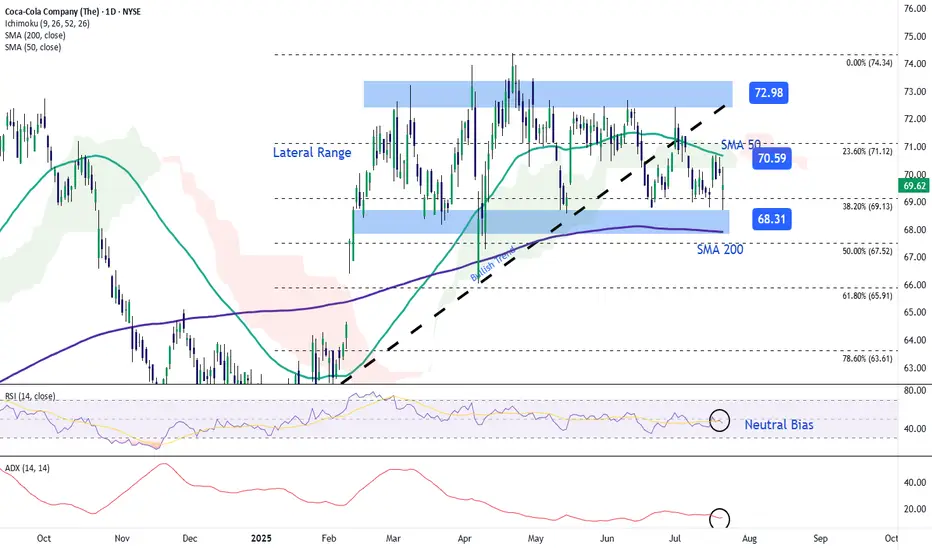
Coca-Cola Wave Analysis – 17 July 2025- Coca-Cola reversed from the support area
- Likely to rise to resistance level 72.00
Coca-Cola recently reversed from the support area between the key support level 68.55 (which has been reversing the price from May), lower daily Bollinger Band and the 38.2% Fibonacci correction of the upward impu

Coca-Cola: Nearing Final Wave III HighDespite recent sell-offs, we still expect Coca-Cola to reach a final high of magenta wave within our beige Target Zone between $76.58 and $81.51, which should also mark the completion of the broader beige wave III. However, an alternative scenario—with a 38% probability—remains in play: in this ca

Trading The 3 Step Rocket Booster StrategyTrading within a certain time frame has shown me that its better to set a time stop limit.
This time stop limit tells you when to stop trading your entry.
-
Now does this work? am not sure but i will try anything
that will produce results.
-
Right now am focusing on short term trading strategies.The

Coca-Cola Wave Analysis – 19 June 2025
- Coca-Cola broke the support zone
- Likely to fall to support level at 68.55
Coca-Cola recently broke the support zone located between the support level 70.35 (which reversed the price twice from May) and the 61.8% Fibonacci correction of the upward impulse 1 from May.
The breakout of this supp

KO stock on sale todayIt is at a support level, pays dividends soon, has solid fundamentals, its a buy today from me I am increasing my position in Coca Cola. The range of the intrinsic value is between $50 and $180.

How To Buy A Short Squeeze Using This 3 Step SystemToday i felt lifted and happy.
But Yesterday i was very sad
because of a silly fight
with a drunk friend of mine.
Need i mention i was sober.
I had to self defense myself but i feel much
better after writing down my feelings.
Basically i had to run away from the
fight.There is nothing
wrong wi

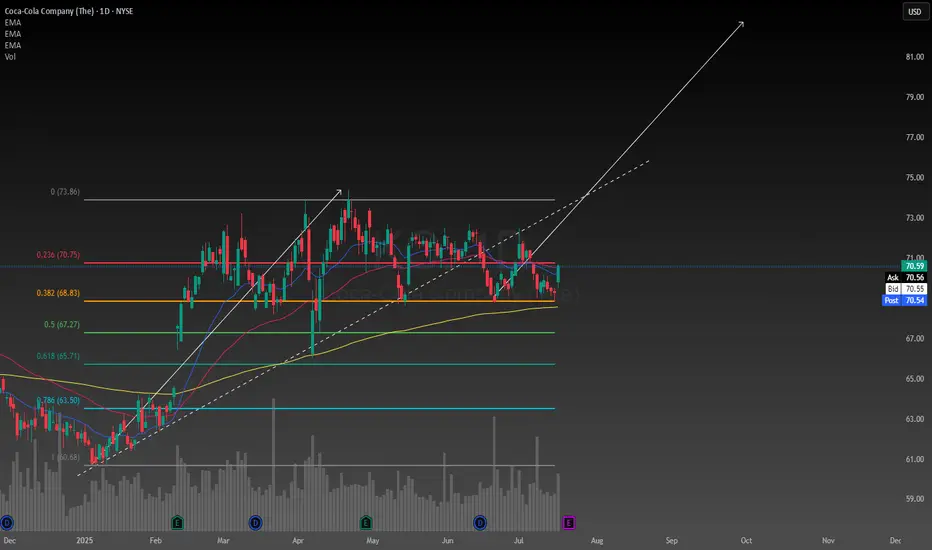
Simple Coca Cola daily chart analysisCoca Cola, my favorite defensive stock seems to be at a price decision in time. I have found a single trend line that looks reasonable. There seems to be a lot of congestion in price over the last few days this leads me to believe a breakout is coming soon. 25% of my portfolio is Coca Cola, it pays

See all ideas
Summarizing what the indicators are suggesting.
Oscillators
Neutral
SellBuy
Strong sellStrong buy
Strong sellSellNeutralBuyStrong buy
Oscillators
Neutral
SellBuy
Strong sellStrong buy
Strong sellSellNeutralBuyStrong buy
Summary
Neutral
SellBuy
Strong sellStrong buy
Strong sellSellNeutralBuyStrong buy
Summary
Neutral
SellBuy
Strong sellStrong buy
Strong sellSellNeutralBuyStrong buy
Summary
Neutral
SellBuy
Strong sellStrong buy
Strong sellSellNeutralBuyStrong buy
Moving Averages
Neutral
SellBuy
Strong sellStrong buy
Strong sellSellNeutralBuyStrong buy
Moving Averages
Neutral
SellBuy
Strong sellStrong buy
Strong sellSellNeutralBuyStrong buy
Displays a symbol's price movements over previous years to identify recurring trends.
CCCC
COCA-COLA CO 20/51Yield to maturity
6.97%
Maturity date
Mar 15, 2051
KO4982890
Coca-Cola Company 2.6% 01-JUN-2050Yield to maturity
6.79%
Maturity date
Jun 1, 2050
KO4982891
Coca-Cola Company 2.75% 01-JUN-2060Yield to maturity
6.74%
Maturity date
Jun 1, 2060
US191216DL1
COCA-COLA 21/51Yield to maturity
6.61%
Maturity date
Mar 5, 2051
KO4982889
Coca-Cola Company 2.5% 01-JUN-2040Yield to maturity
6.09%
Maturity date
Jun 1, 2040
CCCB
COCA-COLA 21/41Yield to maturity
6.03%
Maturity date
May 5, 2041
US191216CQ1
COCA-COLA CO 20/50Yield to maturity
5.93%
Maturity date
Mar 25, 2050
KO5807227
Coca-Cola Company 5.4% 13-MAY-2064Yield to maturity
5.72%
Maturity date
May 13, 2064
KO5868479
Coca-Cola Company 5.2% 14-JAN-2055Yield to maturity
5.65%
Maturity date
Jan 14, 2055
KO5807226
Coca-Cola Company 5.3% 13-MAY-2054Yield to maturity
5.60%
Maturity date
May 13, 2054
US191216CP3
COCA-COLA CO 20/40Yield to maturity
5.49%
Maturity date
Mar 25, 2040
See all KOC bonds
Curated watchlists where KOC is featured.


