NVIDIA: More Room in Wave BNvidia’s strong rally over recent weeks lifted the stock above resistance at $153.13. Despite a brief pullback on Tuesday, we still expect beige wave B to extend toward $178.39. Afterward, beige wave C should initiate a substantial correction, likely finding its low above $81.98 to complete blue wav
130 ARS
68.12 T ARS
121.98 T ARS
About NVIDIA
Sector
Industry
CEO
Jen Hsun Huang
Website
Headquarters
Santa Clara
Founded
1993
ISIN
ARBCOM460184
FIGI
BBG00P81VXD2
NVIDIA Corp engages in the design and manufacture of computer graphics processors, chipsets, and related multimedia software. It operates through the following segments: Graphics Processing Unit (GPU), Tegra Processor, and All Other. The GPU segment comprises of product brands, which aims specialized markets including GeForce for gamers; Quadro for designers; Tesla and DGX for AI data scientists and big data researchers; and GRID for cloud-based visual computing users. The Tegra Processor segment integrates an entire computer onto a single chip, and incorporates GPUs and multi-core CPUs to drive supercomputing for autonomous robots, drones, and cars, as well as for consoles and mobile gaming and entertainment devices. The All Other segment refers to the stock-based compensation expense, corporate infrastructure and support costs, acquisition-related costs, legal settlement costs, and other non-recurring charges. The company was founded by Jen Hsun Huang, Chris A. Malachowsky, and Curtis R. Priem in January 1993 and is headquartered in Santa Clara, CA.
Related stocks

NVDA Buyers Getting Squeezed? What Gamma & Price Action Say NextGEX-Based Options Insight (Gamma Exposure):
📉 NVDA is currently sitting at $152.54, just above a key PUT wall at $150, with GEX sentiment tilted bearish short-term.
* Highest Call Resistance / Gamma Wall: $160
This is the level with the strongest net positive GEX, acting as a cap where market makers

$NVDA ONCE IN A LIFETIME RARE Fibonacci HARMONICSNASDAQ:NVDA ONCE IN A LIFETIME RARE Fibonacci HARMONICS
NVDA is the NEW Fibonacci King the completion of the CYPHER was at 88 were I went long!
My Target is now 174 🎯up 200 grand on my account
I will ALERT here on the NEXT PLAY LOW RISK setup (NO CHARGE)
All I ask is DROP A 👍

Nvidia - New all time highs!Nvidia - NASDAQ:NVDA - breaks out now:
(click chart above to see the in depth analysis👆🏻)
Within two and a half months, Nvidia rallied more than +70%. Following this recent bullish strength, a retest of the previous highs was totally expected. But this does not seem to be the end at all. There

$NVDA - $270 PT in BULL ChannelThe stock is currently bouncing off of the lower channel line of the rising Bull Channel. Price action has created a Cup and Handle. The projected Price Objective sits at around $270. Remember, the height of the cup is the project target which from current stock price extends to around $270.

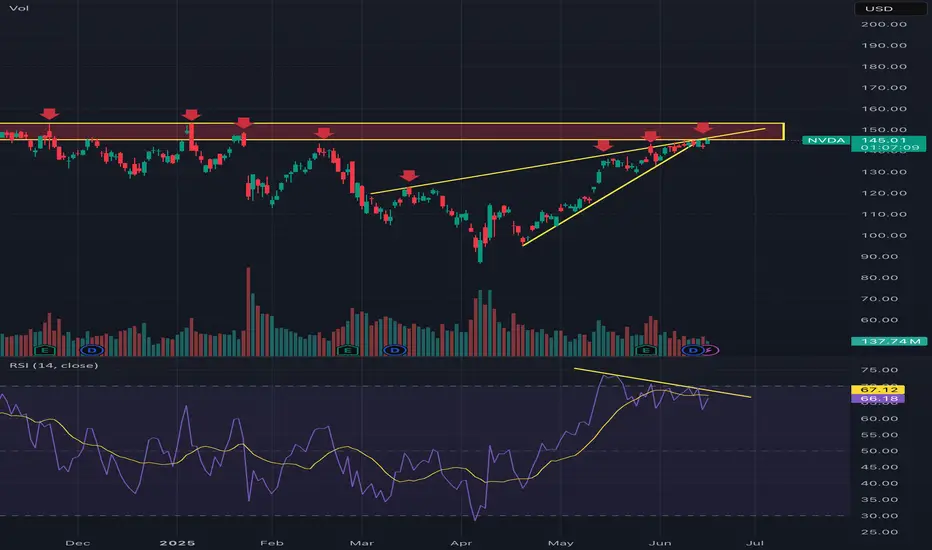
Nvidia into MAJOR resistance This will not be a popular opinion and that’s okay. The charts don’t lie and you can see it is into major resistance, highlighted by all the red arrows when it got rejected. It’s now broken down from a rising wedge which also lines up with said major resistance. I’ve also highlighted bearish RSI div
Nvidia Breaks Out and Stays OutNvidia has powered to new all-time highs, reclaiming its title as the world’s most valuable
company. The move is being driven by a blend of AI-fuelled optimism and technical resilience.
AI spending is alive and well
After a rocky start to the year, Nvidia’s resurgence has been fuelled by a sha

NVIDIA"It’s clear that this stock is currently in a strong upward wave and could advance toward wave 5 of 3, targeting the $1,090–$1,350 range. After reaching this zone, it may enter a corrective phase as wave 4, which could bring a pullback to the $150–$250 range. Following that, the stock is expected to

Nvidia - More Upside After Correction NVIDIA completed an irregular flat correction back in April. Since then, the price action has been strong and steady, forming higher highs and higher swing lows —a clear sign of bullish con-
continuation.
From an Elliott Wave perspective, the current move appears incomplete, as we cannot yet identif

$NVDA Tradespoon – Long Entry $152.62Tradespoon model generated long signal for NASDAQ:NVDA . Predicted range: $152.62–$158.22. Trend: -0.22%. NASDAQ:NVDA

See all ideas
Summarizing what the indicators are suggesting.
Oscillators
Neutral
SellBuy
Strong sellStrong buy
Strong sellSellNeutralBuyStrong buy
Oscillators
Neutral
SellBuy
Strong sellStrong buy
Strong sellSellNeutralBuyStrong buy
Summary
Neutral
SellBuy
Strong sellStrong buy
Strong sellSellNeutralBuyStrong buy
Summary
Neutral
SellBuy
Strong sellStrong buy
Strong sellSellNeutralBuyStrong buy
Summary
Neutral
SellBuy
Strong sellStrong buy
Strong sellSellNeutralBuyStrong buy
Moving Averages
Neutral
SellBuy
Strong sellStrong buy
Strong sellSellNeutralBuyStrong buy
Moving Averages
Neutral
SellBuy
Strong sellStrong buy
Strong sellSellNeutralBuyStrong buy
Displays a symbol's price movements over previous years to identify recurring trends.
NVDA4971918
NVIDIA Corporation 3.5% 01-APR-2050Yield to maturity
6.05%
Maturity date
Apr 1, 2050
NVDA4971919
NVIDIA Corporation 3.7% 01-APR-2060Yield to maturity
6.01%
Maturity date
Apr 1, 2060
NVDA4971917
NVIDIA Corporation 3.5% 01-APR-2040Yield to maturity
5.48%
Maturity date
Apr 1, 2040
US67066GAN4
NVIDIA 21/31Yield to maturity
4.56%
Maturity date
Jun 15, 2031
US67066GAE4
NVIDIA 2026Yield to maturity
4.27%
Maturity date
Sep 16, 2026
NVDA4971916
NVIDIA Corporation 2.85% 01-APR-2030Yield to maturity
4.20%
Maturity date
Apr 1, 2030
NVDA5203204
NVIDIA Corporation 1.55% 15-JUN-2028Yield to maturity
4.11%
Maturity date
Jun 15, 2028
See all NVDA bonds
Curated watchlists where NVDA is featured.


