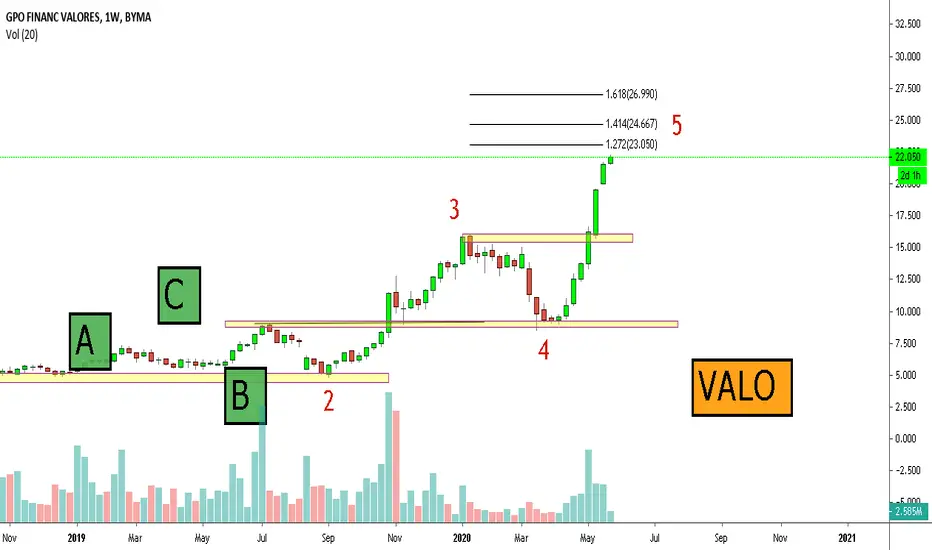
$VALO se aproxima a la primera barrera (cautela)VALO se aproxima a la primera barrera en una hipotetica nueva tendencia, luego de una tendencia bajista de mediano plano.
La Potente correcion (fibronacci 0,38) ocurrida luego de la gloriosa subida que tuvo entre el mes de abril a agosto parece para los optimistas concluida, sin embargo se aproxima
Next report date
—
Report period
—
EPS estimate
—
Revenue estimate
—
0.031 USD
20.54 M USD
469.89 M USD
About BANCO DE VALORES S.A.
Sector
Industry
CEO
N. Dante Alejandro Mathys
Website
Headquarters
Buenos Aires
Founded
1978
ISIN
ARBVAL3024G2
FIGI
BBG0149JC167
Banco de Valores SA engages in the provision of commercial banking activities. The company was founded in 1978 and is headquartered in Buenos Aires, Argentina.
Related stocks


$VALOBCBA:VALO Reproducí el patrón de velas entre el 04 y el 12 de junio para proyectar el precio de este papel. Utilice las últimas dos velas que encajan a la perfección con las de la proyección y obtuve que debería irse hasta el 1.5 de la extensión de Fibonacci en 9. Con el MACD rebotando sobre la lín


VALO - LONG - DAILYBCBA:VALO
Muy castigada. Perdió la correlación con BYMA(se venian comportando muy parecido), una de las dos tendría que ajustar.
Favorece la compra en la base del canal, y las ventas en la parte superior, se nota una divergencia en los mínimos con el LBR.
PRO:
- Riesgo chico, recompensa grande.

See all ideas
Summarizing what the indicators are suggesting.
Oscillators
Neutral
SellBuy
Strong sellStrong buy
Strong sellSellNeutralBuyStrong buy
Oscillators
Neutral
SellBuy
Strong sellStrong buy
Strong sellSellNeutralBuyStrong buy
Summary
Neutral
SellBuy
Strong sellStrong buy
Strong sellSellNeutralBuyStrong buy
Summary
Neutral
SellBuy
Strong sellStrong buy
Strong sellSellNeutralBuyStrong buy
Summary
Neutral
SellBuy
Strong sellStrong buy
Strong sellSellNeutralBuyStrong buy
Moving Averages
Neutral
SellBuy
Strong sellStrong buy
Strong sellSellNeutralBuyStrong buy
Moving Averages
Neutral
SellBuy
Strong sellStrong buy
Strong sellSellNeutralBuyStrong buy
Displays a symbol's price movements over previous years to identify recurring trends.
Frequently Asked Questions
The current price of VALOD is 0.283 USD — it has decreased by −2.41% in the past 24 hours. Watch BANCO DE VALORES S.A. stock price performance more closely on the chart.
Depending on the exchange, the stock ticker may vary. For instance, on BCBA exchange BANCO DE VALORES S.A. stocks are traded under the ticker VALOD.
VALOD stock has fallen by −8.71% compared to the previous week, the month change is a 1.07% rise, over the last year BANCO DE VALORES S.A. has showed a −9.58% decrease.
VALOD reached its all-time high on Dec 18, 2024 with the price of 0.460 USD, and its all-time low was 0.118 USD and was reached on Mar 16, 2020. View more price dynamics on VALOD chart.
See other stocks reaching their highest and lowest prices.
See other stocks reaching their highest and lowest prices.
VALOD stock is 2.47% volatile and has beta coefficient of 0.45. Track BANCO DE VALORES S.A. stock price on the chart and check out the list of the most volatile stocks — is BANCO DE VALORES S.A. there?
Today BANCO DE VALORES S.A. has the market capitalization of 241.49 M, it has decreased by −5.65% over the last week.
Yes, you can track BANCO DE VALORES S.A. financials in yearly and quarterly reports right on TradingView.
BANCO DE VALORES S.A. is going to release the next earnings report on Sep 3, 2025. Keep track of upcoming events with our Earnings Calendar.
VALOD net income for the last quarter is 12.58 M USD, while the quarter before that showed 7.87 M USD of net income which accounts for 59.82% change. Track more BANCO DE VALORES S.A. financial stats to get the full picture.
Yes, VALOD dividends are paid monthly. The last dividend per share was 0.01 USD. As of today, Dividend Yield (TTM)% is 2.82%. Tracking BANCO DE VALORES S.A. dividends might help you take more informed decisions.
Like other stocks, VALOD shares are traded on stock exchanges, e.g. Nasdaq, Nyse, Euronext, and the easiest way to buy them is through an online stock broker. To do this, you need to open an account and follow a broker's procedures, then start trading. You can trade BANCO DE VALORES S.A. stock right from TradingView charts — choose your broker and connect to your account.
Investing in stocks requires a comprehensive research: you should carefully study all the available data, e.g. company's financials, related news, and its technical analysis. So BANCO DE VALORES S.A. technincal analysis shows the sell today, and its 1 week rating is buy. Since market conditions are prone to changes, it's worth looking a bit further into the future — according to the 1 month rating BANCO DE VALORES S.A. stock shows the neutral signal. See more of BANCO DE VALORES S.A. technicals for a more comprehensive analysis.
If you're still not sure, try looking for inspiration in our curated watchlists.
If you're still not sure, try looking for inspiration in our curated watchlists.