LE1! LongLE1! is now net long on the regression break.
The roll on this commodity is (+1.3%) Long.
I am not taking this trade.
BGIX2025 trade ideas

Live Cattle ShortLE1! is not net short on the regression break.
The roll short is (-5.5%)
I am not taking this trade.

Len Hogs LongLen Hogs Long on the regression break.
I the roll is (-4.5%) on the front month contract.
I am not taking this trade.

brazilian cattle trend Upcattle prices are currently in an uptrend, showing signs of increasing value. Investors and producers are optimistic as the market experiences stronger demand and limited supply.

Brazilian cattle trend down The Brazilian cattle market has entered a downtrend, with prices poised to test recent lows. High supply and weaker domestic demand, coupled with export challenges, are driving the decline, as meatpackers face pressure to adjust to shifting market dynamics.

Livestock Price Volatility: Trading Cattle and Hog FuturesThe US livestock market is experiencing significant price volatility in 2025, as outlined in the USDA’s April 2025 World Agricultural Supply and Demand Estimates (WASDE) report. Cattle prices are projected to rise to $206 per cwt, driven by robust demand, while hog prices are lowered to $61 per cwt due to weaker export demand amid tariffs and global competition. These divergent price trends, coupled with production shifts—such as reduced pork output—create a dynamic trading environment for livestock futures. This article analyzes the market with updated price action for cattle futures.
Livestock Market Dynamics: Diverging Price Trends
Cattle prices are raised to an annual average of $206 per cwt, up from the prior estimate of $200, reflecting strong domestic demand and reported data through Q1 2025. This bullish outlook for cattle is supported by higher beef production forecasts, now at 26.767 billion pounds (up from 26.752 billion), driven by heavier dressed weights and increased cow and bull slaughter, though steer and heifer slaughter is lower. Beef exports, however, are reduced to 2.685 billion pounds (down from 2.820 billion) due to tariffs and non-tariff barriers in China, while imports are also down to 4.860 billion pounds, reflecting higher tariffs on foreign suppliers.
In contrast, hog prices are lowered to $61 per cwt, down from $63, as weaker export demand overshadows a slight increase in Q1 prices. Pork production is reduced to 28.090 billion pounds (down from 28.440 billion), reflecting lower slaughter and weights, with the March 27 Quarterly Hogs and Pigs report indicating smaller pig crops in 2024 and reduced farrowings through much of 2025. Pork exports are also down to 6.955 billion pounds (from 7.220 billion), impacted by increased tariffs on US shipments to China and price competition from other exporters, such as Brazil and the EU.
These divergent price movements—cattle prices up 3% to $206 per cwt and hog prices down 3% to $61 per cwt—create a unique opportunity for traders to exploit the volatility in livestock futures, particularly through mean-reversion or trend-following strategies.
Market Context: Supply and Demand Shifts
The broader livestock market context adds complexity to the trading landscape. Total red meat and poultry production is lowered to 108.154 billion pounds (down from 108.467 billion), reflecting declines in pork and turkey output, though broiler production is raised to 47.775 billion pounds (up from 47.700 billion) due to improved returns in the second half of 2025. Beef ending stocks are slightly down to 580 million pounds (from 585 million), while pork ending stocks remain steady at 425 million pounds, indicating a balanced but constrained supply picture.
Global trade dynamics, particularly the US-China trade war, are a key driver of export challenges. The WASDE report notes that pork exports to China face increased tariffs, reducing shipments, while beef exports are similarly impacted by non-tariff barriers. This export weakness, combined with domestic production adjustments, suggests that price volatility in livestock futures will persist, offering opportunities for traders to capitalize on short-term price swings.
Trading Signals and Strategies
The livestock market’s price divergence provides clear trading signals for futures traders. Cattle futures CME:LE1! are showing a shift in momentum with updated price action, while hog futures CME:HE1! face bearish pressure at $61 per cwt. As of April 24, LE futures are trading at $207.725 per cwt, slightly down from a recent high of $207.945, and HE futures are at $60.50 per cwt, setting the stage for distinct trading strategies.
The outlook for cattle remains bullish in the longer term, with prices projected at $206 per cwt and strong domestic demand, but short-term price action suggests caution. LE futures have encountered resistance near $207.945 and are now testing $207.725, with a bearish MACD crossover (MACD at 1.821, signal at 1.823) indicating downward momentum. A break below $207 could signal a move to the next support at $206, offering a 1% downside in the short term.
For a reversal play, if LE futures hold above $206 and reclaim $207.945 with strong volume and a MACD crossover above the signal line, prices could target the next resistance at $209, a 1% gain. This setup would require a shift in momentum, potentially driven by renewed domestic demand or easing export barriers.
For hog futures, the bearish outlook with prices at $61 per cwt and exports down to 6.955 billion pounds suggests a shorting opportunity. HE futures are testing support at $60, with the 50-day moving average at $62 acting as resistance. A break below $60, confirmed by a bearish MACD crossover and an RSI drop below 40, could signal a move to $58, a 3-4% downside. The WASDE’s reliability data shows a 2.1% root mean square error for pork production forecasts, indicating potential volatility if future reports adjust output estimates significantly.
Alternatively, traders can exploit the price divergence between cattle and hogs through a mean-reversion strategy. The spread between LE and HE futures—currently around $147.225 per cwt ($207.725 minus $60.50)—is near a 52-week high, suggesting potential for convergence if hog prices stabilize or cattle prices cool. Traders can short LE futures and go long on HE futures, targeting a spread contraction to $146, while monitoring export data and production updates for shifts in sentiment.
Risks to Watch
Trading livestock futures involves risks, particularly given the export-driven volatility. The US-China trade war, with tariffs reducing pork exports to 6.955 billion pounds and beef exports to 2.685 billion pounds, could further dampen demand if global economic growth slows. The WASDE’s historical data indicates a 90% confidence interval of ±3.5% for pork production forecasts, meaning estimates can vary by up to 983 million pounds, introducing uncertainty. Additionally, domestic demand strength for cattle (supporting the $206 per cwt price) could weaken if recession fears intensify, while unexpected production increases in pork could pressure hog prices further.
The livestock market, as detailed in the WASDE report, offers traders a volatile yet opportunity-rich environment, with cattle prices rising to $206 per cwt and hog prices falling to $61 per cwt. LE futures, now at $207.725 per cwt, present a short-term bearish setup targeting $206 for a 1% downside, though a reversal to $209 or a mean-reversion strategy on the LE-HE spread (currently $147.225, targeting $146) provides alternatives. HE futures offer a bearish shorting opportunity, aiming for $58 with a 3-4% profit potential.

Lean Hogs LongLE1! Futures are not net long on the regression break.
The roll on the front month on this instrument is (-8.8%)
I am not taking this trade.

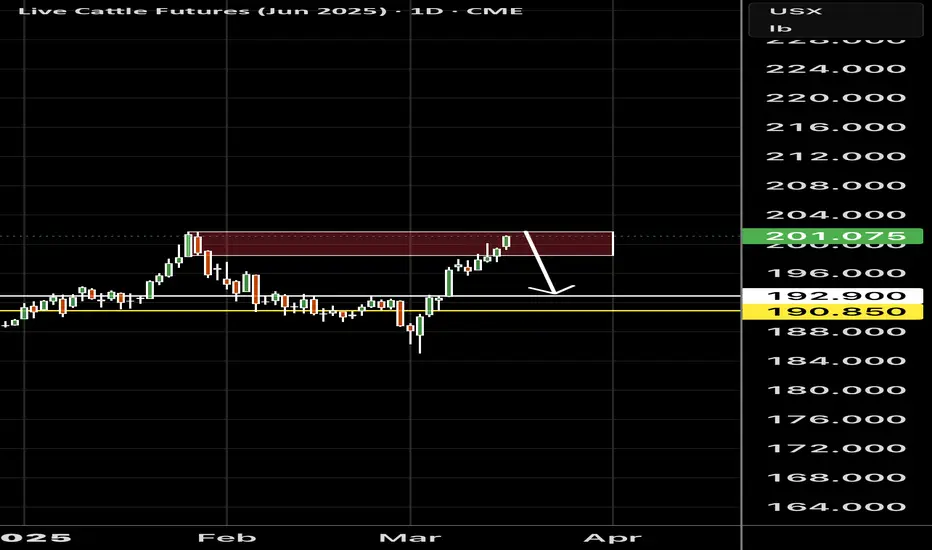
Short term sizable correction before new highsI haven't updated my cattle idea in awhile, but it's been trading like I figured, since Feb. We've now hit multiple technical targets in this pocket up here. I think there's a good chance we get a decent correction from here down to the 198-197 area, although it could easily retrace down lower, more violent and sharp with fund long covering and momentum. Long term I am still bullish with my original idea back at the beginning of the year, and think we can get that 217-218 target in the fall.
My last idea this is continuing:

June fats into the order blockJune fats have set up a sell and a possible push back down from the order block…
Looking for sideways to higher before new lowsThis is a continuation of my recent first TV post a couple weeks ago. It looks even better confirmed now that the 208 area was our short to intermediate term top in cattle. There is a possibility it was THE top, if we close below our 189 wave 1 area, especially on a weekly basis for conservative confirmation. Then it'd be 2015 all over again, the likely confirmed end of the larger cattle bull cycle. My preferred take is still for new all-time highs later this year though. We were extremely overbought, the funds at record long, and technical indicators all showing us we were due for a notable top and heavy correction. Here we have been getting the hard down the last couple weeks. I feel that today's 38.2% retracement back to the 8/21/24 low at 195.50 is a good area to look for some interim strength, or at least basing. This wave 4 down is likely to be complex and longer-driven, as wave 2 was a simple zigzag and short and to the point. It's quite possible we drag this thing out until sometime in April for a seasonally weaker time frame, before making a final 5th wave up. Seasonality and some other indication points to a possible major trend change in September of this year, so that's possibly when we finally drag out the top wave 5 in? It could be quite a bit sooner though too. I still like the idea of the 220 area in the longterm, and it's still possible with EW technicals, as although wave 5 would be "longer than the norm" when wave 3 is extended (it looks to have been), wave 5 could still be 0.618 of wave 1+3 which would get you around that 220 area if we do indeed drop down to the 190 area for wave 4. It could also be shallower than that, but it's likely to be complex like a flat or triangle in here either way.
My related post:

Cattle Update: Changes in Program and Data PublicationFollowing the 2022 Census of Agriculture, changes were implemented in the cattle program. Starting January 2025, a reduced number of data items are being published for the following states: Alaska (AK), Connecticut (CT), Delaware (DE), Hawaii (HI), Indiana (IN), Louisiana (LA), Maine (ME), Maryland (MD), Massachusetts (MA), Mississippi (MS), Nevada (NV), New Hampshire (NH), New Jersey (NJ), North Carolina (NC), Rhode Island (RI), South Carolina (SC), Utah (UT), Vermont (VT), and West Virginia (WV). Despite this reduction, key estimates such as the total inventory of all cattle and calves, all cows inventory, and calf crop are still published for all states.
At the state level, data publication has been streamlined to focus on essential metrics while maintaining consistency with national totals. For instance, Texas, one of the largest cattle-producing states, saw its total cattle and calves inventory decline from 11,700,000 head in 2024 to 11,800,000 head in 2025, representing a slight increase of 1%. Meanwhile, smaller states like Delaware experienced more pronounced fluctuations, with its inventory decreasing by 4% over the same period.
In addition to these program changes, revisions to previous estimates were conducted to ensure accuracy and reliability. All inventory and calf crop estimates for July 1, 2023, and January 1, 2024, were reviewed using updated data on calf crop, official slaughter records, import and export statistics, and new survey information.
Based on this review :
• The estimate for all cows and heifers that have calved decreased by 0.3% as of July 1, 2023, and by 0.6% as of January 1, 2024.
• The 2023 calf crop estimate was revised downward by 0.1%.
State-level estimates were also reviewed, leading to reallocations of inventory figures to align with the United States total. For example, the inventory of beef cows that have calved in Nebraska was adjusted downward by 4%, while milk cow inventories in California remained relatively stable, increasing by only 1%.
Revisions are an ongoing process aimed at improving year-to-year and item-to-item relationships. Estimates for the previous year are subject to revision when current estimates are prepared, with updates primarily driven by livestock slaughter data, foreign trade figures, and additional survey results. Furthermore, estimates will be reviewed after the release of data from the five-year Census of Agriculture, after which no further revisions will be made.
The reliability of these estimates is supported by rigorous statistical methodologies. Over the past 10 years, the "Root Mean Square Error" for all cattle and calves inventory estimates has averaged 0.4%, meaning there is a 2-in-3 chance that the final estimate will not deviate from the current estimate by more than 0.4%. At the 90% confidence level, this margin increases to 0.7%. Historical data shows that changes between the first and latest estimates have averaged 234,000 head, ranging from 0 to 627,000 head.
All together, these program adjustments and revisions underscore the commitment to delivering precise and actionable insights into the cattle sector. By balancing comprehensive data collection with operational efficiency, stakeholders can make much more informed decisions regarding production planning, pricing strategies, and resource allocation. This approach ensures that users receive reliable and up-to-date information to navigate the complexities of modern agriculture.

Cattle Inventory and Classification for January 31Overview
The cattle inventory report provides a comprehensive breakdown of cattle and calf populations across the United States, categorized by class. This data is essential for understanding trends in livestock production, market dynamics, and agricultural planning.
Key Highlights
• National Inventory. As of January 1, 2025, the total inventory of all cattle and calves stood at 86,662,200 head, representing a slight decline from 87,157,400 head in 2024.
• State-Level Data. While national figures offer a broad perspective, state-level inventories provide granular insights into regional contributions to the overall cattle population.
• Classifications. Cattle are classified into various categories, including beef cows, milk cows, heifers, steers, bulls, and calves under 500 pounds. Each category reflects specific segments of the cattle industry.
Notable Changes
Beef Cows. The inventory of beef cows that have calved decreased slightly, with numbers dropping from 28,013,000 head in 2024 to 27,863,500 head in 2025.
Milk Cows. Milk cow inventories also showed minor fluctuations, reflecting shifts in dairy production levels.
Implications for the Market
Understanding cattle inventory by class helps stakeholders anticipate supply and demand dynamics. For instance, a decrease in beef cow inventories may signal tighter supplies of feeder cattle, potentially driving up prices.
Conversely, stable or increasing milk cow numbers could indicate steady or growing demand for dairy products.
The cattle inventory report serves as a critical tool for farmers, ranchers, policymakers, and investors seeking to navigate the complexities of the livestock sector.
Calf Crop Estimates
The calf crop estimates provide critical insights into the reproductive performance of the cattle industry, reflecting the number of calves born during specific periods. These estimates are vital for understanding future supply dynamics and planning for market demands. According to the latest data, the total calf crop for 2023 was reported at 33,563,000 head, with a slight decrease to 33,529,500 head in 2024.
National totals are complemented by state-level estimates, offering a more granular view of regional contributions to the overall calf crop. For instance, states like Texas and Nebraska consistently rank among the top contributors, while smaller states may show more variability year over year. The report also breaks down calf crop figures into six-month periods, allowing for a more detailed analysis of seasonal trends.
Revisions to previous estimates have been made based on updated slaughter, import, and export data, ensuring greater accuracy. For example, the 2023 calf crop estimate was revised downward by 0.1 percent following a comprehensive review. Such adjustments help refine projections and improve the reliability of future forecasts.
Understanding calf crop trends is essential for stakeholders across the livestock sector, from ranchers planning breeding cycles to traders evaluating market conditions.

Live Cattle Futures short on Regression BreakThe regression break bring a short bias on in the market.
The Futures Roll = +2% per a month.
I will not trade this pair.

Overdue for a strong correction before higher yet?Here is my current view of LC. Like many others, I never thought it would get this high in the first place. But following and adapting with this runaway longwinded bull, the funds are very long and as they unwind (it already looks to have started), it's gonna be a sharp downward move. There's good support and technical retracement down around the 190 region, but panic and momentum and long liquidation turning to even shorts could get thing uglier yet. I currently expect to eventually shoot back to new highs, perhaps targeting 220 region.

Beef Prices Soar: A Global Trend Beyond BrazilBeef prices are hitting historic highs across the globe, not just in Brazil, as many tend to believe. The surge isn’t isolated to meat alone; rice, chicken, and olive oil prices are following a similar upward trajectory. This global trend highlights an important point: political factors have minimal influence on price movements in this context. Instead, it’s driven by a complex mix of supply chain disruptions, increased demand, and other economic factors. Understanding these dynamics is crucial. Relying on political narratives to explain price changes is misleading. Stay informed, make data-driven decisions, and don’t fall into political traps that distract from the real issues at hand. Knowledge is your most powerful tool in navigating these challenging times.

fats testing the small upside break here at 19020Fats retesting a small uptrend line after breaking last week.. A bearish candle close today would be good .. Risk reward looks to be rich here

Fats on the monthly chart choppin in a nice order blockFats look like they may take a tumble as we are trading in a nice monthly order block.

Long live cattleLive cattle went to the eight hour fib and has started to create a bounce. With corn, soy beans, and we even wheat up 2 to 4% today. Live cattle is going to potentially make up that gap in the next few days.

Is Cattle Setting A Bear Flag?Live Cattle
Technicals (October - V)
October live cattle futures continued to trade in a choppy manner but did tack on some gains at the close. Fear in the outside markets has subsided some which has calmed the nerves some. First resistance for today's trade comes in from 180.575-181.175. If the Bulls can chew through that pocket a retest of the 50% retracement (the midpoint of the recent high to low) could be in order, that comes in at 182.675. We continue to be in the camp that relief rallies are likely to be viewed as selling opportunities, particularly in the back months and for those who need to protect/hedge the physical. On the support side of things,
Resistance: 180.575-181.175***, 182.675-183.275****
Pivot: 179.35-180.50
Support: 176.35-176.22***
Weekly Export Sales
Beef: Net sales of 10,000 MT for 2024 were down 43 percent from the previous week and 27 percent from the prior 4-week average.
Daily Livestock Summary
Yesterday's cutout values were softer with choice cuts down 1.96 to 313.85 and select cuts down .79 to 298.83. The 5-area average price for live steers was reported at 192.67. Daily slaughter came in at 122k head, in line with last week and last year. Week to date slaughter stands at 363k head.
Check out CME Group real-time data plans available on TradingView here: www.tradingview.com
Disclaimers:
CME Real-time Market Data help identify trading set-ups and express my market views. If you have futures in your trading portfolio, you can check out on CME Group data plans available that suit your trading needs www.tradingview.com
*Trade ideas cited above are for illustration only, as an integral part of a case study to demonstrate the fundamental concepts in risk management under the market scenarios being discussed. They shall not be construed as investment recommendations or advice. Nor are they used to promote any specific products, or services.
Futures trading involves substantial risk of loss and may not be suitable for all investors. Trading advice is based on information taken from trade and statistical services and other sources Blue Line Futures, LLC believes are reliable. We do not guarantee that such information is accurate or complete and it should not be relied upon as such. Trading advice reflects our good faith judgment at a specific time and is subject to change without notice. There is no guarantee that the advice we give will result in profitable trades. All trading decisions will be made by the account holder. Past performance is not necessarily indicative of future results.

Brazilian cattle trend upCattle in brazil has been suffering for quite some time.... for moment its trend up!

Buy The Dip in Live Cattle? Cattle futures have gotten hit hard over the last few weeks as headline risk coupled with bearish seasonal tendencies have led to long liquidation from Funds.
The selling pressure accelerated on March 26th as headlines of Avian flue spreading to (dairy) cattle in Texas and Kansas swept across all the different agricultural news wires and raised concerns of further spread. This news comes on what is a seasonally weaker time of year for the cattle markets. Looking at the markets in the week prior to the March 26th headline it seemed as though the market was starting to stall as it was as Funds may have been looking to reduce exposure ahead of the seasonal weakness, the headlines were perhaps the catalyst that sparked the proverbial rush for the exits.
Looking at the weekly Commitment of Traders report we see that Funds came into the year with a net long position of 17,415 contracts. The smallest net long position of the year was 12,993 on 1/16/24. After that, it was 8 consecutive weeks of buying which propelled funds to a net long of 63,311 contracts. The most recent report shows funds net long 53,281. Historically (not guaranteed) we’ve see the seasonal weakness start to subside in the last week of April. If weakness persists up to that point and fundamentals (the cash cattle trade) can remain somewhat firm, it may represent a good opportunity to the long side.
So, what does it mean to us? Well, the chart and seasonals favor the Bears right now, but this will be on our radar for a potential trend reversal in the coming weeks, ideally from lower price levels.
Check out CME Group real-time data plans available on TradingView here: www.tradingview.com
Disclaimers:
CME Real-time Market Data help identify trading set-ups and express my market views. If you have futures in your trading portfolio, you can check out on CME Group data plans available that suit your trading needs www.tradingview.com
*Trade ideas cited above are for illustration only, as an integral part of a case study to demonstrate the fundamental concepts in risk management under the market scenarios being discussed. They shall not be construed as investment recommendations or advice. Nor are they used to promote any specific products, or services.
Futures trading involves substantial risk of loss and may not be suitable for all investors. Trading advice is based on information taken from trade and statistical services and other sources Blue Line Futures, LLC believes are reliable. We do not guarantee that such information is accurate or complete and it should not be relied upon as such. Trading advice reflects our good faith judgment at a specific time and is subject to change without notice. There is no guarantee that the advice we give will result in profitable trades. All trading decisions will be made by the account holder. Past performance is not necessarily indicative of future results.

Explosion in the price of live cattleThis commodity has been trending since 2020, and recently made a new high just after a moderate pullback.
It is going up in a straight line, currently hovering around resistance/support, the MA100 started pointing up and the price made a bullish pattern.
The target for such a pattern is approximately the size of the pole which brings us to about 210.
With cattle there are no Elliott Waves it just does whatever it wants.
Because it is trending so strongly the risk to reward is something ridiculous.
And it could certaintly keep going up and up and up.
If you look at the all time chart you will notice LE has not trended like this ever. Something is going on. Bubble time.
The latest CME article is 6 months old, they talk about a contraction in the US cattle market (which is part of the cattle cycle theory which is more than 2 century old).
www.cmegroup.com
The US cattle inventory is the smallest in 73 years, that plus inflation means the price logically should be the highest ever.
People are addicted to macdonald's and are not going to give up their burgers, the Biden adminitration is going to have to do something I don't care what as long as it makes me money.
www.fb.org
Watch up expiry is in a few days, it might be a good idea to wait, also we are a bit early in the triangle pattern (but it feels like it could mega-break anytime).
If you trade this make sure to use guaranteed stop or another good form of risk management, it often gaps alot.
With a certain broker that has guaranteed stop the minimum risk you can take is $400 so this is not for everyone, depends on your broker.
I believe this is absolutely worth taking a 1% risk, and adding to it if it becomes a big winner.

Cattle short!Cattle futures just came back to previous resistance. we had a really good rejections.
I expect donwside movement.
Dont forget to setup the stop loss!!!
