Key facts today
17,667.49
0.03 BRL
18.51 B BRL
1.32 T BRL
About The Cigna Group
Sector
Industry
CEO
David Michael Cordani
Website
Headquarters
Bloomfield
Founded
1792
ISIN
BRC1ICBDR000
FIGI
BBG00R4Z5Z50
The Cigna Group is a global health company, which engages in the provision of global health services. It operates through the following segments: Evernorth Health Services, Cigna Healthcare, Other Operations, and Corporate. The Evernorth Health Services segment partners with health plans, employers, governmental organizations, and health care providers to solve challenges in the areas of pharmacy benefits, home delivery pharmacy, specialty pharmacy, specialty distribution, and care delivery and management solutions. The Cigna Healthcare segment includes the U.S. Healthcare and International Health operating segments, which provide comprehensive medical and coordinated solutions to clients and customers. The Other Operations segment consists of the remainder of business operations, which includes certain ongoing businesses and exited businesses. The Corporate segment refers to net interest expense, certain litigation matters, expense associated with frozen pension plans, charitable contributions, operating severance, certain overhead and enterprise-wide project costs, and eliminations for products and services sold between segments. The company was founded in 1792 and is headquartered in Bloomfield, CT.
Related stocks

Cigna Stock Chart Fibonacci Analysis 051625Trading Idea
1) Find a FIBO slingshot
2) Check FIBO 61.80% level
3) Entry Point > 311/61.80%
Chart time frame: D
A) 15 min(1W-3M)
B) 1 hr(3M-6M)
C) 4 hr(6M-1year)
D) 1 day(1-3years)
Stock progress: A
A) Keep rising over 61.80% resistance
B) 61.80% resistance
C) 61.80% support
D) Hit the bottom

Simply looking to retrace and continueAn area of consolidation here as it looks for a revival, possibly a false flag before a breakout, but it is overwhelmed, and any attempt at a breakout could be considered too good.
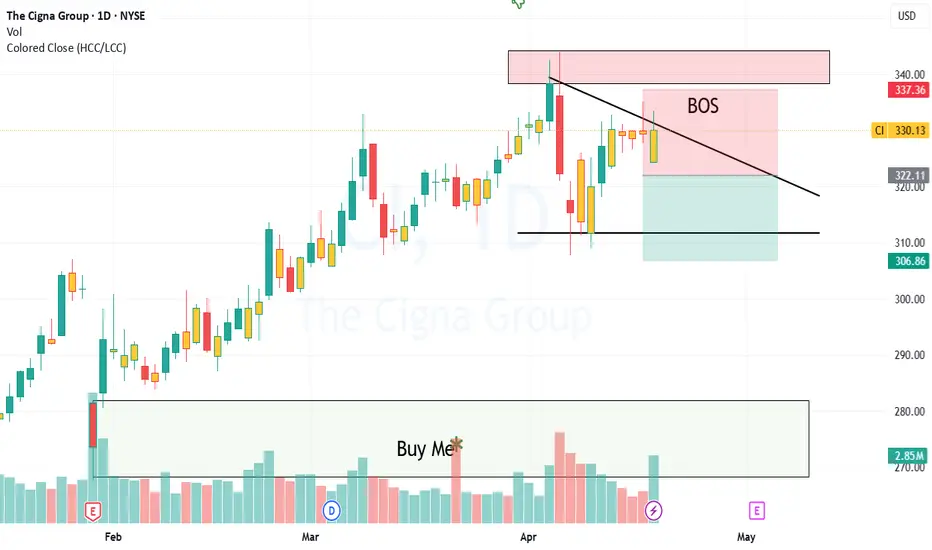
A lot of indicators against this looking for correctionThe Bears are still firmly in control. Also, remember that it hasn't beaten its last high; the LS and BOS oscillators are overbought, and it will find its firm place.

CI in Sell ZoneMy trading plan is very simple.
I buy or sell when at least two of these events happen:
* Price tags the top or bottom of parallel channel zones
* Money flow spikes beyond it's Bollinger Bands
* Price at Fibonacci levels
So...
Here's why I'm picking this symbol to do the thing.
Price in selling

Looking for a breakout swing on CI!🔉Sound on!🔉
📣Make sure to watch fullscreen!📣
Thank you as always for watching my videos. I hope that you learned something very educational! Please feel free to like, share, and comment on this post. Remember only risk what you are willing to lose. Trading is very risky but it can change your life!

CIGNA Stock Chart Fibonacci Analysis 010825Trading idea - Entry point > 270/61.80%
1) Find a FIBO slingshot
2) Check FIBO 61.80% level
3) Entry Point > 270/61.80%
Chart time frame: D
A) 15 min(1W-3M)
B) 1 hr(3M-6M)
C) 4 hr(6M-1year)
D) 1 day(1-3years)
Stock progress: C
A) Keep rising over 61.80% resistance
B) 61.80% Resistance
C) 61.80%

Cigna (Extended Hours) | Chart & Forecast SummaryKey Indicators On Trade Set Up In General
1. Push Set Up
2. Range Set up
3. Break & Retest Set Up
Notes On Session
# Cigna (Extended Hours)
- Double Formation
* 370.20 USD | Trend Line Configuration | Subdivision 1
* 314.55 USD | Trend Line Support | Entry Settings | Continuation
- Triple Formatio

CI looking to reverseCigna Group did experience a very high valuation leading into this dump for insurance stocks. Technically it has traced past the golden fib and past a macro support trend. With a broadening BBWP you will notice increased volatility, I also note a bottoming stochastic RSI. I am personally not interes

$CIcoming up on a 4 year trend line, looking to get into 6/20 350c if we see it hold up. Had a hard time finding alot of open interest on the longer dated strikes.

See all ideas
Summarizing what the indicators are suggesting.
Oscillators
Neutral
SellBuy
Strong sellStrong buy
Strong sellSellNeutralBuyStrong buy
Oscillators
Neutral
SellBuy
Strong sellStrong buy
Strong sellSellNeutralBuyStrong buy
Summary
Neutral
SellBuy
Strong sellStrong buy
Strong sellSellNeutralBuyStrong buy
Summary
Neutral
SellBuy
Strong sellStrong buy
Strong sellSellNeutralBuyStrong buy
Summary
Neutral
SellBuy
Strong sellStrong buy
Strong sellSellNeutralBuyStrong buy
Moving Averages
Neutral
SellBuy
Strong sellStrong buy
Strong sellSellNeutralBuyStrong buy
Moving Averages
Neutral
SellBuy
Strong sellStrong buy
Strong sellSellNeutralBuyStrong buy
Displays a symbol's price movements over previous years to identify recurring trends.
E
CI4379435
Express Scripts Holding Company 4.8% 15-JUL-2046Yield to maturity
7.20%
Maturity date
Jul 15, 2046
E
CI3954173
Express Scripts Holding Company 6.125% 15-NOV-2041Yield to maturity
6.27%
Maturity date
Nov 15, 2041
See all C1IC34 bonds
Curated watchlists where C1IC34 is featured.

