NEE watch $67.21-67.34: Key Resistance zone to Recovery WaveNEE struggling against a well proven resistance zone.
$67.21-67.34 is the immediate resistance of note.
$68.78-68.40 is next resistance and scalp target.
Key facts today
27,135.14
0.00 BRL
37.45 B BRL
131.57 B BRL
About NextEra Energy, Inc.
Sector
Industry
CEO
John W. Ketchum
Website
Headquarters
Juno Beach
Founded
1925
ISIN
BRNEXTBDR006
FIGI
BBG00P14K5R1
NextEra Energy, Inc. engages in the provision of renewable energy. It operates through the following segments: FPL and NEER. The FPL segment involves the generation, transmission, distribution, and sale of electric energy in Florida. The NEER segment produces electricity from clean and renewable sources, including wind and solar. The company was founded on December 28, 1925 and is headquartered in Juno Beach, FL.

Stock Of The Day / 05.22.25 / NEE05.22.2025 / NYSE:NEE
Fundamentals . Negative background due to the bill to cancel tax benefits for clean energy companies.
Technical analysis.
Daily chart: Downtrend.
Premarket: Gap Down on moderate volume.
Trading session: The primary impulse from the opening of the session was stop

Bullish on NEEI believe energy consumption is going to grow and has Y-o-Y increment in the energy sector.
NEE has increasing price and volume trend. Got both bullish signal supported by my strategy of price and volume.
Although last quarter report shows a bit down in the fundamental section. Well dividend yiel

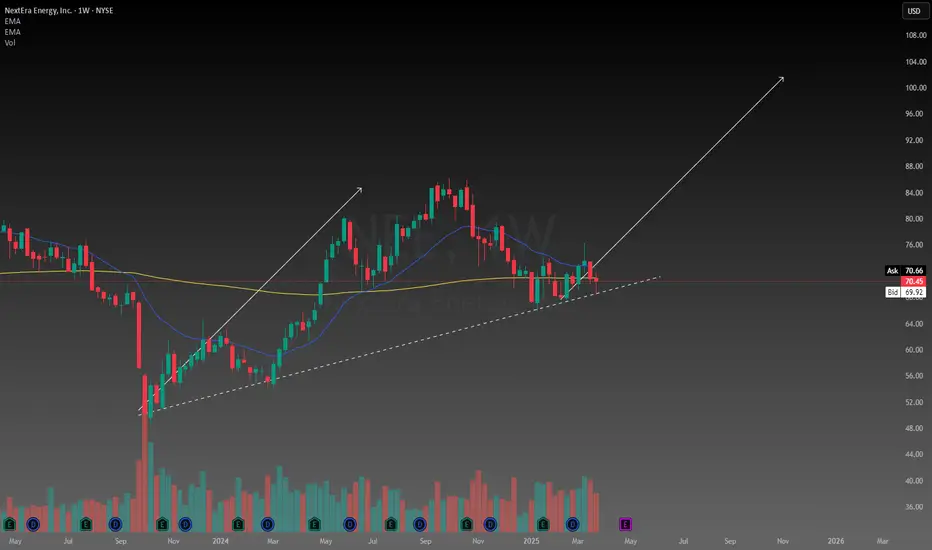
Next Era trade ideaA company dedicated to clean energy, focusing on solar and wind. With a large market cap and operating throughout Canada and the US, this company has proven itself being able to be profitable and grow. It looks like price has found support at the trend line and its possible we can get a second leg u
Defensive Sector with Growth PotentialSupporting Arguments
Current Market Uncertainty Sustains Demand for the Defensive Sector. NEE represents the defensive utility sector. Given the current political and economic uncertainty in the market, there could be an additional catalyst for the company's stock price growth.
Demand for Gree

Triangle Breakout for NextEra Energy. NEEPivots are always hard to pick. I can see at least two triangles here, which have both been broken out of. It may be an early impulse to a down going Elliott diagonal.
Volatility, momentum has been less and less bearish, while Bollinger Band derivative indicator is all over the place.
Yet, MIDAS

$NEE 75% PROFIT. *****DINOSOUR PATTERN***ESP and Book Value keep rising. Price keeps pushing up against the ceiling. The pressure is increasing and eventually the the ceiling will break.

The Quantum Capitalist $MU & $NEE Analysis 1/21/2025Simple strategy using top-down analysis to find entries, profit targets, and options contracts on Micron and Nextera Energy

To the TOPThe price is climbing back within the green channel.
In recent weeks, it reached the long-term support area of $65-66 (indicated in blue) and regained strength.
Now it is preparing to break the purple resistance in the coming week.
A close above will start the next bullish impulse towards the ATH i

LNG on NEE with proper STP LOSS placementThe Setup
The Long-term(M) chart is in an downtrend
The current-term(W) chart is in new formed uptrend
The small-term(D) chart used to ENTER and EXIT
The odd Enhancers
- the ENTER was in the DZ (demand zone) of the (W) chart Higher Low uptrend.
- tight STP loss
- if the DZ holds there is room f

See all ideas
Summarizing what the indicators are suggesting.
Oscillators
Neutral
SellBuy
Strong sellStrong buy
Strong sellSellNeutralBuyStrong buy
Oscillators
Neutral
SellBuy
Strong sellStrong buy
Strong sellSellNeutralBuyStrong buy
Summary
Neutral
SellBuy
Strong sellStrong buy
Strong sellSellNeutralBuyStrong buy
Summary
Neutral
SellBuy
Strong sellStrong buy
Strong sellSellNeutralBuyStrong buy
Summary
Neutral
SellBuy
Strong sellStrong buy
Strong sellSellNeutralBuyStrong buy
Moving Averages
Neutral
SellBuy
Strong sellStrong buy
Strong sellSellNeutralBuyStrong buy
Moving Averages
Neutral
SellBuy
Strong sellStrong buy
Strong sellSellNeutralBuyStrong buy
Displays a symbol's price movements over previous years to identify recurring trends.
NEE3668829
NextEra Energy Capital Holdings, Inc. 6.62672% 01-OCT-2066Yield to maturity
7.26%
Maturity date
Oct 1, 2066
NEE5320254
NextEra Energy Capital Holdings, Inc. 3.0% 15-JAN-2052Yield to maturity
7.24%
Maturity date
Jan 15, 2052
F
NEE5303835
Florida Power & Light Company 2.875% 04-DEC-2051Yield to maturity
6.95%
Maturity date
Dec 4, 2051
F
NEE4882918
Florida Power & Light Company 3.15% 01-OCT-2049Yield to maturity
6.75%
Maturity date
Oct 1, 2049
NEE5763049
NextEra Energy Capital Holdings, Inc. 6.7% 01-SEP-2054Yield to maturity
6.50%
Maturity date
Sep 1, 2054
NEE5826565
NextEra Energy Capital Holdings, Inc. 6.75% 15-JUN-2054Yield to maturity
6.42%
Maturity date
Jun 15, 2054
F
NEE4800709
Florida Power & Light Company 3.99% 01-MAR-2049Yield to maturity
6.35%
Maturity date
Mar 1, 2049
F
NEE4605956
Florida Power & Light Company 3.95% 01-MAR-2048Yield to maturity
6.28%
Maturity date
Mar 1, 2048
NEE5998544
NextEra Energy Capital Holdings, Inc. 6.5% 15-AUG-2055Yield to maturity
6.27%
Maturity date
Aug 15, 2055
See all NEXT34 bonds
Curated watchlists where NEXT34 is featured.
