PLTR Looks Ready for a ReboundPLTR Looks Ready for a Rebound — Gamma & SMC Say Watch This Level 👀
GEX Insight: Why Calls Might Be the Move
Looking at the options sentiment chart, we’re sitting on top of the strongest PUT support wall at 130, which lines up with the highest negative NET GEX. This area often marks a pivot or boun
600,000.000
0.000 BRL
2.49 B BRL
15.45 B BRL
About Palantir Technologies Inc.
Sector
Industry
CEO
Alexander Caedmon Karp
Website
Headquarters
Denver
Founded
2003
ISIN
BRP2LTBDR001
FIGI
BBG0123NSC58
Palantir Technologies, Inc. engages in the business of building and deploying software platforms that serve as the central operating systems for its customers. It operates through the Commercial and Government segments. The Commercial segment focuses on customers working in non-government industries. The Government segment is involved in providing services to customers that are the United States government and non-United States government agencies. The company was founded by Alexander Ceadmon Karp, Peter Andreas Thiel, Stephen Cohen, Joseph Lonsdale, and Nathan Dale Gettings in 2003 and is headquartered in Denver, CO.
Related stocks

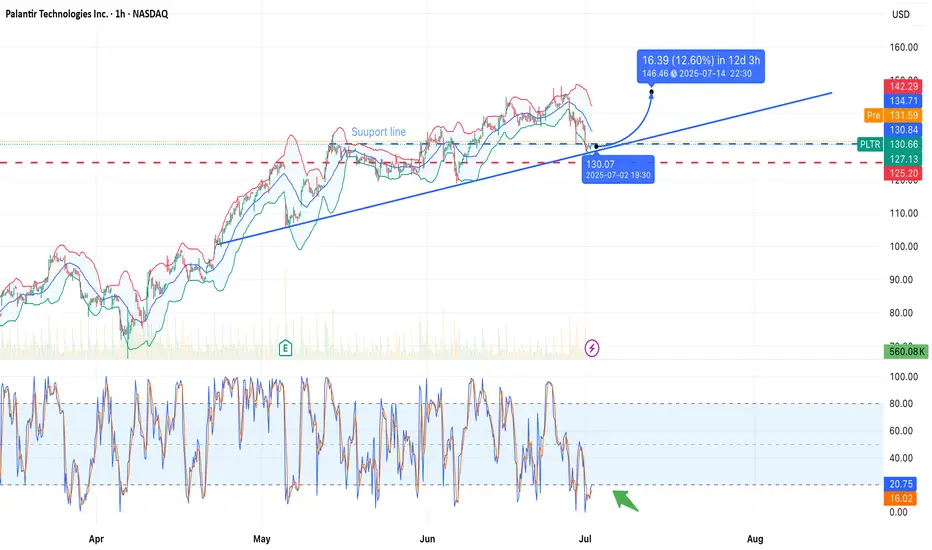
Palantir Technologies (PLTR) — Bounce in Progress?NASDAQ:PLTR is testing a long-term ascending trendline near the $128.79 level, which also aligns with a horizontal support zone. A potential rebound is forming with a projected move toward $145.94 — a +13.32% gain in 12 days.
Technical Highlights:
• Support zone: $128.79 (trendline touch + horizon
Good scenario for PalantirDo you want coffee NASDAQ:PLTR ?
Palantir has performed excellently throughout 2025 and looks set to continue doing so.

PLTR temporary top?Bearish case
Monthly RSI at 91
Weekly candles encountering resistance
Daily candles under the 20 day SMA
Bullish case
Monthly candle not a clear bearish candle, no monthly volume spike or no monthly RSI double top like SMCI and no bearish divergence detected yet.
Weekly no continuation down after

GEX-Based Options Sentiment GEX-Based Options Sentiment (as of July 7)
* Current Price: $138.69
* Highest Gamma Resistance (Call Wall): $139 → heavy OI + positive NetGEX → magnet + possible rejection
* Next Call Walls:
* $142 (GEX7, 51%)
* $144–146 stacked (GEX8–10) — breakout potential zone if $139 clears
* Put Wall +

$PLTR - support bounce at $130PLTR - Stock testing bottom of the channel on the daily time frame. Stock has held that support level trice. on high watch if we see a bounce here. Calls above $135 looking good . Stock is decent at the indicator level.

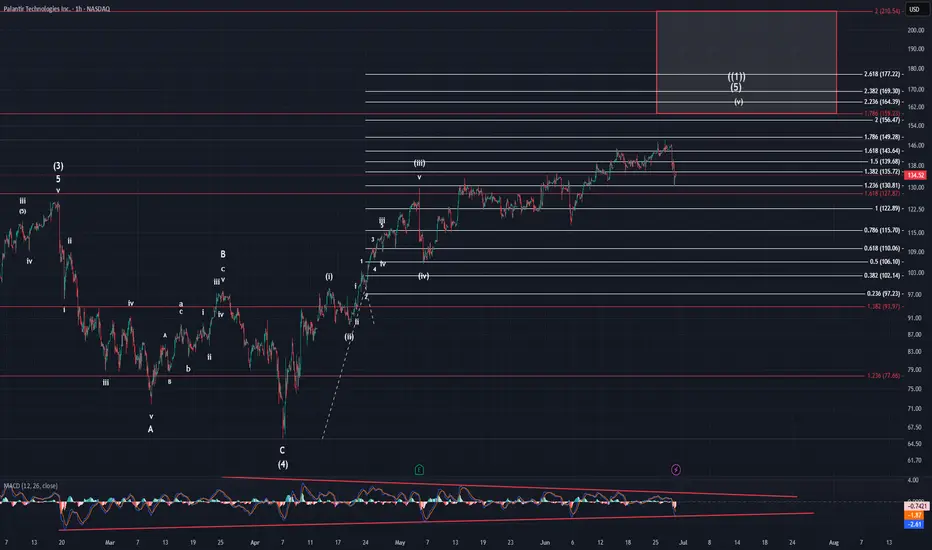
PLTR: Encoded Wave Replication IAs bullish wave gets mature on the way up, it draws distinctive tops in a way that warns of bullish exhaustion ahead because to some extent topologically highs indicate a registered rejection of moving further in a local scope (some period).
Scalable Recursive Patterns
If we pay attention to b

PLTR just started the first phase of the Wyckoff distributionBased on the weekly and daily charts provided for Palantir (PLTR), here is a Wyckoff analysis and a corresponding diagonal option spread strategy.
### **Wyckoff Phase Analysis of PLTR**
From the price and volume action on the charts, **PLTR appears to be in the initial stages of a Wyckoff distribu

PalantirOn Friday Palantir dropped pretty hard causing MACD to drop all the way to our bottom trend line. It created overlap with the pattern which brings a further rise to the target box into question. On thing I can say about this pattern with certainty, is it is very sloppy. It in no way appears as an im
"Steal the Market: PLTR Trading Strategy Revealed!"🌟 Hola, Money Snatchers & Market Rogues! 🌟
Ready to hit the vault? 💰💸✈️
Here’s the ultimate plan for lifting loot from PLTR (Palantir Technologies Inc.) using the infamous Thief Trading Style. This is no rookie job—we’ve got the techs and the fundamentals to nail the target. Our sights are locked o

See all ideas
Summarizing what the indicators are suggesting.
Oscillators
Neutral
SellBuy
Strong sellStrong buy
Strong sellSellNeutralBuyStrong buy
Oscillators
Neutral
SellBuy
Strong sellStrong buy
Strong sellSellNeutralBuyStrong buy
Summary
Neutral
SellBuy
Strong sellStrong buy
Strong sellSellNeutralBuyStrong buy
Summary
Neutral
SellBuy
Strong sellStrong buy
Strong sellSellNeutralBuyStrong buy
Summary
Neutral
SellBuy
Strong sellStrong buy
Strong sellSellNeutralBuyStrong buy
Moving Averages
Neutral
SellBuy
Strong sellStrong buy
Strong sellSellNeutralBuyStrong buy
Moving Averages
Neutral
SellBuy
Strong sellStrong buy
Strong sellSellNeutralBuyStrong buy
Displays a symbol's price movements over previous years to identify recurring trends.