Granules - Looking Beautifull structure - short to long investorGranules -----Daily counts indicate Excellent bullish wave structure.
Both appear to be optimistic and this stock invalidation number (S L) wave 2 low
target short / long term are already shared as per charts
correction wave leg seems completed C
Investing in declines is a smart move for short/
Next report date
—
Report period
—
EPS estimate
—
Revenue estimate
—
20.70 INR
5.02 B INR
44.82 B INR
145.15 M
About GRANULES INDIA LTD
Sector
Industry
CEO
Kandiraju Venkata S. Rao
Website
Headquarters
Hyderabad
Founded
1991
ISIN
INE101D01020
FIGI
BBG000LH28D4
Granules India Ltd. engages in the manufacturing and marketing of pharmaceutical products. It offers active pharmaceutical ingredients, pharmaceutical formulation intermediates, and finished dosages. The company was founded by Krishna Prasad Chigurupati on March 18, 1991 and is headquartered in Hyderabad, India.
Related stocks

Granules India Swing TradeGranules India Swing Trade
Entry- 703/-
Target - 983/- (40%)
Time Frame - 4 to 8 weeks

GRANULES 1HRThe combination of waves (W), (X), and (Y) suggests a Double Zigzag pattern, a common type of complex correction.
Current Situation and Potential Outlook:
* Wave (C) of (Y): The chart labels the final wave down as (C), which is consistent with an impulsive wave.
* MACD and Williams %R: The MACD is

Granules for the down-run in Sept monthPharma Sector looks in a pressure for a down move and we can see Granules following downtrend despite overall market towards upside. It would be good to go with hedge position of Shorting 300CE and Buying 330Ce for hedging.

Granuels : breaking out of consolidation ?Granuels : breaking out of consolidation ?
cmd 605
Sl 588
Target 628, 700 if it breaks 628 then good upside momentum
PE < industry PE
Strictly for educational purpose and not a buy sell recommmendation

How to use Trading View - Part 2 - Drawings and AlertsHow to use Trading View - Part 2 - Drawings and Alerts
Remember to assign different colours to different Time Frames as we saw in the last video. www.youtube.com
Also, you can be a bit innovative and use the Trend lines to create alerts not just for the price but time as well.

How to use Trading View - Part 1 - Trend Lines and Time FramesHow to use Trading View - Part 1 - Trend Lines and Time Frames
Use these different tools to make the most of your trading View account.
Make sure to differentiate your time frames so that your charts are decluttered and you have a very clean chart handy always.
Avoid drawing too many lines and dr

GRANULES : Dark days ahead?The daily chart for Granules India Ltd. signals a bearish outlook, particularly with the recent close at ₹532.40, a 5.29% drop. The price has approached a critical support level at ₹528. A breakdown below this level could trigger further downside toward ₹508, ₹486, and potentially ₹460. The 200-day

GRANULES- Analysis - breakout? Bullish Levels -Day closing above 486 then 510 to 517 or 523 above this more bullish, then 547 to 553 or 560 then 584 to 590 or 596 then 620 to 626 or 633 then 657 to 664 or 670
Bearish Level - Day closing Below 474 then 413 to 407 then 368 below this more bearish
**Disclaimer -
I am not a S

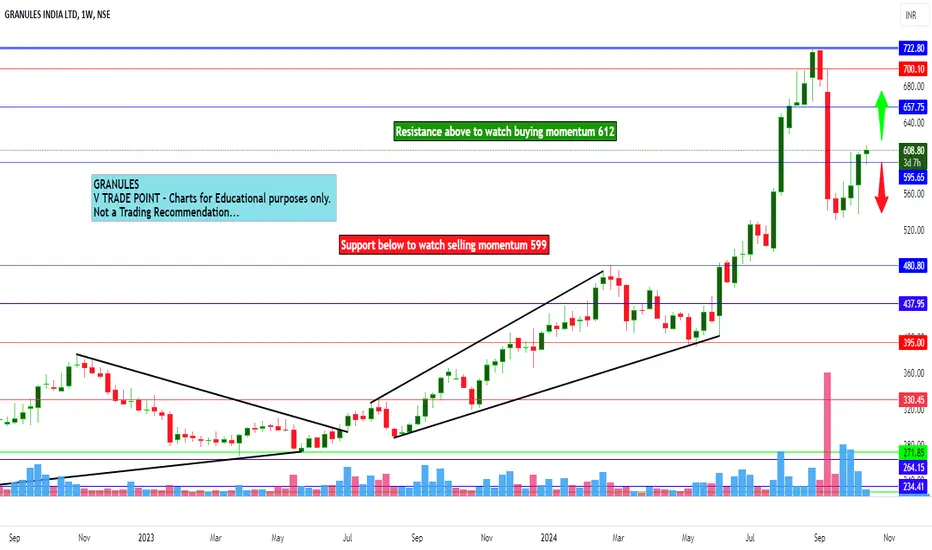
Granuels India Ltd view for Intraday 15th October #GRANULES Granuels India Ltd view for Intraday 15th October #GRANULES
Resistance 610. Watching above 612 for upside movement...
Support area 600. Below ignoring upside momentum for intraday
Support 600..Watching below 599 for downside movement...
Resistance area 610....
Above ignoring downside move for int
See all ideas
Summarizing what the indicators are suggesting.
Neutral
SellBuy
Strong sellStrong buy
Strong sellSellNeutralBuyStrong buy
Neutral
SellBuy
Strong sellStrong buy
Strong sellSellNeutralBuyStrong buy
Neutral
SellBuy
Strong sellStrong buy
Strong sellSellNeutralBuyStrong buy
An aggregate view of professional's ratings.
Neutral
SellBuy
Strong sellStrong buy
Strong sellSellNeutralBuyStrong buy
Neutral
SellBuy
Strong sellStrong buy
Strong sellSellNeutralBuyStrong buy
Neutral
SellBuy
Strong sellStrong buy
Strong sellSellNeutralBuyStrong buy
Displays a symbol's price movements over previous years to identify recurring trends.
Frequently Asked Questions
The current price of GRANULES is 493.30 INR — it has increased by 0.10% in the past 24 hours. Watch GRANULES INDIA LTD. stock price performance more closely on the chart.
Depending on the exchange, the stock ticker may vary. For instance, on BSE exchange GRANULES INDIA LTD. stocks are traded under the ticker GRANULES.
GRANULES stock has fallen by −0.70% compared to the previous week, the month change is a −7.60% fall, over the last year GRANULES INDIA LTD. has showed a −4.41% decrease.
We've gathered analysts' opinions on GRANULES INDIA LTD. future price: according to them, GRANULES price has a max estimate of 612.00 INR and a min estimate of 565.00 INR. Watch GRANULES chart and read a more detailed GRANULES INDIA LTD. stock forecast: see what analysts think of GRANULES INDIA LTD. and suggest that you do with its stocks.
GRANULES reached its all-time high on Sep 2, 2024 with the price of 724.55 INR, and its all-time low was 2.80 INR and was reached on Oct 27, 2008. View more price dynamics on GRANULES chart.
See other stocks reaching their highest and lowest prices.
See other stocks reaching their highest and lowest prices.
GRANULES stock is 1.29% volatile and has beta coefficient of 1.05. Track GRANULES INDIA LTD. stock price on the chart and check out the list of the most volatile stocks — is GRANULES INDIA LTD. there?
Today GRANULES INDIA LTD. has the market capitalization of 119.57 B, it has decreased by −5.67% over the last week.
Yes, you can track GRANULES INDIA LTD. financials in yearly and quarterly reports right on TradingView.
GRANULES INDIA LTD. is going to release the next earnings report on Aug 5, 2025. Keep track of upcoming events with our Earnings Calendar.
GRANULES earnings for the last quarter are 5.15 INR per share, whereas the estimation was 5.25 INR resulting in a −1.90% surprise. The estimated earnings for the next quarter are 5.00 INR per share. See more details about GRANULES INDIA LTD. earnings.
GRANULES INDIA LTD. revenue for the last quarter amounts to 11.97 B INR, despite the estimated figure of 12.15 B INR. In the next quarter, revenue is expected to reach 11.51 B INR.
GRANULES net income for the last quarter is 1.52 B INR, while the quarter before that showed 1.18 B INR of net income which accounts for 29.27% change. Track more GRANULES INDIA LTD. financial stats to get the full picture.
Yes, GRANULES dividends are paid annually. The last dividend per share was 1.50 INR. As of today, Dividend Yield (TTM)% is 0.30%. Tracking GRANULES INDIA LTD. dividends might help you take more informed decisions.
GRANULES INDIA LTD. dividend yield was 0.31% in 2024, and payout ratio reached 7.25%. The year before the numbers were 0.35% and 8.96% correspondingly. See high-dividend stocks and find more opportunities for your portfolio.
EBITDA measures a company's operating performance, its growth signifies an improvement in the efficiency of a company. GRANULES INDIA LTD. EBITDA is 9.45 B INR, and current EBITDA margin is 21.09%. See more stats in GRANULES INDIA LTD. financial statements.
Like other stocks, GRANULES shares are traded on stock exchanges, e.g. Nasdaq, Nyse, Euronext, and the easiest way to buy them is through an online stock broker. To do this, you need to open an account and follow a broker's procedures, then start trading. You can trade GRANULES INDIA LTD. stock right from TradingView charts — choose your broker and connect to your account.
Investing in stocks requires a comprehensive research: you should carefully study all the available data, e.g. company's financials, related news, and its technical analysis. So GRANULES INDIA LTD. technincal analysis shows the sell today, and its 1 week rating is neutral. Since market conditions are prone to changes, it's worth looking a bit further into the future — according to the 1 month rating GRANULES INDIA LTD. stock shows the buy signal. See more of GRANULES INDIA LTD. technicals for a more comprehensive analysis.
If you're still not sure, try looking for inspiration in our curated watchlists.
If you're still not sure, try looking for inspiration in our curated watchlists.