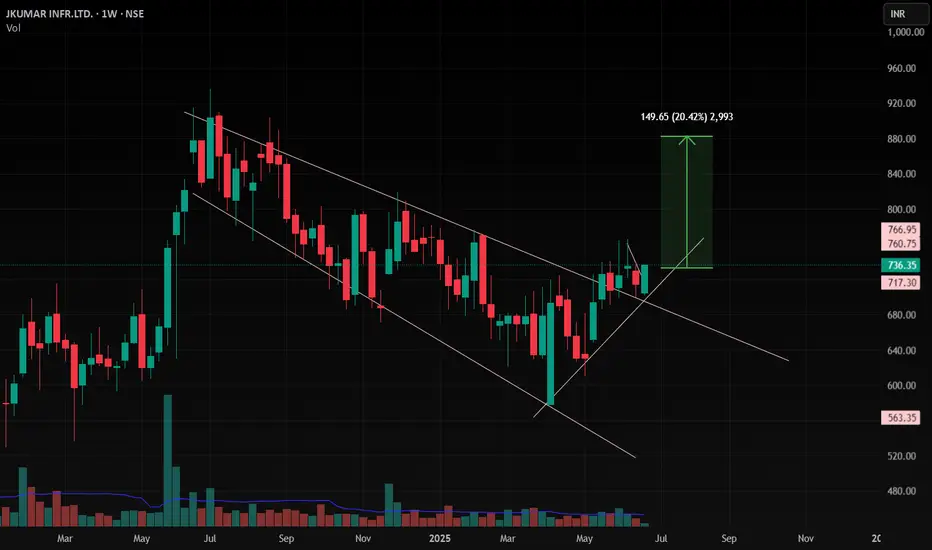
JKIL , Bullish A Very Good Pattern Breakout and come at Retest of Upper Trendline , and at Retest in 1D and Weekly supporting 20 EMA and Sustaining Above that , so we can Expect A Bullish Move in this Stock , As Nifty also giving good bullish move .
Follow for more Swing Ideas Like this
Next report date
—
Report period
—
EPS estimate
—
Revenue estimate
—
53.90 INR
3.91 B INR
56.93 B INR
38.40 M
About JKUMAR INFR.LTD.
Sector
Industry
Website
Headquarters
Mumbai
Founded
1980
ISIN
INE576I01022
FIGI
BBG000TFXKL0
J. Kumar Infraprojects Ltd. engages in the execution of contracts of infrastructure projects. The firm involves in the transportation engineering, irrigation projects, civil construction, piling work, and others. Its projects include flyovers, bridges, roads, skywalks, urban infra, dams & canals, underground metro, and railways. The company was founded by Jagdishkumar Madanlal Gupta in 1980 and is headquartered in Mumbai, India.
Related stocks
Jkumar ready for upside?Stock is trading above 20/50/100/200 EMA. Stock broke previous lower high and looks ready for upmove with short term target of 802.

JKIL potential breakout Strong prior buying force/uptrend.
Trading in a narrow/tight range.
Low risk entry point.
Volume contraction.

Ascending triangle on JKILJKIL formed an ascending triangle pattern on daily chart. There was huge volume on the day of breakout indicating bulls out there. Moreover, on the sell off day the volume was low indicating sellers are not willing to sell at lower price. Note the hammer formation yesterday indicating strong buying

JKIL - Bullish setupStock name - J Kumar Infraprojects Limited.
Weekly chart setup
Chart is self explanatory. Levels of breakout, possible up-moves (where stock may find resistances) and support (close below which, setup will be invalidated) are clearly defined.
Master Score - B
Disclaimer: This is for demonstration


ATH and Trend Breakoutthe stock made an all-time high after 8 years and a trend breakout with decent volume, the order books have crossed more than 4x of the market capital.
good to add to watchlist.

FRESH BREAKOUT ON JKIL A fresh breakout on the JAIKUMAR CONSTRUCTION LTD ON Monthly chart.Keep your eyes for tgts of 550,650,750 in short, medium and long term


JKIL looks bullish JKIL looks bullish on monthly and weekly time frames. It's been making cup and handle patterns. It almost broke the neckline with volume. If it breaks the current level & retraces the breaking line with significant volume, we may see 600 above levels in a couple of years.
Good for investment purpose

See all ideas
Summarizing what the indicators are suggesting.
Neutral
SellBuy
Strong sellStrong buy
Strong sellSellNeutralBuyStrong buy
Neutral
SellBuy
Strong sellStrong buy
Strong sellSellNeutralBuyStrong buy
Neutral
SellBuy
Strong sellStrong buy
Strong sellSellNeutralBuyStrong buy
An aggregate view of professional's ratings.
Neutral
SellBuy
Strong sellStrong buy
Strong sellSellNeutralBuyStrong buy
Neutral
SellBuy
Strong sellStrong buy
Strong sellSellNeutralBuyStrong buy
Neutral
SellBuy
Strong sellStrong buy
Strong sellSellNeutralBuyStrong buy
Displays a symbol's price movements over previous years to identify recurring trends.
Frequently Asked Questions
The current price of JKIL is 703.75 INR — it has increased by 1.53% in the past 24 hours. Watch J.KUMAR INFRAPROJECTS LTD. stock price performance more closely on the chart.
Depending on the exchange, the stock ticker may vary. For instance, on BSE exchange J.KUMAR INFRAPROJECTS LTD. stocks are traded under the ticker JKIL.
JKIL stock has fallen by −0.50% compared to the previous week, the month change is a −2.15% fall, over the last year J.KUMAR INFRAPROJECTS LTD. has showed a −12.37% decrease.
We've gathered analysts' opinions on J.KUMAR INFRAPROJECTS LTD. future price: according to them, JKIL price has a max estimate of 1,052.00 INR and a min estimate of 875.00 INR. Watch JKIL chart and read a more detailed J.KUMAR INFRAPROJECTS LTD. stock forecast: see what analysts think of J.KUMAR INFRAPROJECTS LTD. and suggest that you do with its stocks.
JKIL reached its all-time high on Jul 3, 2024 with the price of 935.50 INR, and its all-time low was 19.00 INR and was reached on Apr 1, 2009. View more price dynamics on JKIL chart.
See other stocks reaching their highest and lowest prices.
See other stocks reaching their highest and lowest prices.
JKIL stock is 3.44% volatile and has beta coefficient of 0.76. Track J.KUMAR INFRAPROJECTS LTD. stock price on the chart and check out the list of the most volatile stocks — is J.KUMAR INFRAPROJECTS LTD. there?
Today J.KUMAR INFRAPROJECTS LTD. has the market capitalization of 52.80 B, it has decreased by −0.45% over the last week.
Yes, you can track J.KUMAR INFRAPROJECTS LTD. financials in yearly and quarterly reports right on TradingView.
J.KUMAR INFRAPROJECTS LTD. is going to release the next earnings report on Nov 12, 2025. Keep track of upcoming events with our Earnings Calendar.
JKIL net income for the last quarter is 1.03 B INR, while the quarter before that showed 1.14 B INR of net income which accounts for −9.50% change. Track more J.KUMAR INFRAPROJECTS LTD. financial stats to get the full picture.
Yes, JKIL dividends are paid annually. The last dividend per share was 4.00 INR. As of today, Dividend Yield (TTM)% is 0.57%. Tracking J.KUMAR INFRAPROJECTS LTD. dividends might help you take more informed decisions.
J.KUMAR INFRAPROJECTS LTD. dividend yield was 0.63% in 2024, and payout ratio reached 7.74%. The year before the numbers were 0.63% and 9.15% correspondingly. See high-dividend stocks and find more opportunities for your portfolio.
EBITDA measures a company's operating performance, its growth signifies an improvement in the efficiency of a company. J.KUMAR INFRAPROJECTS LTD. EBITDA is 8.59 B INR, and current EBITDA margin is 14.51%. See more stats in J.KUMAR INFRAPROJECTS LTD. financial statements.
Like other stocks, JKIL shares are traded on stock exchanges, e.g. Nasdaq, Nyse, Euronext, and the easiest way to buy them is through an online stock broker. To do this, you need to open an account and follow a broker's procedures, then start trading. You can trade J.KUMAR INFRAPROJECTS LTD. stock right from TradingView charts — choose your broker and connect to your account.
Investing in stocks requires a comprehensive research: you should carefully study all the available data, e.g. company's financials, related news, and its technical analysis. So J.KUMAR INFRAPROJECTS LTD. technincal analysis shows the sell today, and its 1 week rating is buy. Since market conditions are prone to changes, it's worth looking a bit further into the future — according to the 1 month rating J.KUMAR INFRAPROJECTS LTD. stock shows the buy signal. See more of J.KUMAR INFRAPROJECTS LTD. technicals for a more comprehensive analysis.
If you're still not sure, try looking for inspiration in our curated watchlists.
If you're still not sure, try looking for inspiration in our curated watchlists.