NBCC Short Term AnalysisThanks for stopping by.
The notes cover key details. I’ve backed every thesis with my own analysis — no fluff, just what matters to investors.
If you find the idea useful or have suggestions, feel free to leave a comment. Always open to fresh insights.
Kind regards,
Psycho Trader
Next report date
—
Report period
—
EPS estimate
—
Revenue estimate
—
2.00 INR
5.41 B INR
120.39 B INR
1.03 B
About NBCC (INDIA) LTD
Sector
CEO
K. P. Mahadevaswamy
Website
Headquarters
New Delhi
Founded
1960
ISIN
INE095N01031
FIGI
BBG001R3V042
NBCC (India) Ltd. engages in the real estate development, project management, and consultancy services. It operates through the following segments: Project Management Consultancy (PMC); Real Estate; and Engineering Procurement and Construction (EPC). The PMC segment provides consultancy services to residential, office, commercial and educational institutions, border fencing and infrastructure projects like roads, water supply system, and water storage solutions. The Real Estate segment focuses on residential and commercial projects. The EPC segment aims at high value projects. The company was founded on November 15, 1960 and is headquartered in New Delhi, India.
Related stocks

NBCC India Ltd.*NBCC India Ltd.*
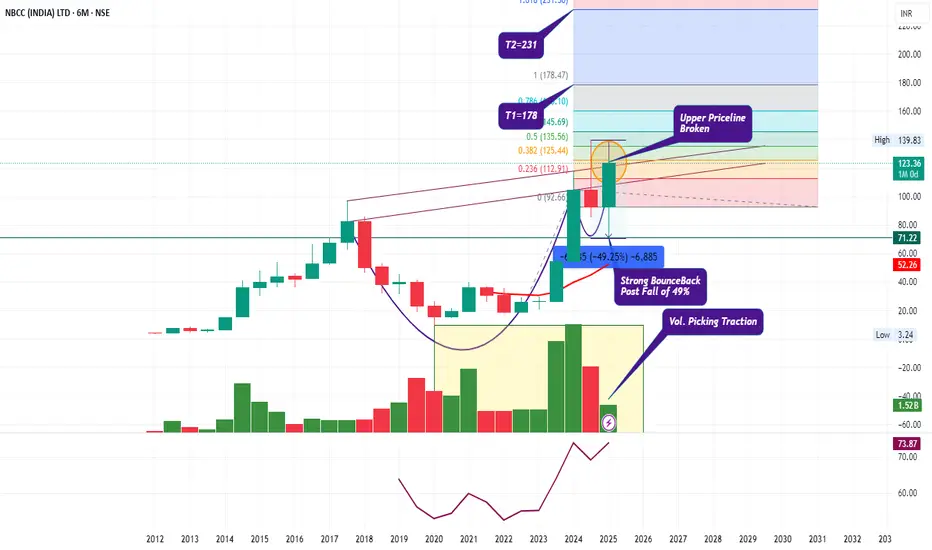
Rising C&H; formation on Yearly basis.
Strong Bounce back (Post fall of 49%) from Support Zone.
Volume Traction picking up.
RSI: 1H W>M. All in Bullish zone.
EMAs: Widening Gaps amongst 20/50/100/200 levels on Weekly Basis.
*Trail SL with Upside*
*Book Profit as per Risk Appe
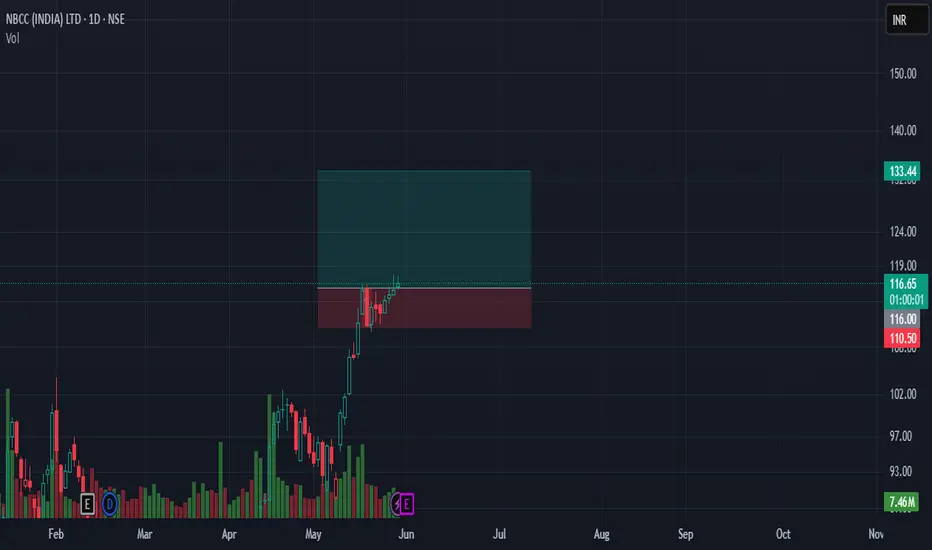
nbccnbcc is all good in charts and outperfomin in rs keep an eye on it close above 116 will make it go higher
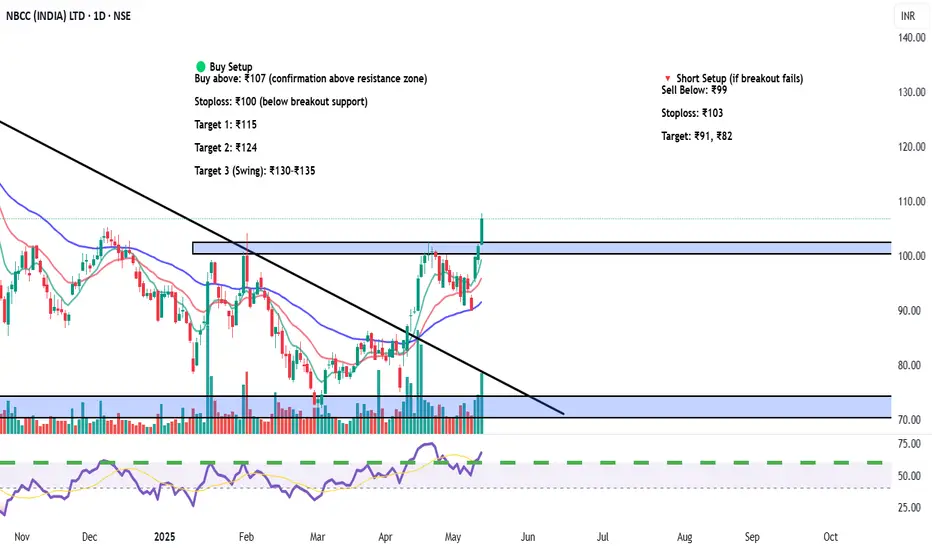
Trendline Breakout and Cup & handle breakout Confirmation - NBCCTechnical Analysis:
Current Price: ₹111.08 (Note: As of the market close on Friday, May 16, 2025, NBCC closed around ₹110.85 on the NSE).
Target: Your target of ₹140 suggests a significant potential upside.
Trendline Breakout: Breaking above a significant downtrend line indicates a potential

NBCC- FOR SWING TRADEFrom 9th May after taking support from 50 EMA price is bullish and today it has given a breakout of its very important Resistance level which was 105.
Next target can be 112.50 to 119.

NBCC (India) Ltd (NSE: NBCC) – Breakout Trade Setup🧾 Equity Research Summary – NBCC (India) Ltd.
Sector: Construction & Infrastructure – Government PSU
Technical Setup: Trendline breakout + Base retest + Volume surge
Support Zone: ₹68–₹75
Breakout Zone: ₹100–₹103
Upside Potential: Strong move expected due to order book + infra push
Catalyst:
Gover
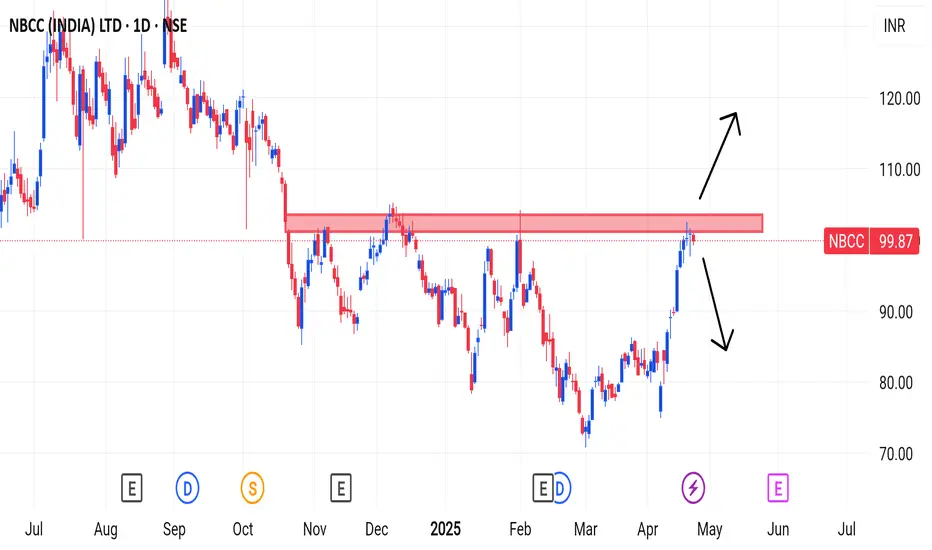
NBCCAn uptrend can be expected above the resistance level.
If it comes back below the resistance level the selling is expected to continue
If you find this helpful and want more FREE forecasts in TradingView, Hit the 'BOOST' button
Drop some feedback in the comments below! (e.g., What did you find mo
NBCC: Poised for a Potential Comeback?
🛡️ Price: Around **85.85 INR** (currently) – Consider scaling in if it reaches the **"Retracement Zone for Wave B" of 82.26 INR.**
🎯 Target: **107-110 INR** (Target at Wave C)
🛑 Stop-Loss: **Daily close below 79.4 INR**
🤔 Why this trade?
✅ Approaching retracement zone – potential s

Analysis of NBCC (India) Limited ChartOverview:
The daily price chart of NBCC (India) Limited indicates a recovery phase after a significant correction from its 2024 highs. Key support and resistance levels are identified, along with a potential pattern that suggests consolidation followed by a breakout.
Key Observations:
1.Trend A

NBCC recover from 0.786 level with double bottomHello Fellow Traders,
NBCC price was at the edge of level 1 and the price broke the level 0.786 of Fibonacci trend retracement and forms the double bottom pattern as double confirmation for entry long.
Consider 0.786 as the stop loss if the price fails to go as predicted and enjoy the profit if t

See all ideas
Summarizing what the indicators are suggesting.
Neutral
SellBuy
Strong sellStrong buy
Strong sellSellNeutralBuyStrong buy
Neutral
SellBuy
Strong sellStrong buy
Strong sellSellNeutralBuyStrong buy
Neutral
SellBuy
Strong sellStrong buy
Strong sellSellNeutralBuyStrong buy
An aggregate view of professional's ratings.
Neutral
SellBuy
Strong sellStrong buy
Strong sellSellNeutralBuyStrong buy
Neutral
SellBuy
Strong sellStrong buy
Strong sellSellNeutralBuyStrong buy
Neutral
SellBuy
Strong sellStrong buy
Strong sellSellNeutralBuyStrong buy
Displays a symbol's price movements over previous years to identify recurring trends.
Frequently Asked Questions
The current price of NBCC is 124.60 INR — it has decreased by −1.20% in the past 24 hours. Watch NBCC (INDIA) LIMITED stock price performance more closely on the chart.
Depending on the exchange, the stock ticker may vary. For instance, on BSE exchange NBCC (INDIA) LIMITED stocks are traded under the ticker NBCC.
NBCC stock has risen by 4.13% compared to the previous week, the month change is a 8.01% rise, over the last year NBCC (INDIA) LIMITED has showed a 18.18% increase.
We've gathered analysts' opinions on NBCC (INDIA) LIMITED future price: according to them, NBCC price has a max estimate of 143.00 INR and a min estimate of 143.00 INR. Watch NBCC chart and read a more detailed NBCC (INDIA) LIMITED stock forecast: see what analysts think of NBCC (INDIA) LIMITED and suggest that you do with its stocks.
NBCC reached its all-time high on Aug 28, 2024 with the price of 139.85 INR, and its all-time low was 3.50 INR and was reached on May 18, 2012. View more price dynamics on NBCC chart.
See other stocks reaching their highest and lowest prices.
See other stocks reaching their highest and lowest prices.
NBCC stock is 1.50% volatile and has beta coefficient of 2.01. Track NBCC (INDIA) LIMITED stock price on the chart and check out the list of the most volatile stocks — is NBCC (INDIA) LIMITED there?
Today NBCC (INDIA) LIMITED has the market capitalization of 337.37 B, it has decreased by −5.43% over the last week.
Yes, you can track NBCC (INDIA) LIMITED financials in yearly and quarterly reports right on TradingView.
NBCC (INDIA) LIMITED is going to release the next earnings report on Aug 7, 2025. Keep track of upcoming events with our Earnings Calendar.
NBCC net income for the last quarter is 1.76 B INR, while the quarter before that showed 1.38 B INR of net income which accounts for 27.04% change. Track more NBCC (INDIA) LIMITED financial stats to get the full picture.
EBITDA measures a company's operating performance, its growth signifies an improvement in the efficiency of a company. NBCC (INDIA) LIMITED EBITDA is 5.41 B INR, and current EBITDA margin is 3.11%. See more stats in NBCC (INDIA) LIMITED financial statements.
Like other stocks, NBCC shares are traded on stock exchanges, e.g. Nasdaq, Nyse, Euronext, and the easiest way to buy them is through an online stock broker. To do this, you need to open an account and follow a broker's procedures, then start trading. You can trade NBCC (INDIA) LIMITED stock right from TradingView charts — choose your broker and connect to your account.
Investing in stocks requires a comprehensive research: you should carefully study all the available data, e.g. company's financials, related news, and its technical analysis. So NBCC (INDIA) LIMITED technincal analysis shows the buy rating today, and its 1 week rating is buy. Since market conditions are prone to changes, it's worth looking a bit further into the future — according to the 1 month rating NBCC (INDIA) LIMITED stock shows the strong buy signal. See more of NBCC (INDIA) LIMITED technicals for a more comprehensive analysis.
If you're still not sure, try looking for inspiration in our curated watchlists.
If you're still not sure, try looking for inspiration in our curated watchlists.