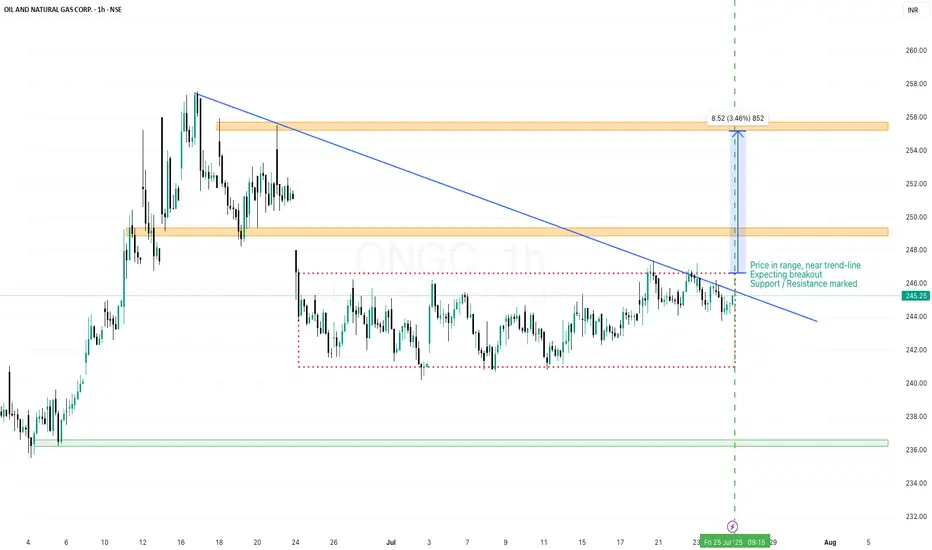
ONGC - Time to breakout from the Darvas boxONGC has been consolidating within Darvas box in recent days and nearing trend-line. We can expect breakout when trend line breaks. Nearest Support & Resistance marked for Target levels
Next report date
—
Report period
—
EPS estimate
—
Revenue estimate
—
28.75 INR
362.26 B INR
6.63 T INR
3.87 B
About OIL AND NATURAL GAS CORP.
Sector
Industry
CEO
Arun Kumar Singh
Website
Headquarters
New Delhi
Founded
1956
ISIN
INE213A01029
FIGI
BBG000BF0BK6
Oil and Natural Gas Corporation Limited is a global energy holding company. The Company is engaged in the exploration, development and production of crude oil and natural gas. The Company's segments include Exploration & Production (E&P), and Refining. The Company's geographical segments include operations in two categories: In India, which includes Onshore and Offshore, and Outside India. The Company's business spread include various areas, such as oil field services, transportation of the oil and natural gas, and production of value-added products, such as Liquefied Petroleum Gas (LPG), Naphtha, Refining, Petrochemicals, Power, unconventional and alternate sources of energy. The Company's subsidiaries include ONGC Videsh Limited (OVL), Mangalore Refinery and Petrochemicals Limited (MRPL) and ONGC Mangalore Petrochemicals Limited. The Company's oil and gas reserves are located internationally at Russia, Colombia, Vietnam, Brazil and Venezuela.
Related stocks
ONGC BuyONGC seems to take support at its channel bottom. Buy @CMP (243.5) with SL of 240 and target of 255.

ONGC Swing Outlook Swing Trade Outlook – ONGC (Updated View)
📌 Key Levels and Observations
🔲 Major Resistance Zone:
The green zone (~₹252–₹258) has been a critical resistance area since October 2023.
Price has tested this zone multiple times but failed to close above it decisively—forming a long-term horizontal resis

ONGC available at fair value .. Good to BUY ONGC 239 is available at a FAIR VALUE with support 224. Fundamentally good stock and technically it could reach 290 which could give 20% return.

ONGCONGC
MTF MTF-Zone TREND MTF Analysis Logic Proximal
HTF Yearly UP ONGCYearly Demand RR 111
HTF Half-Yearly UP ONGC6 Month Demand BUFL 106
HTF Qtrly UP ONGCQtrly Demand BUFL BUFL 212
HTF Average UP 143
MTF Monthly UP ONGCMonthly Demand BUFL 212
MTF Weekly UP ONGCWeekly Demand DM

ONGC chart shows upside movement as price at demand zoneONGC chart shows upside movement as price at demand zone

ONGC is ready for 50% returnsONGC has fallen 30% from highs
And going down in falling down
Stock has given breakout of the channel and now currently around breakout area
Stock has huge potential to go up till 400
In a shorter term we can see 320 in days to come
Thank You !!

ONGC longOil & gas sector is outperforming and within that sector ONGC is picking up momentum.
historically in the month of Jan - Oil & energy sector performs well.
Buy above 275
Stop loss 250
target : 290/ 320

ONGC Looks good for a target of 274One can look at ONGC for an immediate target of 274 with SL at 259.
Post 274, it may touch 290

ONGC - Short the RallyAt this stage I am feeling ONGC has just made a Expanded flat on its daily time frame - Every bounce in Intraday is SHORT !!!!!!!!!!!!!!!!!!!!!!!!!!!
Beware of STOP LOSS
Alert: I follow stop loss on closing basis & my stop loss of 273-274 is on Daily Time Frame

See all ideas
Summarizing what the indicators are suggesting.
Neutral
SellBuy
Strong sellStrong buy
Strong sellSellNeutralBuyStrong buy
Neutral
SellBuy
Strong sellStrong buy
Strong sellSellNeutralBuyStrong buy
Neutral
SellBuy
Strong sellStrong buy
Strong sellSellNeutralBuyStrong buy
An aggregate view of professional's ratings.
Neutral
SellBuy
Strong sellStrong buy
Strong sellSellNeutralBuyStrong buy
Neutral
SellBuy
Strong sellStrong buy
Strong sellSellNeutralBuyStrong buy
Neutral
SellBuy
Strong sellStrong buy
Strong sellSellNeutralBuyStrong buy
Displays a symbol's price movements over previous years to identify recurring trends.
RPIN4933146
Oil and Natural Gas Corporation Limited 3.375% 05-DEC-2029Yield to maturity
4.78%
Maturity date
Dec 5, 2029
O
RPIN4398733
ONGC Videsh Vankorneft Pte. Ltd. 3.75% 27-JUL-2026Yield to maturity
4.76%
Maturity date
Jul 27, 2026
See all ONGC bonds
Curated watchlists where ONGC is featured.

Indian stocks: Racing ahead
46 No. of Symbols

Upstream oil: Liquid gold extractors
34 No. of Symbols
See all sparks
Frequently Asked Questions
The current price of ONGC is 240.10 INR — it has decreased by −0.04% in the past 24 hours. Watch OIL AND NATURAL GAS CORPORATIO stock price performance more closely on the chart.
Depending on the exchange, the stock ticker may vary. For instance, on BSE exchange OIL AND NATURAL GAS CORPORATIO stocks are traded under the ticker ONGC.
ONGC stock has fallen by −2.38% compared to the previous week, the month change is a −1.84% fall, over the last year OIL AND NATURAL GAS CORPORATIO has showed a −28.75% decrease.
We've gathered analysts' opinions on OIL AND NATURAL GAS CORPORATIO future price: according to them, ONGC price has a max estimate of 360.00 INR and a min estimate of 205.00 INR. Watch ONGC chart and read a more detailed OIL AND NATURAL GAS CORPORATIO stock forecast: see what analysts think of OIL AND NATURAL GAS CORPORATIO and suggest that you do with its stocks.
ONGC reached its all-time high on Aug 1, 2024 with the price of 344.60 INR, and its all-time low was 51.80 INR and was reached on Mar 13, 2020. View more price dynamics on ONGC chart.
See other stocks reaching their highest and lowest prices.
See other stocks reaching their highest and lowest prices.
ONGC stock is 1.58% volatile and has beta coefficient of 1.08. Track OIL AND NATURAL GAS CORPORATIO stock price on the chart and check out the list of the most volatile stocks — is OIL AND NATURAL GAS CORPORATIO there?
Today OIL AND NATURAL GAS CORPORATIO has the market capitalization of 3.02 T, it has increased by 0.85% over the last week.
Yes, you can track OIL AND NATURAL GAS CORPORATIO financials in yearly and quarterly reports right on TradingView.
OIL AND NATURAL GAS CORPORATIO is going to release the next earnings report on Aug 8, 2025. Keep track of upcoming events with our Earnings Calendar.
ONGC earnings for the last quarter are 5.10 INR per share, whereas the estimation was 7.30 INR resulting in a −30.13% surprise. The estimated earnings for the next quarter are 6.73 INR per share. See more details about OIL AND NATURAL GAS CORPORATIO earnings.
OIL AND NATURAL GAS CORPORATIO revenue for the last quarter amounts to 1.71 T INR, despite the estimated figure of 521.29 B INR. In the next quarter, revenue is expected to reach 311.24 B INR.
ONGC net income for the last quarter is 73.23 B INR, while the quarter before that showed 86.22 B INR of net income which accounts for −15.07% change. Track more OIL AND NATURAL GAS CORPORATIO financial stats to get the full picture.
EBITDA measures a company's operating performance, its growth signifies an improvement in the efficiency of a company. OIL AND NATURAL GAS CORPORATIO EBITDA is 990.25 B INR, and current EBITDA margin is 14.90%. See more stats in OIL AND NATURAL GAS CORPORATIO financial statements.
Like other stocks, ONGC shares are traded on stock exchanges, e.g. Nasdaq, Nyse, Euronext, and the easiest way to buy them is through an online stock broker. To do this, you need to open an account and follow a broker's procedures, then start trading. You can trade OIL AND NATURAL GAS CORPORATIO stock right from TradingView charts — choose your broker and connect to your account.
Investing in stocks requires a comprehensive research: you should carefully study all the available data, e.g. company's financials, related news, and its technical analysis. So OIL AND NATURAL GAS CORPORATIO technincal analysis shows the strong sell today, and its 1 week rating is sell. Since market conditions are prone to changes, it's worth looking a bit further into the future — according to the 1 month rating OIL AND NATURAL GAS CORPORATIO stock shows the buy signal. See more of OIL AND NATURAL GAS CORPORATIO technicals for a more comprehensive analysis.
If you're still not sure, try looking for inspiration in our curated watchlists.
If you're still not sure, try looking for inspiration in our curated watchlists.