PAGE INDUSTRIES - ready to fly ?? looking strong on hourlyPAGE INDUSTRIES----HOURLY counts indicate Excellent bullish wave structure.
Both appear to be optimistic and this stock invalidation number (S L) wave 2 low
target short / long term are already shared as per charts
correction wave leg seems completed (C)
Investing in declines is a smart move fo
Next report date
—
Report period
—
EPS estimate
—
Revenue estimate
—
653.70 INR
7.29 B INR
49.35 B INR
5.75 M
About PAGE INDUSTRIES LTD
Sector
Industry
CEO
Karthik Yathindra
Website
Headquarters
Bengaluru
Founded
1994
ISIN
INE761H01022
FIGI
BBG000PVQ3C5
Page Industries Ltd. engages in the manufacturing, distribution, and marketing of innerwear, leisurewear, sportswear, and swimwear for men, women, and kids. The company was founded by Sunder Ashok Genomal and Ramesh Genomal on November 15, 1994 and is headquartered in Bengaluru, India.
Related stocks

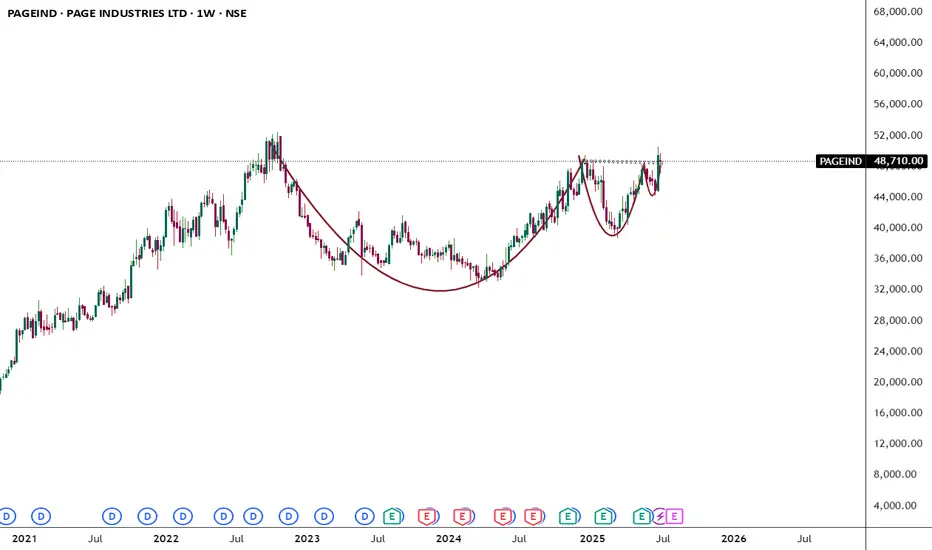
PAGE - LONGNSE:PAGEIND Weekly parabolic formation along with buyers candle and macd turning upside.
May continue trend upward.

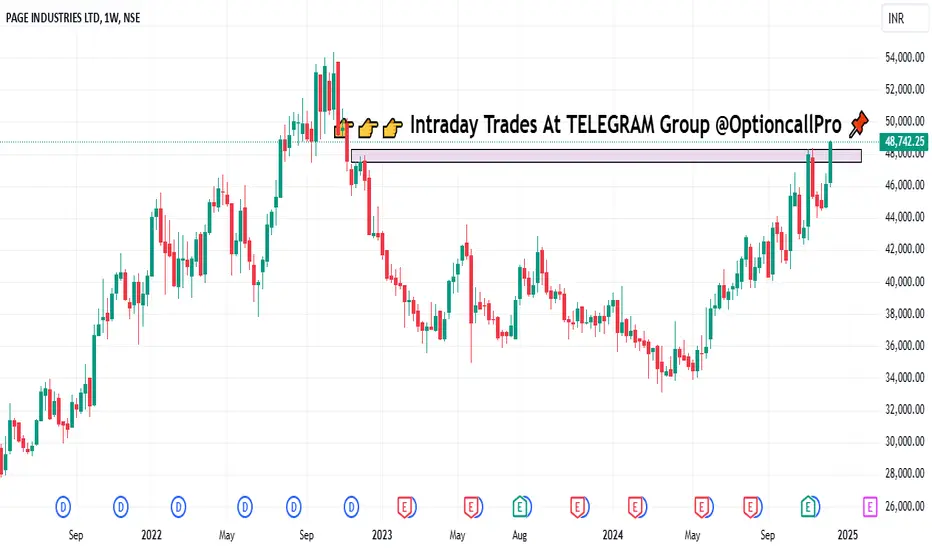
Repeating Pattern in PAGE INDUSTRIES...NSE:PAGEIND trade at 43200 level. Stocks shows its ready for going ALL TIME HIGH LEVEL, on the chart make a Repeating structural chart pattern. So you can watch for an Upside Move.

Amazing breakout on Weekly Timeframe - PAGEINDCheckout an amazing breakout happened in the stock in Weekly timeframe, macroscopically seen in Daily timeframe. Having a great favor that the stock might be bullish expecting a staggering returns of minimum 25% TGT. IMPORTANT BREAKOUT LEVELS ARE ALWAYS RESPECTED!
NOTE for learners: Place the break

Page industries ltd Swing TradeHello,
Trend-Based Analysis. Buy the Dips, Sell The Rallies, Also Following the Trend. Let's see where the Price Action takes us, Riding the wave. Potential trade setups based on trend momentum.
Technical analysis based on trend identification and momentum, Looking for high-probability setups with
PAGEIND NSE RBC BO 1Y 2W Positional, Trend Line BO SwingSTOCK Analysis
PAGEIND RBC BO
TRADE PLAN
ENTRY -42400
SL -42100
TARGET --01-42900 Swing , TGT01--45500 TGT2-49700
Hold For a Year or TGT 2
Chart Pattern :
STOCK has recently broken out of Bearish Subtrend after hitting a LTH, Now its close to Forming a 1Y-2W RBC on the DTF/WTF. Targets for Sw

CLOSED BELOW RESISTANCEYou shold be carefull PAGE INDUSTRIES is nearby resistance can be retrace don't trade carelessely to loose your hard earned money.

PAGEINDNSE:PAGEIND
One Can Enter Now !
Or Wait for Retest of the Trendline (BO) !
Or wait For better R:R ratio !
Note :
1.One Can Go long with a Strict SL below the Trendline or Swing Low.
2. R:R ratio should be 1 :2 minimum
3. Plan as per your RISK appetite and Money Management.
Disclaimer : You ar

PAGE INDUSTRIES LTD S/RSupport and Resistance Levels:
Support Levels: These are price points (green line/shade) where a downward trend may be halted due to a concentration of buying interest. Imagine them as a safety net where buyers step in, preventing further decline.
Resistance Levels: Conversely, resistance levels (re

See all ideas
Summarizing what the indicators are suggesting.
Neutral
SellBuy
Strong sellStrong buy
Strong sellSellNeutralBuyStrong buy
Neutral
SellBuy
Strong sellStrong buy
Strong sellSellNeutralBuyStrong buy
Neutral
SellBuy
Strong sellStrong buy
Strong sellSellNeutralBuyStrong buy
An aggregate view of professional's ratings.
Neutral
SellBuy
Strong sellStrong buy
Strong sellSellNeutralBuyStrong buy
Neutral
SellBuy
Strong sellStrong buy
Strong sellSellNeutralBuyStrong buy
Neutral
SellBuy
Strong sellStrong buy
Strong sellSellNeutralBuyStrong buy
Displays a symbol's price movements over previous years to identify recurring trends.
Frequently Asked Questions
The current price of PAGEIND is 46,374.35 INR — it has decreased by −1.42% in the past 24 hours. Watch PAGE INDUSTRIES LTD. stock price performance more closely on the chart.
Depending on the exchange, the stock ticker may vary. For instance, on BSE exchange PAGE INDUSTRIES LTD. stocks are traded under the ticker PAGEIND.
PAGEIND stock has fallen by −2.12% compared to the previous week, the month change is a 0.06% rise, over the last year PAGE INDUSTRIES LTD. has showed a 13.94% increase.
We've gathered analysts' opinions on PAGE INDUSTRIES LTD. future price: according to them, PAGEIND price has a max estimate of 57,500.00 INR and a min estimate of 35,561.00 INR. Watch PAGEIND chart and read a more detailed PAGE INDUSTRIES LTD. stock forecast: see what analysts think of PAGE INDUSTRIES LTD. and suggest that you do with its stocks.
PAGEIND reached its all-time high on Oct 21, 2022 with the price of 54,262.30 INR, and its all-time low was 241.25 INR and was reached on Mar 23, 2007. View more price dynamics on PAGEIND chart.
See other stocks reaching their highest and lowest prices.
See other stocks reaching their highest and lowest prices.
PAGEIND stock is 2.37% volatile and has beta coefficient of 0.77. Track PAGE INDUSTRIES LTD. stock price on the chart and check out the list of the most volatile stocks — is PAGE INDUSTRIES LTD. there?
Today PAGE INDUSTRIES LTD. has the market capitalization of 517.25 B, it has decreased by −2.31% over the last week.
Yes, you can track PAGE INDUSTRIES LTD. financials in yearly and quarterly reports right on TradingView.
PAGE INDUSTRIES LTD. is going to release the next earnings report on Aug 7, 2025. Keep track of upcoming events with our Earnings Calendar.
PAGEIND earnings for the last quarter are 147.00 INR per share, whereas the estimation was 121.61 INR resulting in a 20.87% surprise. The estimated earnings for the next quarter are 174.84 INR per share. See more details about PAGE INDUSTRIES LTD. earnings.
PAGE INDUSTRIES LTD. revenue for the last quarter amounts to 10.98 B INR, despite the estimated figure of 10.79 B INR. In the next quarter, revenue is expected to reach 13.43 B INR.
PAGEIND net income for the last quarter is 1.64 B INR, while the quarter before that showed 2.05 B INR of net income which accounts for −19.86% change. Track more PAGE INDUSTRIES LTD. financial stats to get the full picture.
PAGE INDUSTRIES LTD. dividend yield was 2.10% in 2024, and payout ratio reached 137.68%. The year before the numbers were 1.07% and 72.50% correspondingly. See high-dividend stocks and find more opportunities for your portfolio.
As of Jul 26, 2025, the company has 23.46 K employees. See our rating of the largest employees — is PAGE INDUSTRIES LTD. on this list?
EBITDA measures a company's operating performance, its growth signifies an improvement in the efficiency of a company. PAGE INDUSTRIES LTD. EBITDA is 10.63 B INR, and current EBITDA margin is 21.94%. See more stats in PAGE INDUSTRIES LTD. financial statements.
Like other stocks, PAGEIND shares are traded on stock exchanges, e.g. Nasdaq, Nyse, Euronext, and the easiest way to buy them is through an online stock broker. To do this, you need to open an account and follow a broker's procedures, then start trading. You can trade PAGE INDUSTRIES LTD. stock right from TradingView charts — choose your broker and connect to your account.
Investing in stocks requires a comprehensive research: you should carefully study all the available data, e.g. company's financials, related news, and its technical analysis. So PAGE INDUSTRIES LTD. technincal analysis shows the sell today, and its 1 week rating is buy. Since market conditions are prone to changes, it's worth looking a bit further into the future — according to the 1 month rating PAGE INDUSTRIES LTD. stock shows the buy signal. See more of PAGE INDUSTRIES LTD. technicals for a more comprehensive analysis.
If you're still not sure, try looking for inspiration in our curated watchlists.
If you're still not sure, try looking for inspiration in our curated watchlists.