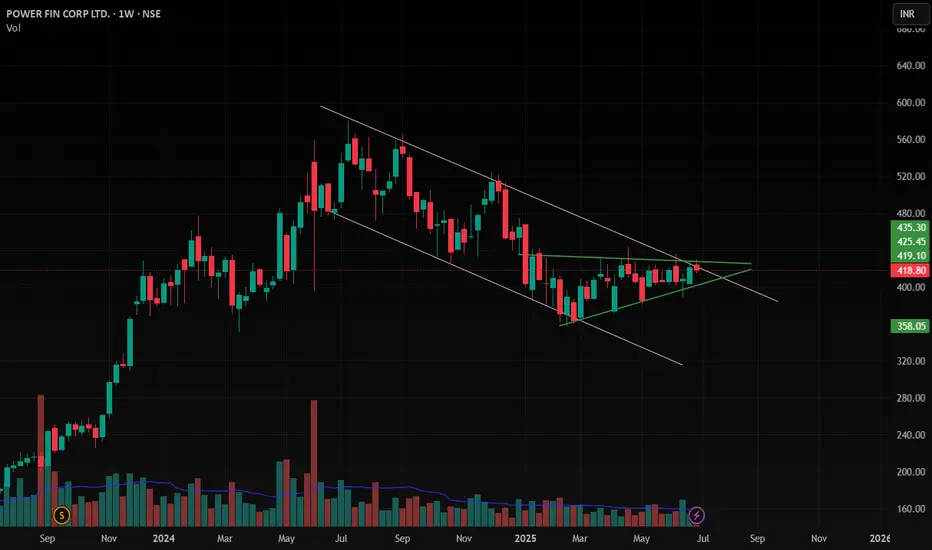
PFC , 1W , Bullishit has formed a Very Good Pattern and Ready to giving a Breakout and Wait patiently for Weekly close , after that enter into Trade , follow proper position sizing and follow risk management
follow for more Swing Ideas like this
Next report date
—
Report period
—
EPS estimate
—
Revenue estimate
—
69.65 INR
229.91 B INR
1.07 T INR
1.45 B
About POWER FIN CORP LTD.
Sector
Industry
CEO
Parminder Chopra
Website
Headquarters
New Delhi
Founded
1986
ISIN
INE134E01011
FIGI
BBG000BXJHF0
Power Finance Corp. Ltd. is a non-banking financial company, which engages in the provision of financial assistance to the power sector. It offers fund-based and non-fund-based policies, and non-fund-based consultancy services. The company was founded on July 16, 1986 and is headquartered in New Delhi, India.
Related stocks
Review and plan for 11th July 2025 Nifty future and banknifty future analysis and intraday plan.
Analysis of "what i traded today".
This video is for information/education purpose only. you are 100% responsible for any actions you take by reading/viewing this post.
please consult your financial advisor before taking any action.


Power Finance Corporation Ltd view for Intraday 14th May #PFC Power Finance Corporation Ltd view for Intraday 14th May #PFC
Resistance 415 Watching above 416 for upside movement...
Support area 405 Below 410 ignoring upside momentum for intraday
Watching below 404 for downside movement...
Above 410 ignoring downside move for intraday
Charts for Educational


Power Finance Corporation Ltd view for Intraday 24th April #PFC Power Finance Corporation Ltd view for Intraday 24th April #PFC
Resistance 435 Watching above 436 for upside movement...
Support area 430 Below 430 ignoring upside momentum for intraday
Watching below 429 for downside movement...
Above 435 ignoring downside move for intraday
Charts for Education

PFC correctionPFC shows signs of the correction ending where it can start a wave 5 impulse or a wave X correction depending upon the impulse or corrective that will be forming now. always protecting capital is important in any investing cycle

POWER FIN CORP LTD S/R Support and Resistance Levels:
Support Levels: These are price points (green line/shade) where a downward trend may be halted due to a concentration of buying interest. Imagine them as a safety net where buyers step in, preventing further decline.
Resistance Levels: Conversely, resistance levels (re

PFC Making Flag pattern for 2X targetsThis is the daily timeframe chart of PFC
Prices are down 30% from highs and now currently trading around 400 levels
Stock is making flag pattern and we may get huge upside if stock gives breakout of the resistance
One can expect stock to gp up till 480-490 levels for quick upside
Thank You !!

Take look at PFC its forming classic cup and handle pattern
breaking out of consolidation
Traget 560 for swing
610 for positional
SL 440
This strictly for educational purpose
Market is ATH so trade strctly with SL
if market falls no strategy works

See all ideas
Summarizing what the indicators are suggesting.
Neutral
SellBuy
Strong sellStrong buy
Strong sellSellNeutralBuyStrong buy
Neutral
SellBuy
Strong sellStrong buy
Strong sellSellNeutralBuyStrong buy
Neutral
SellBuy
Strong sellStrong buy
Strong sellSellNeutralBuyStrong buy
An aggregate view of professional's ratings.
Neutral
SellBuy
Strong sellStrong buy
Strong sellSellNeutralBuyStrong buy
Neutral
SellBuy
Strong sellStrong buy
Strong sellSellNeutralBuyStrong buy
Neutral
SellBuy
Strong sellStrong buy
Strong sellSellNeutralBuyStrong buy
Displays a symbol's price movements over previous years to identify recurring trends.
779PFCL30
PFCL-7.79%-22-7-30-PVTYield to maturity
13.97%
Maturity date
Jul 22, 2030
663PFCL31
PFCL-6.63%-22-1-31-NCDYield to maturity
8.91%
Maturity date
Jan 22, 2031
885PFCL29
PFCL-8.85%-25-5-29-PVTYield to maturity
8.08%
Maturity date
May 25, 2029
946PFCL26
PFC-9.46%-1-8-26-PVTYield to maturity
8.05%
Maturity date
Aug 1, 2026
755PFCL38
PFC-7.55%-1-8-38-NCDYield to maturity
7.53%
Maturity date
Aug 1, 2038
697PFCL36
PFCL-6.97%-22-1-36-NCDYield to maturity
7.22%
Maturity date
Jan 22, 2036
695PFCL36
PFCL-6.95%-22-1-36-NCDYield to maturity
6.95%
Maturity date
Jan 22, 2036
682PFCL31
PFCL-6.82%-22-1-31-NCDYield to maturity
6.94%
Maturity date
Jan 22, 2031
775PFCL27
PFC-7.75%-22-03-27-PVTYield to maturity
6.73%
Maturity date
Mar 22, 2027
58PFCL26
PFCL-5.8%-22-1-26-NCDYield to maturity
6.68%
Maturity date
Jan 22, 2026
775PFCL30
PFC-B-7.75%-11-6-30-PVTYield to maturity
6.64%
Maturity date
Jun 11, 2030
See all PFC bonds
Frequently Asked Questions
The current price of PFC is 430.75 INR — it has increased by 0.28% in the past 24 hours. Watch POWER FINANCE CORPORATION LTD. stock price performance more closely on the chart.
Depending on the exchange, the stock ticker may vary. For instance, on BSE exchange POWER FINANCE CORPORATION LTD. stocks are traded under the ticker PFC.
PFC stock has risen by 3.37% compared to the previous week, the month change is a −0.69% fall, over the last year POWER FINANCE CORPORATION LTD. has showed a −23.99% decrease.
We've gathered analysts' opinions on POWER FINANCE CORPORATION LTD. future price: according to them, PFC price has a max estimate of 600.00 INR and a min estimate of 450.00 INR. Watch PFC chart and read a more detailed POWER FINANCE CORPORATION LTD. stock forecast: see what analysts think of POWER FINANCE CORPORATION LTD. and suggest that you do with its stocks.
PFC stock is 2.56% volatile and has beta coefficient of 1.60. Track POWER FINANCE CORPORATION LTD. stock price on the chart and check out the list of the most volatile stocks — is POWER FINANCE CORPORATION LTD. there?
Today POWER FINANCE CORPORATION LTD. has the market capitalization of 1.42 T, it has increased by 0.41% over the last week.
Yes, you can track POWER FINANCE CORPORATION LTD. financials in yearly and quarterly reports right on TradingView.
POWER FINANCE CORPORATION LTD. is going to release the next earnings report on Aug 8, 2025. Keep track of upcoming events with our Earnings Calendar.
PFC earnings for the last quarter are 15.49 INR per share, whereas the estimation was 14.82 INR resulting in a 4.52% surprise. The estimated earnings for the next quarter are 12.11 INR per share. See more details about POWER FINANCE CORPORATION LTD. earnings.
POWER FINANCE CORPORATION LTD. revenue for the last quarter amounts to 70.87 B INR, despite the estimated figure of 64.14 B INR. In the next quarter, revenue is expected to reach 53.59 B INR.
PFC net income for the last quarter is 63.16 B INR, while the quarter before that showed 58.29 B INR of net income which accounts for 8.37% change. Track more POWER FINANCE CORPORATION LTD. financial stats to get the full picture.
POWER FINANCE CORPORATION LTD. dividend yield was 3.81% in 2024, and payout ratio reached 22.68%. The year before the numbers were 3.46% and 22.54% correspondingly. See high-dividend stocks and find more opportunities for your portfolio.
EBITDA measures a company's operating performance, its growth signifies an improvement in the efficiency of a company. POWER FINANCE CORPORATION LTD. EBITDA is 407.31 B INR, and current EBITDA margin is 38.23%. See more stats in POWER FINANCE CORPORATION LTD. financial statements.
Like other stocks, PFC shares are traded on stock exchanges, e.g. Nasdaq, Nyse, Euronext, and the easiest way to buy them is through an online stock broker. To do this, you need to open an account and follow a broker's procedures, then start trading. You can trade POWER FINANCE CORPORATION LTD. stock right from TradingView charts — choose your broker and connect to your account.
Investing in stocks requires a comprehensive research: you should carefully study all the available data, e.g. company's financials, related news, and its technical analysis. So POWER FINANCE CORPORATION LTD. technincal analysis shows the buy rating today, and its 1 week rating is buy. Since market conditions are prone to changes, it's worth looking a bit further into the future — according to the 1 month rating POWER FINANCE CORPORATION LTD. stock shows the buy signal. See more of POWER FINANCE CORPORATION LTD. technicals for a more comprehensive analysis.
If you're still not sure, try looking for inspiration in our curated watchlists.
If you're still not sure, try looking for inspiration in our curated watchlists.