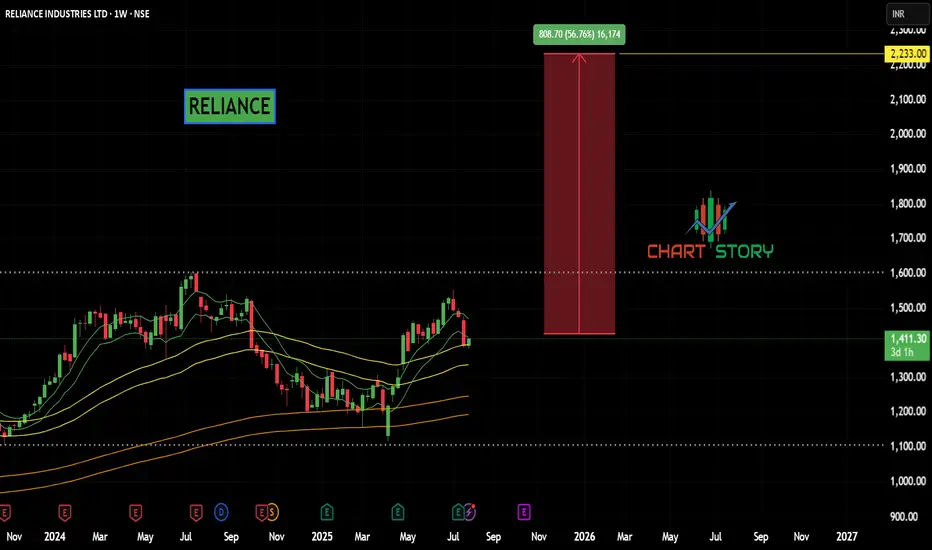
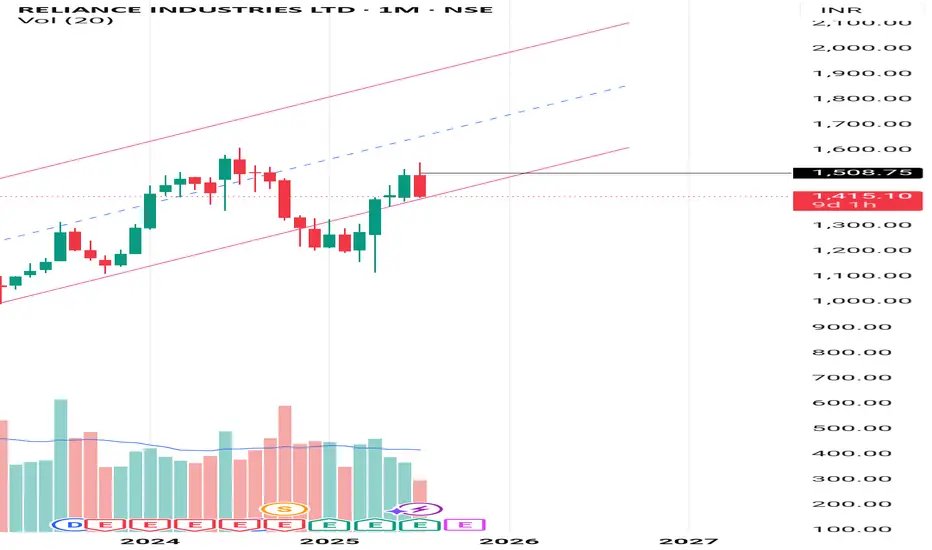
RELIANCE - PARABOLIC BUYNSE:RELIANCE Weekly parabolic formation may continue further upward trend for short to mid term.
Next report date
—
Report period
—
EPS estimate
—
Revenue estimate
—
60.25 INR
696.48 B INR
9.65 T INR
6.78 B
About RELIANCE INDUSTRIES LTD
Sector
Industry
CEO
Mukesh Dhirubhai Ambani
Website
Headquarters
Mumbai
Founded
1957
ISIN
INE002A01018
FIGI
BBG000BKVPT1
Reliance Industries Limited is engaged in refining, including manufacturing of refined petroleum products, and petrochemicals, including manufacturing of basic chemicals, fertilizers and nitrogen compounds, plastic and synthetic rubber in primary forms. The Company's segments include Refining, Petrochemicals, Oil and Gas, Organized Retail and Others. The Refining segment includes production and marketing operations of the petroleum products. The Petrochemicals segment includes production and marketing operations of petrochemical products, including polyethylene, polypropylene, polyvinyl chloride, poly butadiene rubber, butadiene, acrylonitrile, caustic soda and polyethylene terephthalate. The Oil and Gas segment includes exploration, development and production of crude oil and natural gas. The Organized Retail segment includes organized retail business in India. The Others segment includes textile, Special Economic Zone (SEZ) development, telecom or broadband business and media.
Related stocks
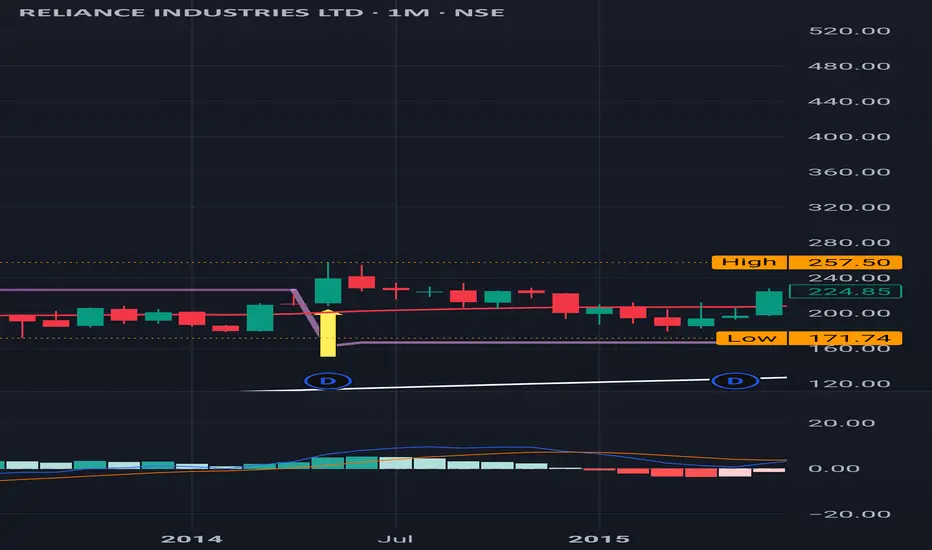
Reliance : A brilliant Journey from May 2014 from 200Reliance : A brilliant Journey from May 2014 from the price level of 200 to until now
It has never been a Sell on a monthly time frame since then.
Even during the Covid time in March 2020 it ditched a Sell signal on a Monthly Time Frame.
It started it's run at around the price level of mere 200
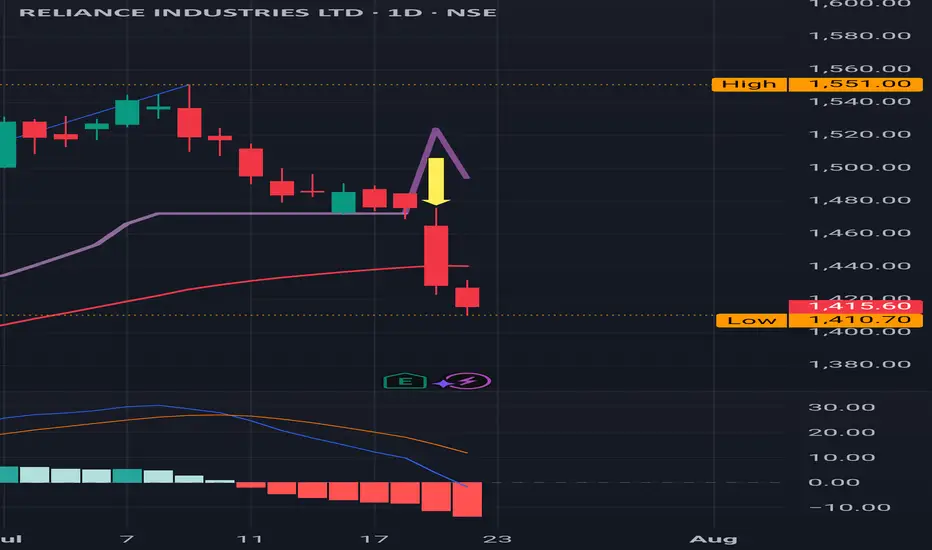
REL : Sitting at an important support level of 1400 ish.
REL : Sitting at an important support level of 1400 ish.
( Not a Buy / Sell Recommendation
Do your own due diligence ,Market is subject to risks, This is my own view and for learning only .)
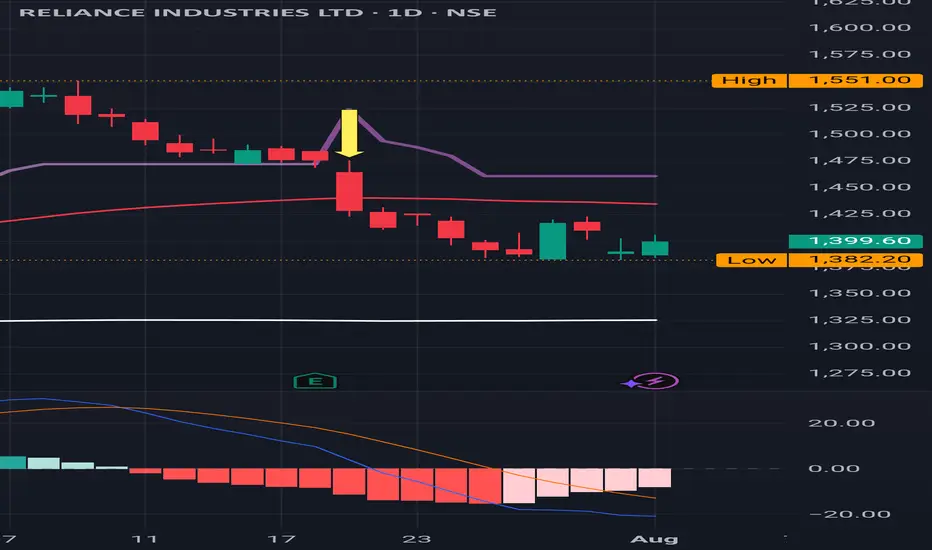
REL : Sell Triggered , around 1400 is an important support levelREL : Sell Triggered .
1390 to 1400 is an important support level.
( Not a Buy / Sell Recommendation
Do your own due diligence ,Market is subject to risks, This is my own view and for learning only .)
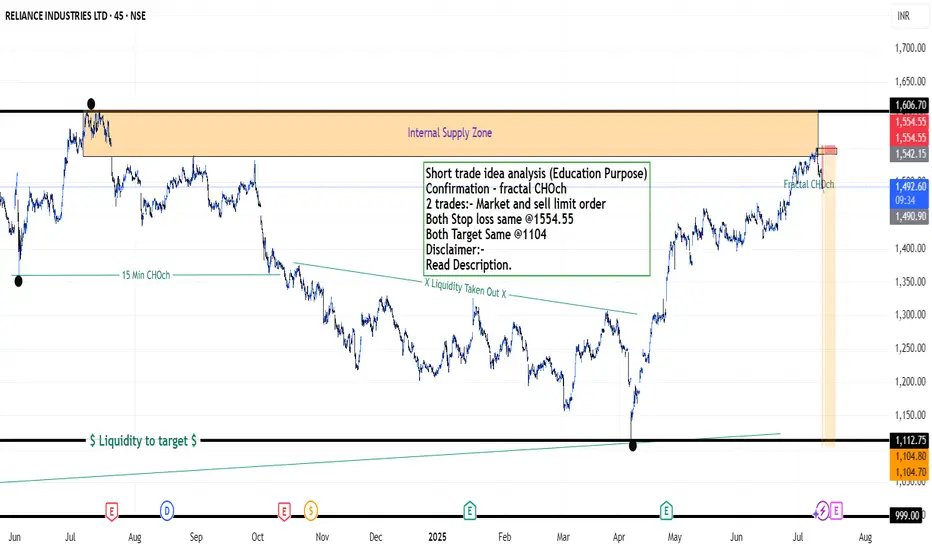
Reliance Industries Stock(India) - {11/07/2025}Educational Analysis says that Reliance Industries (Indian Stock) may give trend Trading opportunities from this range, according to my technical analysis.
Broker - NA
So, my analysis is based on a top-down approach from weekly to trend range to internal trend range.
So my analysis comprises of two
Reliance industries , down trend for few monthsProfit booking and giving an opportunity to buy a round 1260-1230 in some months.
5-6? Month's supply and then demand around 1300-1260.

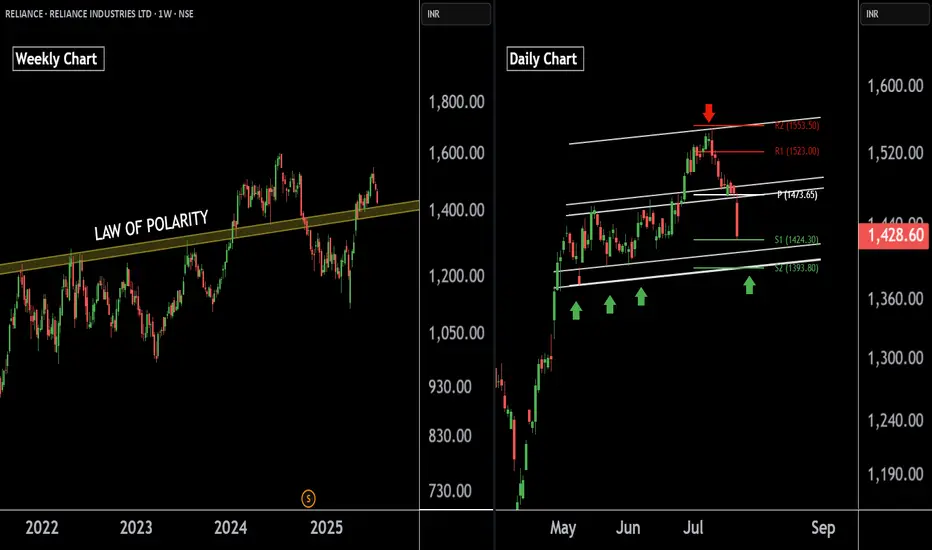
Reliance Industries — Preparing for the Next Bullish Leg !!There are two charts of Reliance Industries — one on the weekly timeframe and the other on the daily timeframe.
On the weekly timeframe:
Reliance industries is trading near (LOP), with a key support zone in the range of 1385–1400.
On the daily timeframe:
Reliance industries is moving in well defin
Reliance industries on weekly channel support Reliance industries #reliance on weekly channel support. Bullish view
Reliance Entry done @ 1425Reliance Industries Ltd (RIL) shares are experiencing a decline, currently trading around ₹1424-1425. This recent dip comes despite the company reporting robust Q1 FY26 results with a significant 78% year-on-year rise in consolidated net profit to ₹26,994 crore, largely driven by a one-time gain fro
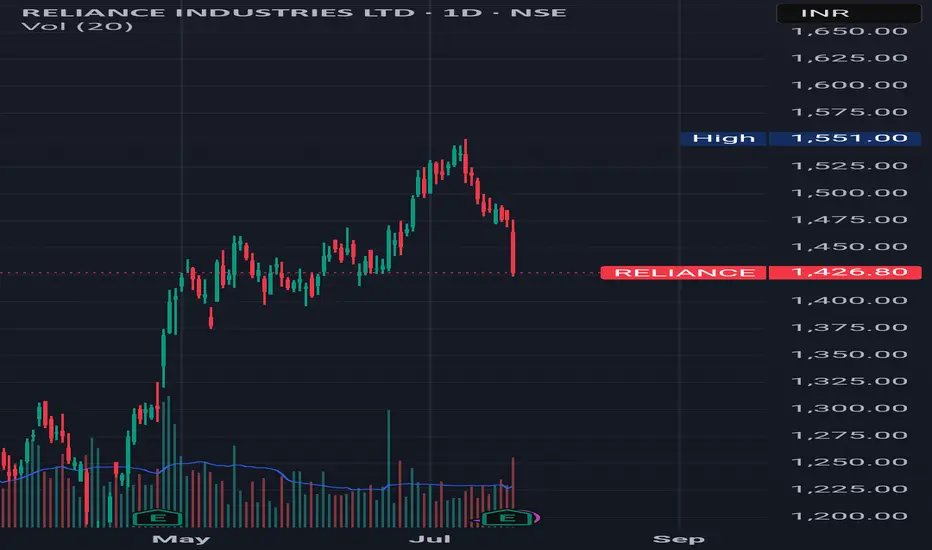
What to do with Reliance share after its drubbing today? Reliance looks weak post result however there is no spike in volume of sale that is a good point. The levels from which Reliance can recover seem to be 1427, 1370 or 1323. If we get a closing below 1323 the stock can fall to 1217 or even 1160 levels this is the reading as of now.
The result was lo

See all ideas
Summarizing what the indicators are suggesting.
Neutral
SellBuy
Strong sellStrong buy
Strong sellSellNeutralBuyStrong buy
Neutral
SellBuy
Strong sellStrong buy
Strong sellSellNeutralBuyStrong buy
Neutral
SellBuy
Strong sellStrong buy
Strong sellSellNeutralBuyStrong buy
An aggregate view of professional's ratings.
Neutral
SellBuy
Strong sellStrong buy
Strong sellSellNeutralBuyStrong buy
Neutral
SellBuy
Strong sellStrong buy
Strong sellSellNeutralBuyStrong buy
Neutral
SellBuy
Strong sellStrong buy
Strong sellSellNeutralBuyStrong buy
Displays a symbol's price movements over previous years to identify recurring trends.
USY72570AL17
RelianceInd 10,25% 15/01/2097Yield to maturity
6.93%
Maturity date
Jan 15, 2097
RLNGF5335117
Reliance Industries Limited 3.625% 12-JAN-2052Yield to maturity
6.76%
Maturity date
Jan 12, 2052
RLNGF5335118
Reliance Industries Limited 3.75% 12-JAN-2062Yield to maturity
6.72%
Maturity date
Jan 12, 2062
USY72570AG22
RelianceInd 10,5% 06/08/2046Yield to maturity
6.38%
Maturity date
Aug 6, 2046
RLNGF4208883
Reliance Industries Limited 4.875% 10-FEB-2045Yield to maturity
6.36%
Maturity date
Feb 10, 2045
RLNGF5059438
Reliance Industries Limited 6.25% 19-OCT-2040Yield to maturity
5.41%
Maturity date
Oct 19, 2040
RLNGF5335116
Reliance Industries Limited 2.875% 12-JAN-2032Yield to maturity
5.18%
Maturity date
Jan 12, 2032
RLNGF4567942
Reliance Industries Limited 3.667% 30-NOV-2027Yield to maturity
4.57%
Maturity date
Nov 30, 2027
RLNGF4280137
Reliance Industries Limited 2.512% 15-JAN-2026Yield to maturity
4.05%
Maturity date
Jan 15, 2026
RLNGF4439521
Reliance Industries Limited 2.444% 15-JAN-2026Yield to maturity
3.99%
Maturity date
Jan 15, 2026
RLNGF4419461
Reliance Industries Limited 1.87% 15-JAN-2026Yield to maturity
3.66%
Maturity date
Jan 15, 2026
See all RELIANCE bonds
Curated watchlists where RELIANCE is featured.

Downstream oil: Petroleum through the pipes
39 No. of Symbols

Indian stocks: Racing ahead
46 No. of Symbols

See all sparks
Frequently Asked Questions
The current price of RELIANCE is 1,393.60 INR — it has increased by 0.24% in the past 24 hours. Watch RELIANCE INDUSTRIES LTD. stock price performance more closely on the chart.
Depending on the exchange, the stock ticker may vary. For instance, on BSE exchange RELIANCE INDUSTRIES LTD. stocks are traded under the ticker RELIANCE.
RELIANCE stock has fallen by −0.60% compared to the previous week, the month change is a −8.91% fall, over the last year RELIANCE INDUSTRIES LTD. has showed a −7.82% decrease.
We've gathered analysts' opinions on RELIANCE INDUSTRIES LTD. future price: according to them, RELIANCE price has a max estimate of 1,850.00 INR and a min estimate of 1,300.00 INR. Watch RELIANCE chart and read a more detailed RELIANCE INDUSTRIES LTD. stock forecast: see what analysts think of RELIANCE INDUSTRIES LTD. and suggest that you do with its stocks.
RELIANCE reached its all-time high on Jul 8, 2024 with the price of 1,608.95 INR, and its all-time low was 2.15 INR and was reached on Mar 9, 1990. View more price dynamics on RELIANCE chart.
See other stocks reaching their highest and lowest prices.
See other stocks reaching their highest and lowest prices.
RELIANCE stock is 1.51% volatile and has beta coefficient of 1.19. Track RELIANCE INDUSTRIES LTD. stock price on the chart and check out the list of the most volatile stocks — is RELIANCE INDUSTRIES LTD. there?
Today RELIANCE INDUSTRIES LTD. has the market capitalization of 18.86 T, it has decreased by −2.07% over the last week.
Yes, you can track RELIANCE INDUSTRIES LTD. financials in yearly and quarterly reports right on TradingView.
RELIANCE INDUSTRIES LTD. is going to release the next earnings report on Oct 17, 2025. Keep track of upcoming events with our Earnings Calendar.
RELIANCE earnings for the last quarter are 19.90 INR per share, whereas the estimation was 15.75 INR resulting in a 26.34% surprise. The estimated earnings for the next quarter are 17.83 INR per share. See more details about RELIANCE INDUSTRIES LTD. earnings.
RELIANCE INDUSTRIES LTD. revenue for the last quarter amounts to 2.44 T INR, despite the estimated figure of 2.41 T INR. In the next quarter, revenue is expected to reach 2.46 T INR.
RELIANCE net income for the last quarter is 269.94 B INR, while the quarter before that showed 194.07 B INR of net income which accounts for 39.09% change. Track more RELIANCE INDUSTRIES LTD. financial stats to get the full picture.
Yes, RELIANCE dividends are paid annually. The last dividend per share was 10.00 INR. As of today, Dividend Yield (TTM)% is 0.36%. Tracking RELIANCE INDUSTRIES LTD. dividends might help you take more informed decisions.
RELIANCE INDUSTRIES LTD. dividend yield was 0.43% in 2024, and payout ratio reached 10.69%. The year before the numbers were 0.34% and 9.72% correspondingly. See high-dividend stocks and find more opportunities for your portfolio.
EBITDA measures a company's operating performance, its growth signifies an improvement in the efficiency of a company. RELIANCE INDUSTRIES LTD. EBITDA is 1.70 T INR, and current EBITDA margin is 17.15%. See more stats in RELIANCE INDUSTRIES LTD. financial statements.
Like other stocks, RELIANCE shares are traded on stock exchanges, e.g. Nasdaq, Nyse, Euronext, and the easiest way to buy them is through an online stock broker. To do this, you need to open an account and follow a broker's procedures, then start trading. You can trade RELIANCE INDUSTRIES LTD. stock right from TradingView charts — choose your broker and connect to your account.
Investing in stocks requires a comprehensive research: you should carefully study all the available data, e.g. company's financials, related news, and its technical analysis. So RELIANCE INDUSTRIES LTD. technincal analysis shows the sell today, and its 1 week rating is buy. Since market conditions are prone to changes, it's worth looking a bit further into the future — according to the 1 month rating RELIANCE INDUSTRIES LTD. stock shows the buy signal. See more of RELIANCE INDUSTRIES LTD. technicals for a more comprehensive analysis.
If you're still not sure, try looking for inspiration in our curated watchlists.
If you're still not sure, try looking for inspiration in our curated watchlists.