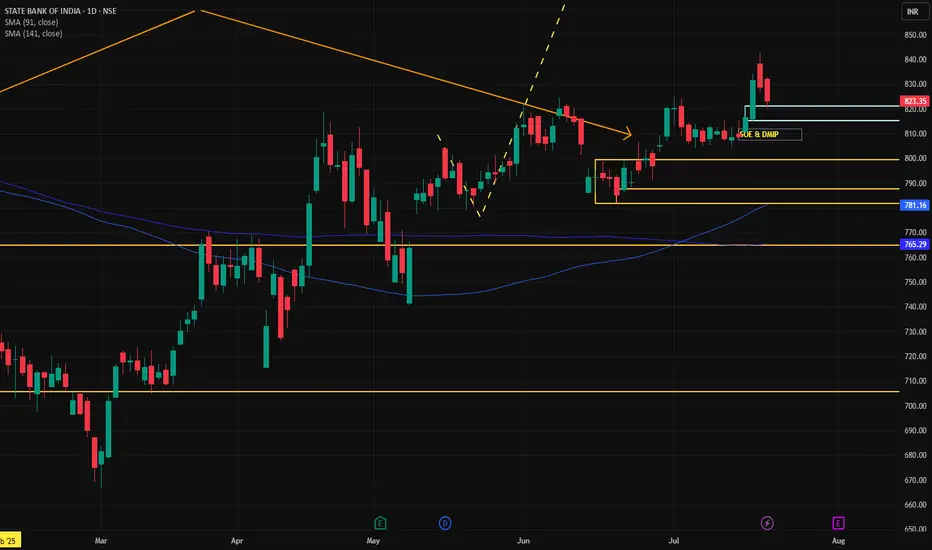
Continuation Inverse head and shoulder pattern Continuation Inverse head and shoulder pattern is trend continuation setup indicates price continue the previous trend
Key facts today
Next report date
—
Report period
—
EPS estimate
—
Revenue estimate
—
89.00 INR
775.61 B INR
6.58 T INR
3.98 B
About STATE BANK OF INDIA
Sector
Industry
CEO
Rana Ashutosh Kumar Singh
Website
Headquarters
Mumbai
Founded
1921
ISIN
INE062A01020
FIGI
BBG000GQ5829
State Bank of India provides a range of products and services to personal, commercial enterprises, large corporates, public bodies and institutional customers. Its segments include Treasury, which includes the entire investment portfolio and trading in foreign exchange contracts and derivative contracts; Corporate/Wholesale Banking, which comprises the lending activities of Corporate Accounts Group, Mid Corporate Accounts Group and Stressed Assets Management Group; Retail Banking, which comprises branches in National Banking Group, which primarily includes Personal Banking activities, including lending activities to corporate customers having banking relations with branches in the National Banking Group, and Other Banking Business, which includes the operations of all the Non-Banking Subsidiaries/Joint Ventures other than SBI Life Insurance Co. Ltd. and SBI General Insurance Co. Ltd. Its geographical segments include Domestic Operations and Foreign Operations.
Related stocks

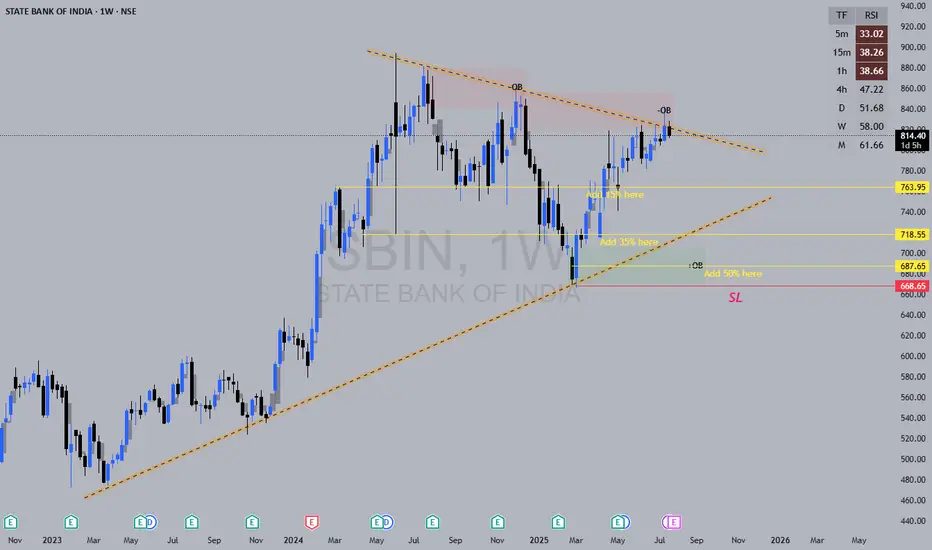
SBIN✅ Updated Trade Plan Summary
✅ Updated Trade Plan Summary
Metric Previous Value Updated Value
Entry 800 800
Stop Loss (SL) 757 775
Risk 43 25
Target 1256 1256
Reward 456 456
Risk-Reward (RR) 10.6 18.2
🔍 Implications of the Change
🔽 Risk reduced from 43 to 25 points
✅ RR improved significantly fro
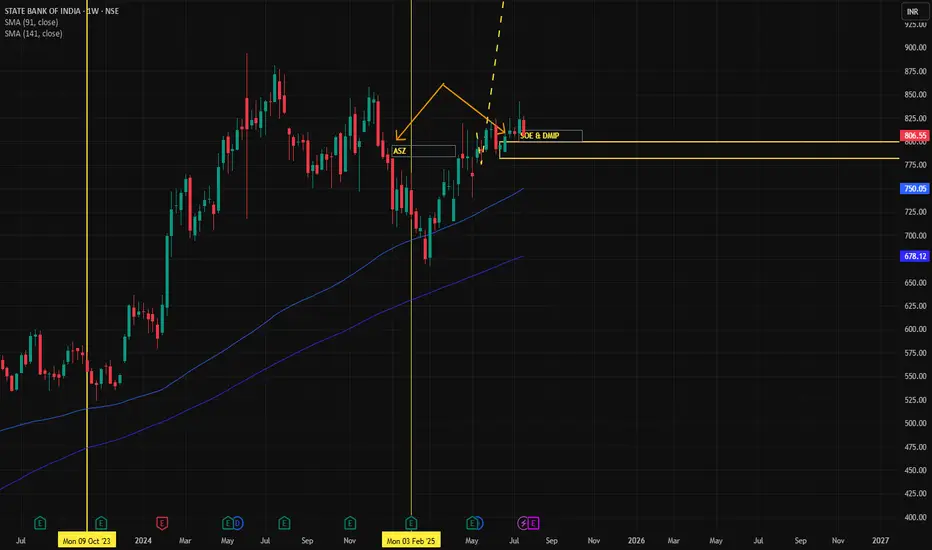
SBIN🧠 Technical Logics Highlighted
Qtrly BUFL Zone is respected – strong confirmation of demand at 765–705.
Weekly ASZ previously formed at 793, reinforcing buyer interest.
Engulfing Pattern with DMIP & SOE confirms buying strength.
Current price trades above Gann Level (766) – a technical sign of st
SBIN (Swing Trade) LONGThis stock has broken out of a trend line and looking good for a good upper move. Current CMP is 835, book your profit on 900 , SL will at last swing(805) .

SBIN , 1W , Bullish As the Pattern is Formed and given Breakout , enter after strong candle close in weekly Timeframe and put SL below Swing low . follow proper risk management
follow for more swing ideas like this

STATE BANK OF INDIA IN A BULLISH MOMENTUMThe technical setup suggests bullish momentum with Elliott Wave supporting continuation higher. Key upside levels are ₹850 and ₹880, as long as the price holds above trend support near ₹820-₹830. A failure below this zone would weaken the bullish outlook.

Importance of ATR(Average True Range)So idea here is to calculate risk.
understanding fear in the market ATR is an indication of volatility , not direction.
A smaller ATR range means low volatility.. tentatively market is consolidating.
A larger ATR range means the market is dealing with uncertainty so volatility has increased.
yo

SBI - My Pick - No Financial Advice - VCP PatternAfter a recent upside rally SBI has retraced approx 8.5% from the resistance zone of 825-830, theafter second compression of 5% occurred. Thus I see sucessive Volatility contraction. Recent Golden Cross over clubbed with VCP is indication of good buying opportunity. Short to mid-term momentum is bul

Buy above 817 fast target 873Everything mention about in my chart
buy price range cmp -811.85
stop loss - 797 day closing
fast target - 873
I am not sebi reg
is my own idea only

See all ideas
Summarizing what the indicators are suggesting.
Neutral
SellBuy
Strong sellStrong buy
Strong sellSellNeutralBuyStrong buy
Neutral
SellBuy
Strong sellStrong buy
Strong sellSellNeutralBuyStrong buy
Neutral
SellBuy
Strong sellStrong buy
Strong sellSellNeutralBuyStrong buy
An aggregate view of professional's ratings.
Neutral
SellBuy
Strong sellStrong buy
Strong sellSellNeutralBuyStrong buy
Neutral
SellBuy
Strong sellStrong buy
Strong sellSellNeutralBuyStrong buy
Neutral
SellBuy
Strong sellStrong buy
Strong sellSellNeutralBuyStrong buy
Displays a symbol's price movements over previous years to identify recurring trends.
S
SBIN5412137
State Bank of India (London Branch) 2.49% 26-JAN-2027Yield to maturity
4.93%
Maturity date
Jan 26, 2027
S
SBIN5114735
State Bank of India (London Branch) 1.8% 13-JUL-2026Yield to maturity
4.67%
Maturity date
Jul 13, 2026
S
SBIN5693776
State Bank of India (London Branch) 4.875% 05-MAY-2028Yield to maturity
4.61%
Maturity date
May 5, 2028
See all SBIN bonds
Curated watchlists where SBIN is featured.

Indian stocks: Racing ahead
46 No. of Symbols
See all sparks
Frequently Asked Questions
The current price of SBIN is 823.55 INR — it has increased by 2.45% in the past 24 hours. Watch STATE BANK OF INDIA stock price performance more closely on the chart.
Depending on the exchange, the stock ticker may vary. For instance, on BSE exchange STATE BANK OF INDIA stocks are traded under the ticker SBIN.
SBIN stock has risen by 3.69% compared to the previous week, the month change is a 2.02% rise, over the last year STATE BANK OF INDIA has showed a 0.53% increase.
We've gathered analysts' opinions on STATE BANK OF INDIA future price: according to them, SBIN price has a max estimate of 1,100.00 INR and a min estimate of 720.00 INR. Watch SBIN chart and read a more detailed STATE BANK OF INDIA stock forecast: see what analysts think of STATE BANK OF INDIA and suggest that you do with its stocks.
SBIN reached its all-time high on Jun 3, 2024 with the price of 912.10 INR, and its all-time low was 13.20 INR and was reached on Sep 21, 2001. View more price dynamics on SBIN chart.
See other stocks reaching their highest and lowest prices.
See other stocks reaching their highest and lowest prices.
SBIN stock is 0.58% volatile and has beta coefficient of 0.94. Track STATE BANK OF INDIA stock price on the chart and check out the list of the most volatile stocks — is STATE BANK OF INDIA there?
Today STATE BANK OF INDIA has the market capitalization of 7.61 T, it has increased by 1.42% over the last week.
Yes, you can track STATE BANK OF INDIA financials in yearly and quarterly reports right on TradingView.
STATE BANK OF INDIA is going to release the next earnings report on Nov 3, 2025. Keep track of upcoming events with our Earnings Calendar.
SBIN earnings for the last quarter are 21.47 INR per share, whereas the estimation was 18.31 INR resulting in a 17.23% surprise. The estimated earnings for the next quarter are 14.46 INR per share. See more details about STATE BANK OF INDIA earnings.
STATE BANK OF INDIA revenue for the last quarter amounts to 584.18 B INR, despite the estimated figure of 566.80 B INR. In the next quarter, revenue is expected to reach 556.02 B INR.
SBIN net income for the last quarter is 212.01 B INR, while the quarter before that showed 196.00 B INR of net income which accounts for 8.17% change. Track more STATE BANK OF INDIA financial stats to get the full picture.
Yes, SBIN dividends are paid annually. The last dividend per share was 15.90 INR. As of today, Dividend Yield (TTM)% is 1.93%. Tracking STATE BANK OF INDIA dividends might help you take more informed decisions.
STATE BANK OF INDIA dividend yield was 2.06% in 2024, and payout ratio reached 18.30%. The year before the numbers were 1.82% and 18.23% correspondingly. See high-dividend stocks and find more opportunities for your portfolio.
As of Aug 12, 2025, the company has 236.23 K employees. See our rating of the largest employees — is STATE BANK OF INDIA on this list?
Like other stocks, SBIN shares are traded on stock exchanges, e.g. Nasdaq, Nyse, Euronext, and the easiest way to buy them is through an online stock broker. To do this, you need to open an account and follow a broker's procedures, then start trading. You can trade STATE BANK OF INDIA stock right from TradingView charts — choose your broker and connect to your account.
Investing in stocks requires a comprehensive research: you should carefully study all the available data, e.g. company's financials, related news, and its technical analysis. So STATE BANK OF INDIA technincal analysis shows the buy rating today, and its 1 week rating is strong buy. Since market conditions are prone to changes, it's worth looking a bit further into the future — according to the 1 month rating STATE BANK OF INDIA stock shows the buy signal. See more of STATE BANK OF INDIA technicals for a more comprehensive analysis.
If you're still not sure, try looking for inspiration in our curated watchlists.
If you're still not sure, try looking for inspiration in our curated watchlists.