Amazing breakout on WEEKLY Timeframe - THOMASCOOKCheckout an amazing breakout happened in the stock in Weekly timeframe, macroscopically seen in Daily timeframe. Having a great favor that the stock might be bullish expecting a staggering returns of minimum 25% TGT. IMPORTANT BREAKOUT LEVELS ARE ALWAYS RESPECTED!
NOTE for learners: Place the break
Next report date
—
Report period
—
EPS estimate
—
Revenue estimate
—
5.40 INR
2.54 B INR
81.40 B INR
160.78 M
About THOMAS COOK (INDIA) LTD
Sector
Industry
CEO
Mahesh Chandran Iyer
Website
Headquarters
Mumbai
Founded
1881
ISIN
INE332A01027
FIGI
BBG000D153Q2
Thomas Cook (India) Ltd. is a holding company, which engages in the provision of travel and travel related financial services. It offers foreign exchange, corporate travel, MICE, leisure travel, insurance, visa and passport services, and e-business. It operates through the following business segments: Financial Services, Travel and Related Services, Leisure Hospitality and Resorts Business, and Digiphoto Imaging Services. The Financial Services segment includes wholesale purchase and sale of foreign currencies and paid documents. The Travel and Related Services segment covers the operations, travel management, visa services, travel insurance, and related servicesThe Leisure Hospitality and Resorts Business segment relates to the time share holidays' business. The Digiphoto Imaging Services segment focuses on imaging solutions and related services. The company was founded in 1881 and is headquartered in Mumbai, India.
Related stocks
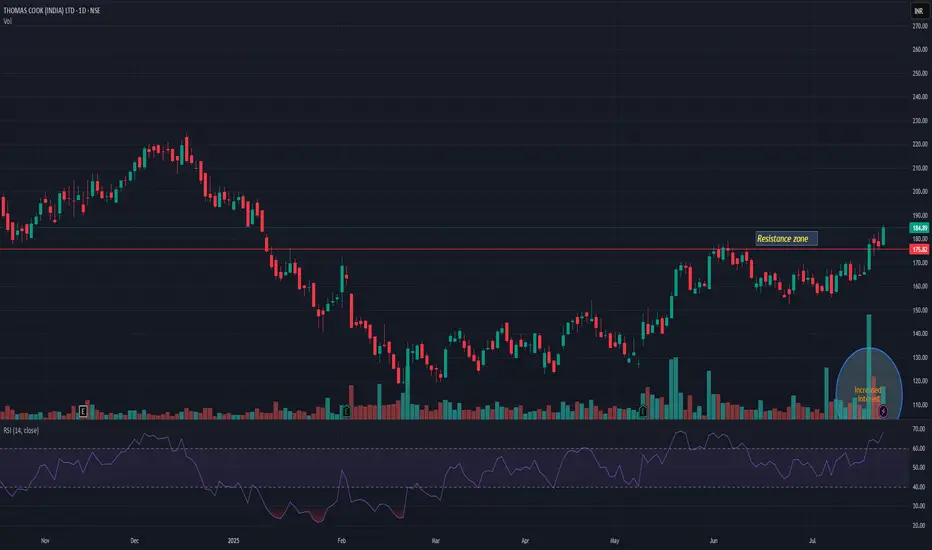
THOMASCOOKTHOMASCOOK has broken previous resistance level. Market participation is also increased with breakout. It may resist nr 210-12 level. Closing below 175 may change my view. Keep it on radar.
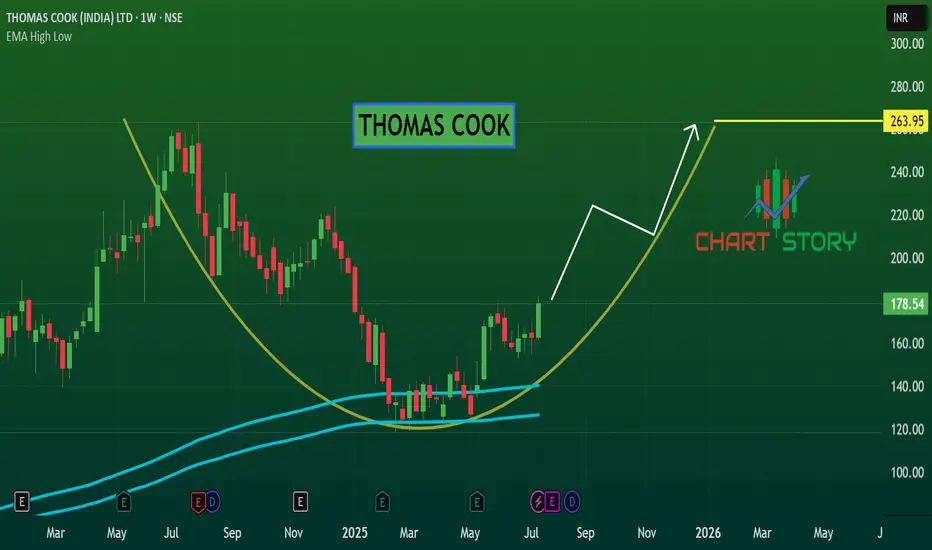
THOMAS COOK - BOTTOM FISHINGNSE:THOMASCOOK Weekly rounding bottom with momentum and macd crossover may continue upward with same momentum.
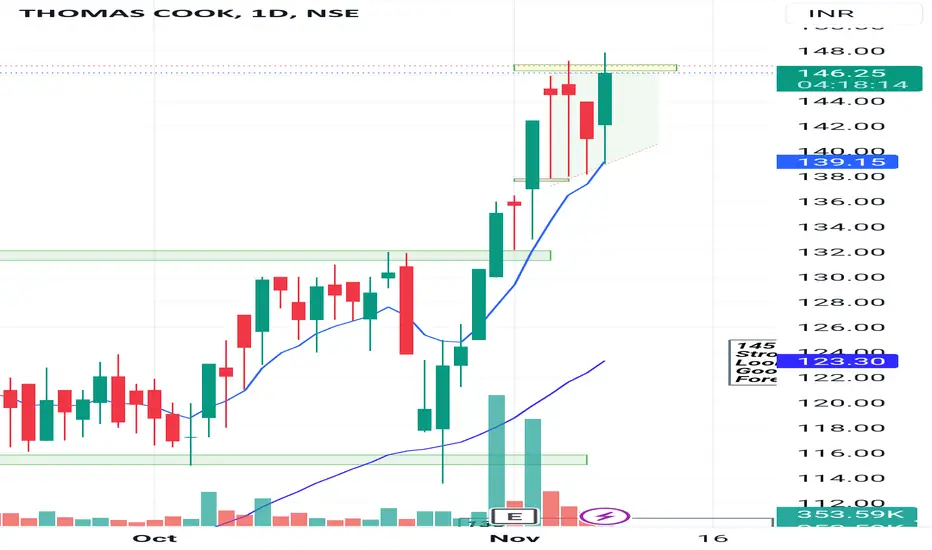
Cup and Handle Breakout in THOMAS COOK (INDIA) LTDTHOMAS COOK (INDIA) LTD is showing a classic Cup and Handle breakout pattern on the daily chart.
🔍 Chart Highlight
Breakout from the Cup's rim around ₹169.93 level.
Strong bullish candle with +7.61% gain, backed by higher volume.
Price sustained above the 200 EMA (₹163.85).
Next potential resis

#THOMASCOOK is near to Break Previous All Time High
Company has reduced debt.
Company is expected to give good quarter
Company's median sales growth is 43.8% of last 10 years

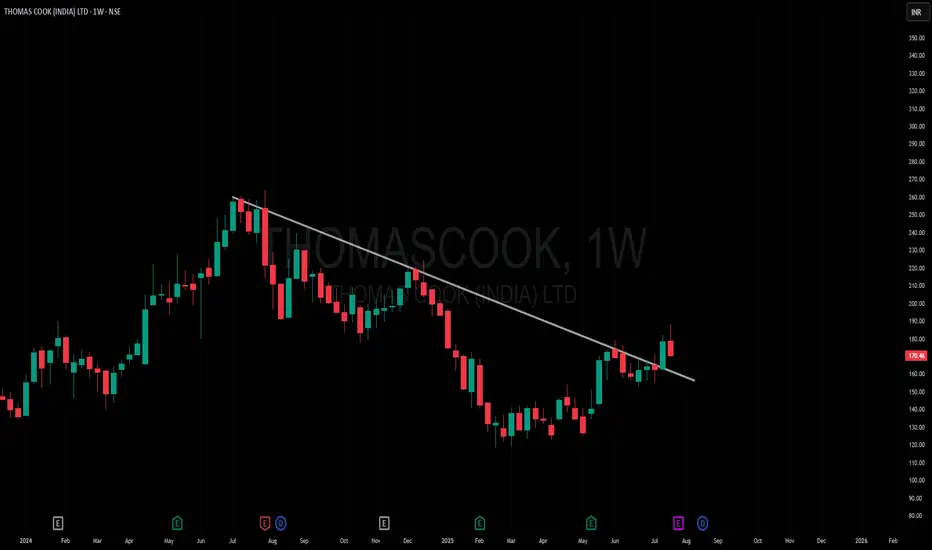
THOMAS COOK ( Whats Cooking ? )Thomas Cook Seems to cross its long term trendline Resistance on a Monthly chart
Will be interesting to see how the Monthly candle closes at the end of May 2024
* FII have raised its holding in this stock
* PAT and NET PROFIT have grown substantially
A good TechnoFunda bet

Trade Idea in THOMASCOOKHere we can see a Swing Trade in NSE:THOMASCOOK
Buy NSE:THOMASCOOK
CMP 192
TP 122
SL 169
Thomas Cook (India) Ltd. is a holding company, which engages in the provision of travel and travel related financial services. It offers foreign exchange, corporate travel, MICE, leisure travel, insur

Thomas Cook Long PositionBuy Thomas Cook @ CMP
for the Target of 212-363
SL 120
Strategy : SBO + RSI > 60 + EMA above 20 & 50
Duration few Weeks

Thomas cook on a Ascending triangleTechnically in a good position
Made an ascending traingle
Waiting for a big break
Afrer a short term dip selling pressure
Reduced and buyers stepped in.
Turnaround story..
Travel Business is rcovering and growing on a good pace is positive factors.
165 next target
Stop140.
Risky bet..

See all ideas
Summarizing what the indicators are suggesting.
Neutral
SellBuy
Strong sellStrong buy
Strong sellSellNeutralBuyStrong buy
Neutral
SellBuy
Strong sellStrong buy
Strong sellSellNeutralBuyStrong buy
Neutral
SellBuy
Strong sellStrong buy
Strong sellSellNeutralBuyStrong buy
An aggregate view of professional's ratings.
Neutral
SellBuy
Strong sellStrong buy
Strong sellSellNeutralBuyStrong buy
Neutral
SellBuy
Strong sellStrong buy
Strong sellSellNeutralBuyStrong buy
Neutral
SellBuy
Strong sellStrong buy
Strong sellSellNeutralBuyStrong buy
Displays a symbol's price movements over previous years to identify recurring trends.
Frequently Asked Questions
The current price of THOMASCOOK is 160.40 INR — it has decreased by −5.54% in the past 24 hours. Watch THOMAS COOK (INDIA) LTD. stock price performance more closely on the chart.
Depending on the exchange, the stock ticker may vary. For instance, on BSE exchange THOMAS COOK (INDIA) LTD. stocks are traded under the ticker THOMASCOOK.
THOMASCOOK stock has fallen by −9.53% compared to the previous week, the month change is a −1.87% fall, over the last year THOMAS COOK (INDIA) LTD. has showed a −36.61% decrease.
We've gathered analysts' opinions on THOMAS COOK (INDIA) LTD. future price: according to them, THOMASCOOK price has a max estimate of 338.00 INR and a min estimate of 215.00 INR. Watch THOMASCOOK chart and read a more detailed THOMAS COOK (INDIA) LTD. stock forecast: see what analysts think of THOMAS COOK (INDIA) LTD. and suggest that you do with its stocks.
THOMASCOOK reached its all-time high on Apr 24, 2018 with the price of 302.90 INR, and its all-time low was 21.80 INR and was reached on Mar 25, 2020. View more price dynamics on THOMASCOOK chart.
See other stocks reaching their highest and lowest prices.
See other stocks reaching their highest and lowest prices.
THOMASCOOK stock is 7.09% volatile and has beta coefficient of 1.51. Track THOMAS COOK (INDIA) LTD. stock price on the chart and check out the list of the most volatile stocks — is THOMAS COOK (INDIA) LTD. there?
Today THOMAS COOK (INDIA) LTD. has the market capitalization of 74.71 B, it has decreased by −1.98% over the last week.
Yes, you can track THOMAS COOK (INDIA) LTD. financials in yearly and quarterly reports right on TradingView.
THOMAS COOK (INDIA) LTD. is going to release the next earnings report on Nov 7, 2025. Keep track of upcoming events with our Earnings Calendar.
THOMASCOOK net income for the last quarter is 720.50 M INR, while the quarter before that showed 645.70 M INR of net income which accounts for 11.58% change. Track more THOMAS COOK (INDIA) LTD. financial stats to get the full picture.
Yes, THOMASCOOK dividends are paid annually. The last dividend per share was 0.60 INR. As of today, Dividend Yield (TTM)% is 0.37%. Tracking THOMAS COOK (INDIA) LTD. dividends might help you take more informed decisions.
THOMAS COOK (INDIA) LTD. dividend yield was 0.33% in 2024, and payout ratio reached 8.24%. The year before the numbers were 0.36% and 10.77% correspondingly. See high-dividend stocks and find more opportunities for your portfolio.
EBITDA measures a company's operating performance, its growth signifies an improvement in the efficiency of a company. THOMAS COOK (INDIA) LTD. EBITDA is 4.68 B INR, and current EBITDA margin is 5.80%. See more stats in THOMAS COOK (INDIA) LTD. financial statements.
Like other stocks, THOMASCOOK shares are traded on stock exchanges, e.g. Nasdaq, Nyse, Euronext, and the easiest way to buy them is through an online stock broker. To do this, you need to open an account and follow a broker's procedures, then start trading. You can trade THOMAS COOK (INDIA) LTD. stock right from TradingView charts — choose your broker and connect to your account.
Investing in stocks requires a comprehensive research: you should carefully study all the available data, e.g. company's financials, related news, and its technical analysis. So THOMAS COOK (INDIA) LTD. technincal analysis shows the sell today, and its 1 week rating is neutral. Since market conditions are prone to changes, it's worth looking a bit further into the future — according to the 1 month rating THOMAS COOK (INDIA) LTD. stock shows the neutral signal. See more of THOMAS COOK (INDIA) LTD. technicals for a more comprehensive analysis.
If you're still not sure, try looking for inspiration in our curated watchlists.
If you're still not sure, try looking for inspiration in our curated watchlists.