Bitcoin - Blue Skies, Retest Before $125k?Bitcoin has pushed into blue skies after breaking through a major resistance zone around 110,000 USD. The breakout was sharp and impulsive, pushing price well into uncharted territory above 117,000. At these levels, traditional resistance becomes harder to pinpoint, and the market often behaves irra
Key facts today
Key stats
About Bitcoin
Bitcoin is the world’s most traded cryptocurrency, and represents the largest piece of the crypto market pie. It was the first digital coin and as such, remains the most famous and widely-adopted cryptocurrency in the world. It's the original gangster in whose footsteps all other coins follow. The birth of Bitcoin was the genesis of an entirely new asset class, and a huge step away from traditional, centrally controlled money. Today, many advocates believe Bitcoin will facilitate the next stage for the global financial system, although this — of course — remains to be seen.
Related pairs

BITCOIN- MONSTER ORDERS IN THE BOOK -> You Know What This Means COINBASE:BTCUSD “Monster orders” are exceptionally large buy-limit orders clustered roughly 7 % beneath the current market price.
Large buy-limit walls can act like a price magnet—deep liquidity attracts algos and traders hunting fills, often pulling price straight toward the level.
Once the wall

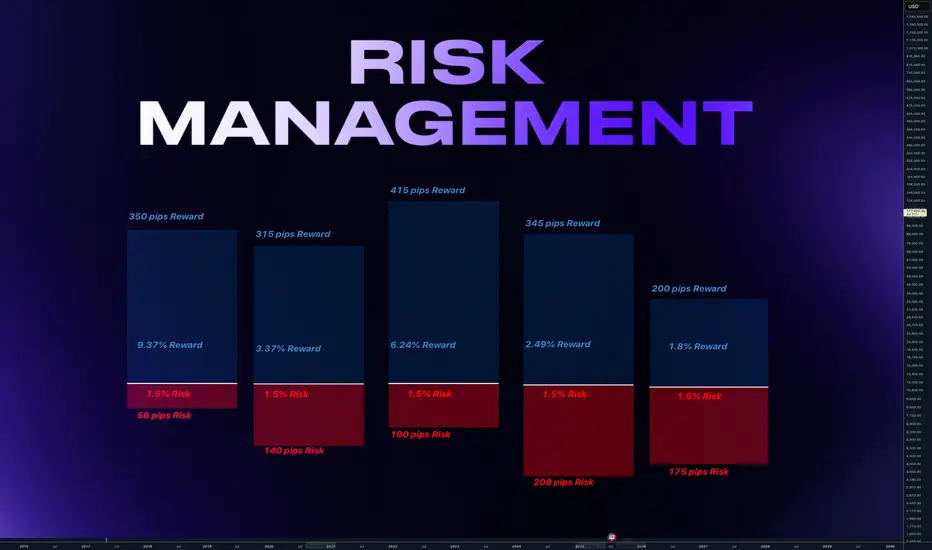
Why Risk Management Is Your Only Real Superpower in TradingMany traders obsess over entries, indicators, or finding the “perfect” strategy…
But the real longevity in this game comes from how you manage risk — not how often you’re right. Obviously it all starts with using stop loss. I hope you already know it. We all learned lessons in trying to enter the to
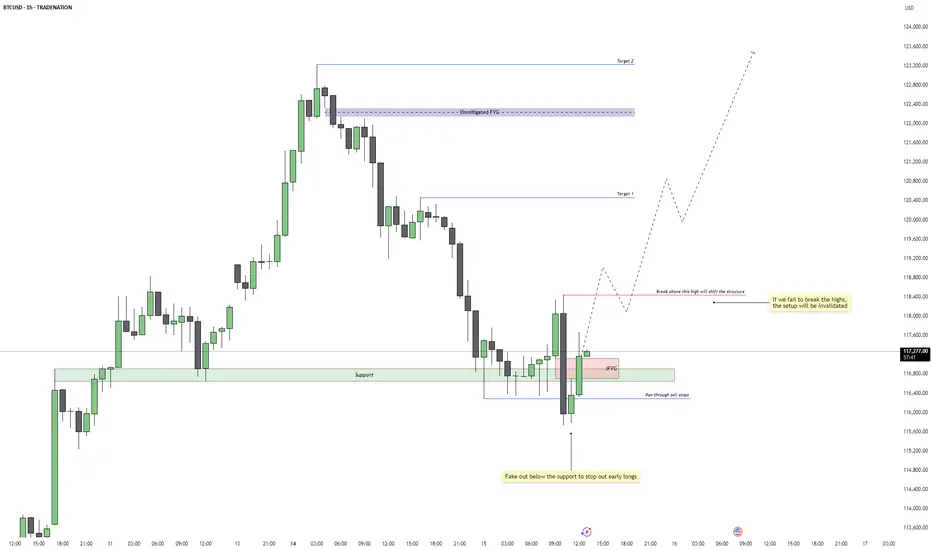
Bitcoin - Reversal Setup or Just a Trap Reset?Price faked below the 1H support zone around 115,800, triggering a clean run through resting sell stops. This classic liquidity sweep flushed out early long positions before immediately reclaiming the range. The move aggressively filled a prior imbalance and flipped sentiment just when it seemed the
Bitcoin Skyrockets as Everyone Now Wants a Piece. What Happened?If you took a few days off last week and went to get coffee this morning, you likely missed Bitcoin torching its all-time high and soaring into the uncharted.
The world’s most popular digital asset took off in an unstoppable rocket ride, smashing records so fast that even the always-wired-in day t

Bitcoin may make correction movement to support levelHello traders, I want share with you my opinion about Bitcoin. Price recently printed a new ATH at 118800 points and then began to show signs of correction. Before this breakout, the price was stuck in a long downward channel, where it bounced inside the buyer zone (103000–103800) several times and

Bitcoin – Rising channel with critical support at $119.000!The chart presented shows Bitcoin in a well-defined rising channel, highlighting a strong bullish momentum over recent trading sessions.
Rising channel
The price action is currently oscillating within the boundaries of this upward sloping channel, marked by parallel trendlines. The channel sugge

Understanding Elliott Wave Theory with BTC/USDIntroduction to Elliott Wave Theory:
Elliott Wave Theory is a popular method of technical analysis that seeks to predict the future price movement of financial markets. Developed by Ralph Nelson Elliott in the 1930s, the theory is based on the idea that market movements follow a repetitive pattern,

Bitcoin - V-shape recovery down towards the 4h FVG at $111.000?The move began with a strong rally that peaked near the $123,000 level. After hitting that high, Bitcoin quickly reversed and sold off aggressively, forming a classic V-shaped pattern. This type of formation typically indicates a strong shift in momentum, where bullish control is quickly overtaken b

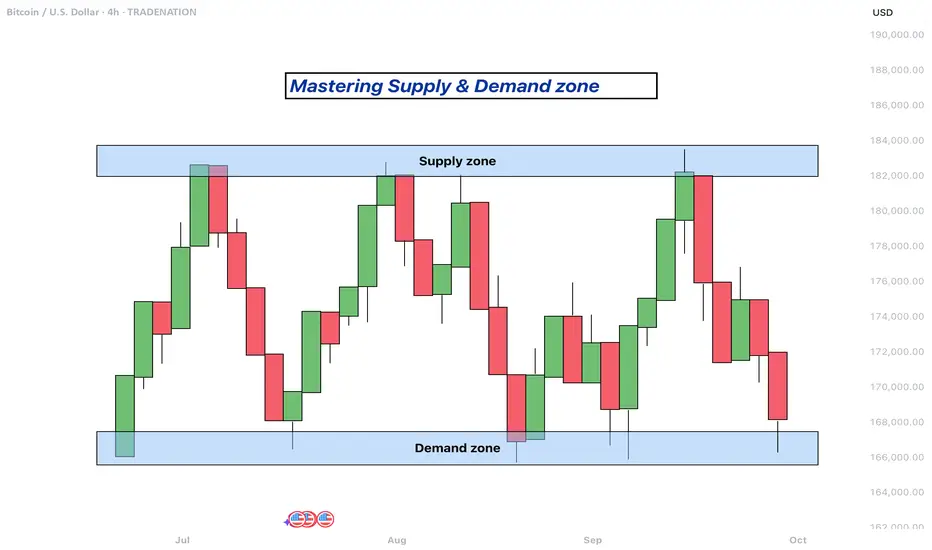
Mastering supply and demand zones - how to use it in trading?Supply and demand zones are key concepts in technical analysis used by traders to identify potential price reversal areas on a chart. They are based on the idea that prices move due to an imbalance between buyers (demand) and sellers (supply).
-------------------------
What will be discussed?
-
See all ideas
Displays a symbol's price movements over previous years to identify recurring trends.
Curated watchlists where BTCUSD is featured.

Gen 1 crypto: from little acorns grow
15 No. of Symbols

Proof of Work: Embracing the crunch
27 No. of Symbols
See all sparks
Discover funds exposed to Bitcoin and find another way to access the coin.
Frequently Asked Questions
Bitcoin (BTC) reached its highest price on Jul 11, 2025 — it amounted to 118,908.00 USD. Find more insights on the BTC price chart.
See the list of crypto gainers and choose what best fits your strategy.
See the list of crypto gainers and choose what best fits your strategy.
Bitcoin (BTC) reached the lowest price of 159.68 USD on Jan 14, 2015. View more Bitcoin dynamics on the price chart.
See the list of crypto losers to find unexpected opportunities.
See the list of crypto losers to find unexpected opportunities.
The safest choice when buying BTC is to go to a well-known crypto exchange. Some of the popular names are Binance, Coinbase, Kraken. But you'll have to find a reliable broker and create an account first. You can trade BTC right from TradingView charts — just choose a broker and connect to your account.
You can discuss Bitcoin (BTC) with other users in our public chats, Minds or in the comments to Ideas.