Bitcoin - The ultimate breakdown for 2025/2026Welcome to my channel and this analysis. In this analysis I will dive deep in the current Bitcoin’s bullmarket. I will examine charts from the monthly, weekly, daily and 4H charts, and also on chain data. This will be a complete insight in Bitcoin’s price.
------------------------
Monthly timeframe
Logarithmic BTC chart
This chart presents a long-term logarithmic analysis of Bitcoin using monthly candles, covering the period from around 2013 to mid-2025. The structure is defined by two major curved lines representing a logarithmic resistance and support channel, which frames Bitcoin's price movement over more than a decade. These lines form a dynamic, upward-sloping price corridor, capturing Bitcoin's historically exponential price behavior and cyclical nature. The vertical axis uses a logarithmic scale to better reflect percentage-based changes, which is critical when analyzing an asset like Bitcoin that has grown from under $100 to over $100,000 in just a few years.
The chart displays clear multi-year cycles. The first notable cycle begins in 2013, followed by a significant correction in 2014–2015. A new bullish phase emerges between 2016 and 2018, peaking near $20,000. This is followed by a crash into 2018. A longer accumulation period precedes the 2020–2021 rally, which reaches a high around $69,000 before another sharp decline. From the bottom in late 2022 or early 2023, Bitcoin begins another uptrend, forming a steep rise along a newly established bullmarket support trendline. This trendline represents a more aggressive, linear support structure within the broader logarithmic curve, showing the strong momentum driving the current bull phase.
By July 2025, Bitcoin is trading around $108,000, advancing steadily toward the upper boundary of the long-term logarithmic resistance. A key element of this chart is the target level marked at approximately $150,000, which aligns closely with the point where the current trajectory intersects the upper logarithmic resistance. This zone has been highlighted as a likely area of interest, possibly signaling a market top or at least significant resistance, based on Bitcoin's past behavior. Historically, Bitcoin has tended to reverse sharply or consolidate after reaching this upper boundary, making the target zone an area of potential distribution or heightened volatility.
The bullmarket support trendline serves as a short- to medium-term structure within the larger logarithmic channel. As long as price holds above this line, the current bullish structure remains intact. A breakdown below this trendline could indicate a loss of momentum and trigger a broader correction.
The use of logarithmic trendlines underscores Bitcoin’s tendency to move in exponential growth cycles, shaped by macroeconomic trends, halving events, and adoption waves. The resistance and support boundaries function as dynamic guides for long-term expectations rather than rigid barriers.
The stoch RSI crosses
This chart provides a technical overview of Bitcoin on a monthly timeframe using candlestick analysis and the Stochastic RSI (Stoch RSI) oscillator to distinguish between bull and bear market phases. The Stochastic RSI, shown at the bottom of the chart, is a momentum oscillator derived from the RSI rather than price directly, making it particularly useful for identifying overbought and oversold conditions in trending markets. The key thresholds are the 80 level at the top and the 20 level at the bottom, which respectively indicate overbought and oversold zones.
The chart spans from 2017 to mid-2025, clearly separating bull and bear markets using vertical red lines and labeled annotations. Each major cycle aligns with movements in the Stoch RSI indicator. Notably, crosses above the 80 line (into overbought territory) are often associated with late-stage bull market tops or strong bullish continuations. Crosses below the 20 line (into oversold territory) typically align with bear market bottoms or the start of new accumulation phases.
Starting with the December 2017 peak, the Stoch RSI crossed above the 80 level, reaching extreme overbought territory. This cross occurred at the height of that bull cycle, signaling a likely exhaustion of momentum. Not long after this peak, the market entered a bear phase, confirmed by the downward cross of the Stoch RSI below the 80 level, and eventually below 20, leading into the 2018–2019 bear market.
By August 2019, the Stoch RSI crossed below the 20 level, signaling oversold conditions. Although this did not immediately launch a new bull market, it did suggest the market was bottoming out. This was followed by a gradual recovery and another decisive upward cross above 80 around April 2021, right in the midst of the strong 2020–2021 bull run. That cross confirmed the continuation of upward momentum and coincided with Bitcoin reaching new all-time highs.
As the price peaked in late 2021 and early 2022, the Stoch RSI again turned downward and dropped below the 20 threshold, marking another prolonged bear market. This downtrend was confirmed as the oscillator remained suppressed in the oversold zone for most of 2022.
The Stoch RSI is now moving again towards the overbought territory. This means that bulls have the control in the market and likely to push higher.
RSI with the consolidation and resistance trendline
This chart presents a broader monthly view of Bitcoin's price action alongside the Relative Strength Index (RSI), revealing a compelling structural alignment between price momentum and long-term resistance dynamics.
At the top of the chart, the candlestick pattern shows a clear upward trend spanning across multiple market cycles. A long-term resistance trendline has been drawn that connects the major highs from the two previous bull markets, specifically the peaks in late 2017 and late 2021. This resistance line acts as an upper boundary to the macro trend and, so far, the current price action in 2025 has not yet tested this long-term resistance. In fact, while Bitcoin has recently reached above $100,000, it remains below the ascending resistance trendline, suggesting that there could still be room for price to move higher before encountering the next major overhead challenge. The structure implies a potential upward continuation if momentum sustains, and the price may attempt to test this historical trendline in the near future.
Below the price chart, the RSI indicator offers additional insight into the underlying strength of this move. A descending RSI trendline connects the previous overbought peaks from 2017 and 2021, forming a macro resistance trendline in momentum that mirrors the structure seen in price. This declining RSI resistance has not yet been reached in the current cycle, implying that momentum still has space to grow before hitting a potential exhaustion point. The RSI is currently capped within a relatively tight consolidation box, with values fluctuating between the mid-60s and low-70s.
200W SMA crosses above the previous ATH
This chart illustrates the long-term price action of Bitcoin, focusing on the relationship between the 200-week simple moving average (SMA) and previous all-time highs (ATHs). Historically, when the 200-week SMA crosses above the previous cycle’s ATH, it has coincided with periods near the cycle tops. For example, in December 2017 and January 2022, the 200-week SMA moved above the prior ATH, which closely aligned with significant market peaks.
In the current cycle, however, the 200-week SMA has not yet crossed above the previous ATH from 2021, which is around $68,889.04. This is notable because, in past cycles, this crossover has typically marked the later stages of a bull run. The fact that this crossover has not yet occurred suggests that Bitcoin may still have room to move higher before reaching a new cycle top. However, it is important to recognize that this does not guarantee further upward movement. Even if Bitcoin’s price consolidates or moves sideways for an extended period, the 200-week SMA will gradually rise due to its lagging nature and could eventually cross above the previous ATH without a significant price rally.
Lets now move to the weekly charts and analyse where we are.
------------------------
Weekly timeframe
Support and resistance trendlines
This chart shows Bitcoin’s price action on a weekly timeframe, highlighting three key trendlines. Two resistance trendlines are drawn from the peaks of the last two major cycles, forming an upper boundary for price action. These lines act as potential resistance zones, indicating areas where previous rallies have topped out and where the current price could face selling pressure if it approaches these levels again.
Additionally, there is a clearly defined rising trendline that serves as bull market support. This trendline has been respected throughout the current cycle, connecting the higher lows since the market bottomed out in late 2022. As long as Bitcoin’s price continues to hold above this bull market support trendline, the overall bullish structure remains intact. This suggests that the uptrend is still healthy and that corrections or pullbacks, as long as they stay above this line, are part of a normal, sustainable bull market. If the price were to break below this support, it could signal a shift in market sentiment and potentially a deeper correction. For now, maintaining support on this trendline is a positive sign for the ongoing bull market.
Bearish divergence
The chart shows that Bitcoin has formed three consecutive price peaks, with each new high surpassing the previous one. This indicates that, from a price perspective, the market has maintained its upward momentum over this period. However, when looking at the Relative Strength Index (RSI) below the price chart, a different pattern emerges. Each time the price has made a new high, the RSI has registered a lower high, resulting in a clear bearish divergence. This is visually reinforced by the downsloping trendline that can be drawn across the RSI highs, in contrast to the uptrend in price.
Bearish divergence between price and RSI, as seen here, often signals underlying weakness in the buying momentum, even as price continues to rise. It suggests that each successive rally is being driven by less enthusiasm or participation from buyers. Given this setup, it is possible that the RSI could revisit the downsloping trendline in the near future. If this occurs, the price might make a marginally higher high, potentially forming a third peak slightly above the current level. This would maintain the divergence and could act as a warning sign for traders to be cautious about the sustainability of the current uptrend.
Stoch RSI
This chart presents the weekly price action of Bitcoin alongside the Stochastic RSI indicator. What stands out is the clear cyclical pattern in the Stoch RSI, where it tends to reach oversold levels roughly once every half year. These oversold readings have historically aligned with significant local bottoms in the price, signaling favorable buying opportunities for traders and investors. After reaching these low points, the Stoch RSI typically trends upward, eventually entering the overbought zone.
When the Stoch RSI enters overbought territory, as it does several times on this chart, it often coincides with local price peaks. These moments serve as warnings that the market may be overheated in the short term, and traders should be cautious about opening new long positions. The overbought readings suggest that a pullback or period of consolidation could be imminent, as the market works off excess bullish momentum.
Currently, the Stoch RSI is once again in the overbought zone. This suggests that Bitcoin may be vulnerable to a further pullback or at least a pause in its upward movement. While this does not guarantee an immediate reversal, it does mean that risk is elevated.
Failed breakout/liquidity grab
This weekly Bitcoin chart illustrates a strong and consistent uptrend that has been developing since late 2023. Each major move begins with a clear breakout above previous consolidation zones, followed by a retest of the broken resistance, which then acts as support, confirming the trend's strength. These retests tend to hold well, setting up for new bullish impulses.
In the earlier stages, we see BTC breaking out of a range around the $48,851 support level. After a successful retest of that zone, the price surged and entered a new consolidation phase just below $73,643. A second breakout occurred from this level, again followed by a retest that confirmed it as a new support level. This pattern reflects textbook bullish market structure: breakout, retest, and continuation.
However, the current price action shows something different. BTC has returned to its previous high around the $109,301 resistance level. Unlike the previous times, where strong bullish candles closed above resistance, this attempt has only pierced above the level with a wick, indicating potential exhaustion or hesitation. The highlighted label "Failed breakouts / Liquidity grab" suggests that these wick movements may have been attempts to trigger stop orders and gather liquidity before a possible retracement.
Now we will dive deep into the daily timeframe.
------------------------
Daily timeframe
Resistance, bullflag and Stoch RSI
This daily chart of Bitcoin reveals a period of consolidation just below a key resistance zone, which aligns with the previous all-time high area. BTC has been ranging within this red-marked resistance block, showing clear hesitation from buyers to push beyond it with conviction.
During this consolidation, a well-formed bull flag structure appeared, a bullish continuation pattern, signaling potential for further upside. The breakout from this bull flag occurred earlier this week, providing initial bullish confirmation as price pushed briefly above the upper boundary of the flag. However, the breakout lacked follow-through. Instead of sustaining momentum and closing decisively above resistance, BTC appears to have experienced a fake-out, with price now retracing back inside the prior range.
This failed breakout is particularly notable given the context of the Stochastic RSI indicator, which is currently in the overbought zone.
------------------------
4H timeframe
4H FVG and liquidity grab
This 4-hour chart of Bitcoin shows a clear structure where price has recently formed an equal high around the $110,612 level. Equal highs are often seen as zones where liquidity builds up, since many stop-loss orders from short positions typically rest just above them. This makes the area particularly attractive for a potential liquidity grab.
At the moment, BTC appears to be in a short-term retracement phase after rejecting from this equal high region. During this move, price left behind a bullish Fair Value Gap (FVG), which is a zone of inefficiency where price moved too quickly to fill orders. This FVG is now acting as a potential support zone. The chart suggests that BTC may revisit this FVG to rebalance before making another attempt to break through the equal highs.
If BTC can hold the FVG and generate upward momentum, a move above the equal highs becomes more likely. In that case, the resting liquidity just above those highs could be targeted, leading to a quick wick or breakout move before price potentially reverses again.
------------------------
Liquidation heatmap
1 month
This Binance BTC/USDT liquidation heatmap clearly shows that the majority of the liquidity is stacked to the upside. The bright yellow and green bands, which represent areas of high liquidation potential and leverage exposure, are heavily concentrated just above the current price levels, especially around the $111,000 to $114,000 zone. This indicates that many traders have short positions with stop-losses placed above these highs, making them prime targets for potential liquidation events.
As price moves closer to these high-liquidity zones, the probability increases that market participants, particularly larger players or algorithms, may push BTC upwards to trigger those stops and liquidate those positions.
1 week
The current price is hovering around the $108,000 range, with clear liquidity clusters forming both below and above this level. What stands out is the dense liquidation zone just below the current price, this suggests that many traders have placed long positions with stop-losses slightly under this support range. These positions create an opportunity for a liquidity sweep, where price briefly dips down to trigger liquidations, fill larger buy orders, and shake out weaker hands.
After such a sweep, the heatmap shows an even larger cluster of liquidation liquidity sitting just above the highs, especially around the $110,000 to $114,000 region. This is likely composed of stop-losses from short positions and breakout traders who entered too early. The concentration of liquidity here creates a strong incentive for price to target this zone after clearing the downside liquidity.
------------------------
Fear and greed index
Today
The Fear and greed today is at 66, meaning greed. This level suggests that market sentiment is optimistic, but not yet euphoric or irrational. In practice, it often means buyers are confident, and there’s still room for price continuation before we enter extreme greed territory
1 year chart
This chart displays the Crypto Fear & Greed Index over time, offering a visual representation of sentiment cycles in the Bitcoin market.
When examining the past year, you can see how sentiment has recovered significantly from the fear zone (below 30), especially from late 2024 into early 2025. This shift in sentiment aligned with BTC's price climbing back toward previous highs, indicating that sentiment is responding directly to price structure and bullish momentum.
------------------------
BTC exchange reserve
This chart, sourced from CryptoQuant, provides a clear visualization of the relationship between Bitcoin’s exchange reserves (blue line) and BTC price (white line), over a multi-year period. The key insight is the rapid and consistent decline in Bitcoin held on exchanges, especially noticeable from mid-2023 onward.
From around 2022, the amount of BTC on exchanges remained relatively stable. However, beginning in late 2022 and accelerating through 2023 into 2025, we see a shart and uninterrupted drop in exchange reserves.
This ongoing withdrawal trend typically signals accumulation behavior by investors. When BTC is withdrawn from exchanges and moved into cold storage or long-term wallets, it often reflects growing conviction among holders that price will rise and they don’t intend to sell in the short term.
------------------------
Final thoughts
This is a complete Bitcoin analysis for the community with a top-down analysis!
I have worked out a complete insight in the Bitcoin price with different analysis and on-chain data.
I would be excited if you boost, comment and share the analysis with your friends for the work that I have put in this analysis for everyone.
BTCUSD trade ideas

21D $BTC pattern to watchWanted to show a pattern I was looking at and analyzing the 21D (a fib number) and see the fib extensions match up on each breakout.
A tad confusing I know, but hope the visual helps.
Fibo

War , Bitcoin , and the Myth of Safe Havens...Hello Traders 🐺
"You think Bitcoin is digital gold? Wait until the bombs drop."
Everyone talks about Bitcoin as a hedge. A hedge against inflation. Against fiat. Against banking failures.
But let me ask you this:
Is Bitcoin a hedge against war?
I’m not here to give you a yes or no. I’m here to make you uncomfortable —
Because if you think BTC always pumps when chaos hits,
you're trading dreams, not reality.
Let’s dissect this. No fluff.
⚔️ 1. Real Wars. Real Charts.
Let’s test your assumptions against actual history:
Feb 2022 (Ukraine invaded):
BTC dumps hard. Then... recovers.
Was it a hedge? Or just the market gasping for liquidity?
Oct 2023 (Middle East escalates):
BTC spikes. Why?
Was it fear of fiat instability? Or just algo-driven momentum?
April 2024 (Hormuz Strait tensions):
Whipsaws. No clear direction.
So again: what exactly is BTC reacting to?
👉 Are you reading price? Or just feeding a narrative you want to believe?
🧠 2. Bitcoin = Fear Thermometer?
In war, people flee. Banks freeze. Censorship rises. Panic spreads.
Some run to gold.
Some run to the dollar.
A few... run to BTC.
But don’t forget:
Most retail investors panic sell. Institutions vanish. Liquidity dies.
So here’s the punchline:
BTC isn't a safe haven.
It's a sentiment mirror — brutally honest and totally unstable.
Still wanna call it "digital gold"?
💣 3. War Doesn’t Create Trends. It Exposes Bias.
Most of you are trying to fit BTC’s price into a geopolitical event.
Wrong approach.
You should be asking:
What kind of war is this?
Does it shake the dollar?
Does it cause capital controls?
Does it threaten global liquidity?
BTC doesn’t care about explosions.
It cares about trust.
Break trust in fiat? BTC might thrive.
Spike short-term fear? BTC might collapse.
Simple enough?
📉 4. The Hard Truth: Most of You Can’t Read War
No offense — but most retail traders don’t understand geopolitics.
They just look at headlines and wait for a green candle.
So here’s your challenge:
Next time war breaks out, ask yourself:
“Is this bullish for BTC — or just loud?”
Be honest. Don’t just copy Twitter takes.
🔍 5. If You're Long BTC Because of War — You Better Know Why.
BTC might go up.
BTC might tank.
But if your reason is just “the world is collapsing” —
you’re gambling, not investing.
Ask the deeper questions:
Are people losing faith in centralized systems?
Are borders tightening?
Are currencies being weaponized?
BTC shines only when sovereignty collapses.
Not just when missiles fly.
🧠 Final Thoughts
War doesn't pump BTC.
Distrust does.
Learn the difference — or keep trading headlines.
💬 Your move.
Would you hold Bitcoin during a war?
Why?
Drop the cliché answers. Give me logic.
👇 Let’s debate.

This looks eerily similar to last cycle top. just sayinLast cycle top and this cycle look identical from this angle. Its going to be hard to push through this top and make a new ATH in my opinion. the more the cycle looks the same, the more fear, and more dump. Self fullfilling prophecy here.

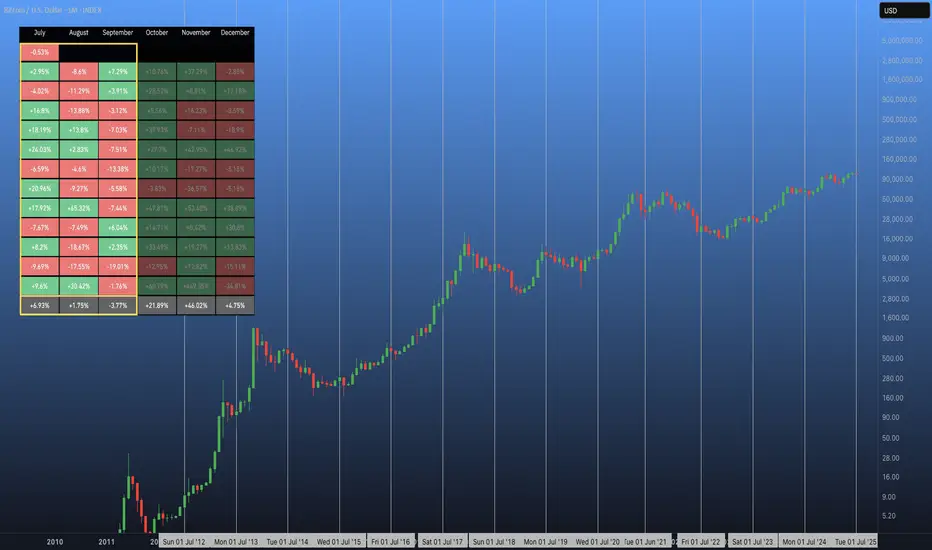
Did you know that even Bitcoin has seasonality? It's July 1st – the first day of Q3! 🫡
Did you know that even #Bitcoin has seasonality?
For example, the most profitable months of the year tend to be in winter. ❄️
👀 Historically, the strongest rallies have happened in Q4, while Q3 is usually the slowest — it's vacation time, good weather, school holidays, etc.
That said, July has historically been the most profitable month of Q3, and the S&P500 has closed every July green for 10 straight years — which could also be a positive signal for #BTC. 🤞
As I mentioned last week, we saw a small reaction from resistance and a local pullback on LTF… 📉
But after two months of consolidation, the odds of a breakout to the upside look really good! 🚀
15 min diamond reversal15 minuet chart also confirms a reversal conformation to the v on previous published chart on btc

btc 90 days within each box for each 90 day time frame there are always 2 significant swing low within that box.

Bitcoin Final Push: Cycle Top in Sight?Historically, the final two quarters of a Bitcoin cycle, especially in post-halving years, have shown strong bullish trends. This pattern played out in 2013, 2017, and 2021, where Q3 and Q4 delivered significant gains leading into cycle tops. With 2025 being the post-halving year and Q2 already showing strong performance, we may be setting up for a similar rally in Q3 and Q4 if history repeats.
CRYPTOCAP:BTC BITSTAMP:BTCUSD

Bull Trap, Backtest in routeIMO, theres needs to be a backtest into the 0.5fib, maybe 0.618fib territory to completye the 'spring' in wyckoff.
MSM FUD: WW3 Narrrative??
Great long positions about to open up.

#btc #btcusd #elliottwave short sell setup wave 4 7Jul25This count is based on my assumptions so anything can happen not a trading or financial advice just for educational purposes only kindly do your own ta thanks trade with care good luck.

CRYPTO - 20 Minute TAHere's a 20 minute TA.
Quite a complex area - enjoy 👍.
This analysis is shared for educational purposes only and does not constitute financial advice. Please conduct your own research before making any trading decisions.

Pi Cycle Top Risk (PCTR) at the mid-point for Bitcoin (BTC)The PCTR indicator is only just at the midpoint for BTC. We have a significant amount of time left in this bull market according to this indicator. There will be pullbacks, but the PTCR says we have room to continue to the upside in this cycle.

BITCOIN, what's the trend in July?Geopolitical calm, optimism about trade diplomacy, anticipation of a rate cut by the FED - a trio that helped the global equity market set a new all-time record and produced a positive correlation effect on the bitcoin price. Can the trend remain bullish until the end of July?
1) Global liquidity still underpins bitcoin's upward momentum
An often underestimated driving force continues to influence bitcoin's evolution: the global M2 monetary aggregate, which maintains a close, positive correlation with the price of the digital asset. This indicator, which aggregates the money supply of the major economies converted into US dollars, generally acts on bitcoin with an average lag of around 12 weeks. The latest statistics show a new all-time high for this global liquidity. This factor is helping to sustain the upward trend observed since April, despite a complex fundamental context marked by a Federal Reserve determined to maintain a restrictive monetary policy in the short term.
The US dollar, by strengthening or weakening, directly modifies the total value of M2 expressed in dollars. This contributes to the extent of global liquidity and, consequently, to bitcoin's evolution.
2) A bullish continuation technical configuration in formation
On the chart, bitcoin's trend has been marked by a sustained advance for several months. Chartist analysis suggests that a bullish continuation flag may be in the making. If this pattern is confirmed by a clear breakout above the all-time high, theoretical projections place the next targets between $128,000 and $145,000. The dynamics of the daily candlesticks on BTC/USD testify to a market that remains positively oriented, provided that the 98,000/100,000 US dollar support zone is preserved.
3) The four-year halving cycle still active
To place this development in a longer-term context, it is worth recalling the four-year cycle structured around halving. The last halving event took place in April 2024, initiating a new bullish phase that should continue until autumn 2025 if historical regularities repeat themselves. Bitcoin therefore has several months left to set new records, even if episodes of volatility cannot be ruled out.
Temporal analyses show that the terminal phase of this cycle is expected between October and December 2025. This outlook gives the trend time to develop, even if the summer period should see the development of a short-term correction.
4) Outlook for July
Since the spring, bitcoin has been on an upward trend, which has its roots in both the technical configuration and the unprecedented scale of global liquidity. The combination of these factors has created an environment conducive to continued bullishness over the summer, even if the market will have to contend with geopolitical and trade tensions, as well as the firmness of the FED, which is unlikely to cut rates before September.
CAUTION: a technical break of the $100K support would put an end to the uptrend in place since the beginning of April.
DISCLAIMER:
This content is intended for individuals who are familiar with financial markets and instruments and is for information purposes only. The presented idea (including market commentary, market data and observations) is not a work product of any research department of Swissquote or its affiliates. This material is intended to highlight market action and does not constitute investment, legal or tax advice. If you are a retail investor or lack experience in trading complex financial products, it is advisable to seek professional advice from licensed advisor before making any financial decisions.
This content is not intended to manipulate the market or encourage any specific financial behavior.
Swissquote makes no representation or warranty as to the quality, completeness, accuracy, comprehensiveness or non-infringement of such content. The views expressed are those of the consultant and are provided for educational purposes only. Any information provided relating to a product or market should not be construed as recommending an investment strategy or transaction. Past performance is not a guarantee of future results.
Swissquote and its employees and representatives shall in no event be held liable for any damages or losses arising directly or indirectly from decisions made on the basis of this content.
The use of any third-party brands or trademarks is for information only and does not imply endorsement by Swissquote, or that the trademark owner has authorised Swissquote to promote its products or services.
Swissquote is the marketing brand for the activities of Swissquote Bank Ltd (Switzerland) regulated by FINMA, Swissquote Capital Markets Limited regulated by CySEC (Cyprus), Swissquote Bank Europe SA (Luxembourg) regulated by the CSSF, Swissquote Ltd (UK) regulated by the FCA, Swissquote Financial Services (Malta) Ltd regulated by the Malta Financial Services Authority, Swissquote MEA Ltd. (UAE) regulated by the Dubai Financial Services Authority, Swissquote Pte Ltd (Singapore) regulated by the Monetary Authority of Singapore, Swissquote Asia Limited (Hong Kong) licensed by the Hong Kong Securities and Futures Commission (SFC) and Swissquote South Africa (Pty) Ltd supervised by the FSCA.
Products and services of Swissquote are only intended for those permitted to receive them under local law.
All investments carry a degree of risk. The risk of loss in trading or holding financial instruments can be substantial. The value of financial instruments, including but not limited to stocks, bonds, cryptocurrencies, and other assets, can fluctuate both upwards and downwards. There is a significant risk of financial loss when buying, selling, holding, staking, or investing in these instruments. SQBE makes no recommendations regarding any specific investment, transaction, or the use of any particular investment strategy.
CFDs are complex instruments and come with a high risk of losing money rapidly due to leverage. The vast majority of retail client accounts suffer capital losses when trading in CFDs. You should consider whether you understand how CFDs work and whether you can afford to take the high risk of losing your money.
Digital Assets are unregulated in most countries and consumer protection rules may not apply. As highly volatile speculative investments, Digital Assets are not suitable for investors without a high-risk tolerance. Make sure you understand each Digital Asset before you trade.
Cryptocurrencies are not considered legal tender in some jurisdictions and are subject to regulatory uncertainties.
The use of Internet-based systems can involve high risks, including, but not limited to, fraud, cyber-attacks, network and communication failures, as well as identity theft and phishing attacks related to crypto-assets.

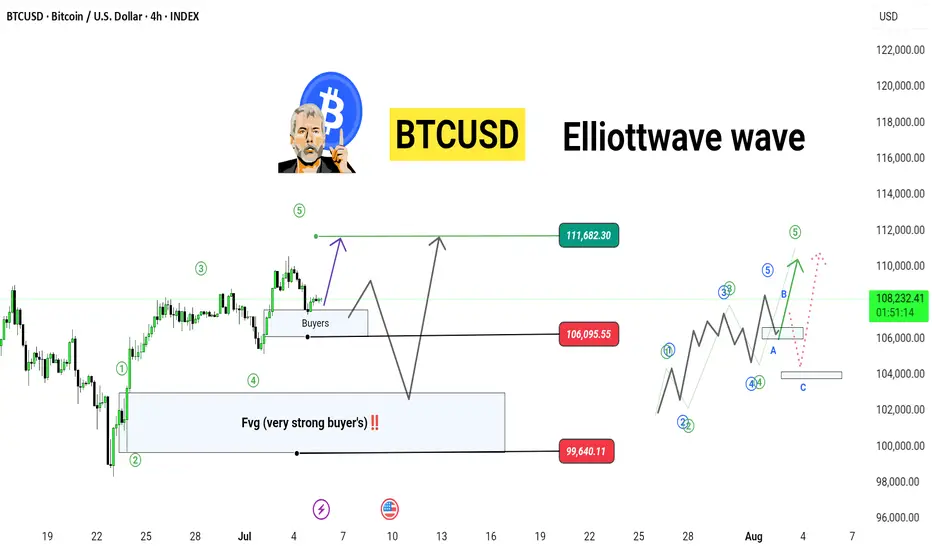
BTCUSD ||4h. ( Elliott Wave + SMC Analysis”)
“BTCUSD is Setting Up for a Powerful Wave 5 Rally! 🚀 | Elliott Wave + SMC Analysis”
---
📊 Optimized :
> 📈 Bitcoin (BTCUSD) 4H Elliott Wave Forecast
BTC is currently forming a classic Elliott Wave 5 setup after completing a clean 1-2-3-4 sequence, supported by strong Smart Money Concepts (SMC) zones!
We’re now at a critical decision point — will bulls push to 111,682 or will price revisit the Fair Value Gap (FVG) near 99,640 for re-accumulation?
This chart outlines two potential bullish paths after retracement and the complete ABC correction possibility.
---
🧠 Key Technical Confluences:
✅ Wave 1 to 5 structure forming cleanly
💸 Strong Buyer Zone (FVG) at $99,640
🔁 Correction zone marked for Wave A-B-C retracement
🟢 Premium breakout target: 111,682
🔴 Support zones: 106,095 and 99,640
---
🚀 My Outlook:
If BTC holds above 106K, we may see a sharp continuation to 111K+ as part of Wave 5.
But if smart money needs deeper liquidity, we’ll likely revisit the discount FVG before a major push up.
---
🔍 Tags
#BTCUSD #BitcoinAnalysis #ElliottWave #SmartMoney #FVG #Wave5 #BTCForecast #CryptoTrading
BTI risk is neutral The BTC risk is still at the mid-7s. With a max of 13 on the risk, that means we are still likely far from the cycle top. There are a few indicators that are nearing top signals (NUPL, RP extension, CVDD extension, PDM), but most indicators are far from their top signals. We had a much needed cool down period for BTC to reset some of the overheated indicators.

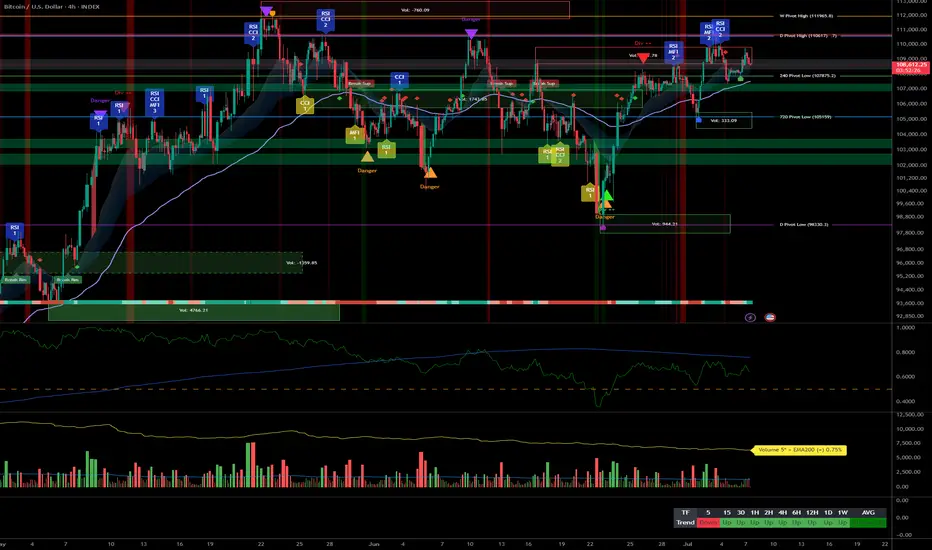
Bitccoin bullish momentum under resistance, key zone at $110k__________________________________________________________________________________
Technical Overview – Summary Points
➤ Momentum: Predominantly bullish on all higher timeframes, momentum slowdown observed on short-term (15min).
➤ Supports/Resistances:
Major resistance: 110,630 – 111,949 (repeated tests on Weekly/Daily pivot high)
Key supports: 107,761 – 106,000 (H4/H12 pivot), weaker pivot zones below 105,054 and 98,133
➤ Volume: Within normal ranges on daily/12H/6H, elevated but not extreme on 15min – potential short-term distribution signal.
➤ Behavioral: No buy/sell climax (ISPD DIV neutral), no panic, Risk On / Risk Off Indicator with strong buy signal up to 1H.
__________________________________________________________________________________
Strategic Summary
➤ Global bias: Mature bullish. Confirmed momentum across timeframes, but caution with short-term timing (frequent traps under resistance).
➤ Opportunities:
Tactical buying on pullback into 107,761–106,000 support zone with confirmed reversal signals (wicks, absorption, incoming volume)
Momentum buying on confirmed break above 110.6–112k, with active stop management below latest pivot
➤ Risk zones:
Invalidation below 105,054, then strong reversal under 98,133
Avoid trading low timeframes if abnormal volume ("liquidity grabs")
➤ Macro catalyst: Few high-impact events expected before FOMC end of July; overall global environment is risk-off but no immediate escalation.
➤ Action plan: “Trend Following” until invalidation, active stop management below key pivots, entries on pullback or clear breakout, flexibility for upside/faulty support.
__________________________________________________________________________________
Multi-Timeframe Analysis
: Strong bullish alignment (“Strong Up”/“Up”), technical support on major pivots 107,761–106,000.
30min : Micro-range compression, recent volume up but no excess – weak immediate opportunity (await breakout or retest of support/pivot zone).
15min : Very high volumes on micro-range, increasing micro-volatility – likely distribution/trap, observation only, no action unless 107.7k support breaks hard.
Risk On / Risk Off Indicator : Strong buy signal daily–1H, neutral on 15min; institutional confidence preserved as long as major range remains intact.
Synthetic summary : BTC market structurally healthy, tactical upside still valid – increased monitoring required for short-term volume flush or first distribution move on key support break.
__________________________________________________________________________________
Strategic bias summary
Mature bullish, low euphoria, institution-driven environment
Prioritize entries on validated support zones, or breakout with agile stop management
Short-term volatility to be handled with care (frequent traps on 5–15min)
__________________________________________________________________________________
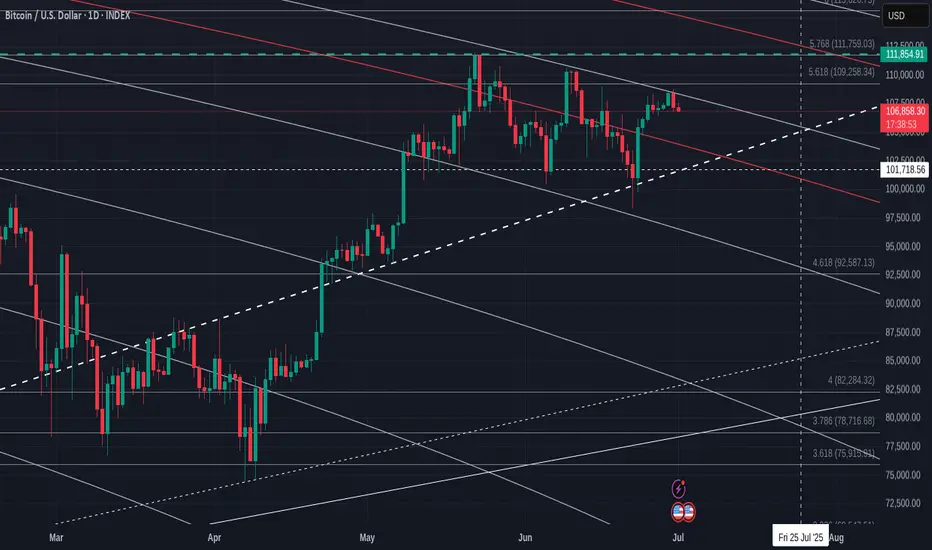
Bitcoin Daily in a large pennant with apex end of July
Bitcoin is once again getting rejected off the Fib circle just above.
This is also just under a 618 Fib extension and so a combined rejection zone.
Beneath this, we have support on that Bold dashed line. This is a Local line of supprt but has strength.
And so, we find outselves in apennant again and that apex is around 22 July.
PA tracts before the apex.
As will be explained in the monthly chart I iwll post later, this all points towards a Calm July, possibly RED month.
PA does however, have the ability and strength to push higher if the Bulls decide to make a move.
The MACD
The Daily MACD is just above Neutral and has enough room to move.
So, if we drop, support is arouns 103K
If we loose that then 100K and then we land on that red 236 Fib circle that will offer a sliding line of support.
But I do not think we will get there just yet
Enjoy
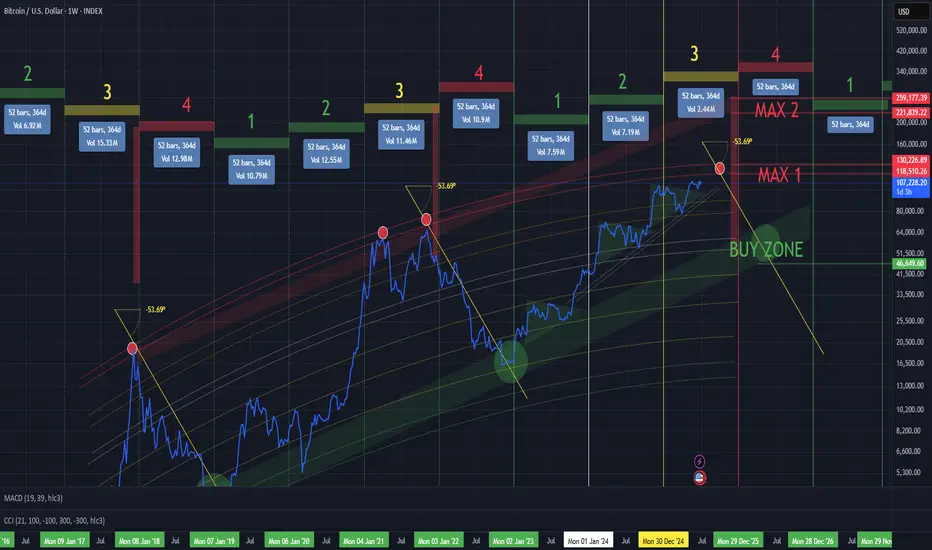
BTC/USD INDEXEach cycle typically spans 4 years. Historically, the cycle peak occurs near the end of year 3, followed by a year-long market downturn in year 4, with the cycle bottom forming closer to the end of that final year.
Based on previous cycles, a reasonable peak for Bitcoin in this cycle would be around $120K–130K, followed by a correction down to the $45K–50K range.
BTC/USD 1h Chart Analysis: BTFDBitcoin is showing a bullish structure on the 1h timeframe with a potential move towards $109,000.
On smaller timeframes, it exhibits a clear "buy the dip" profile.
Key Levels:
$109,000: Potential upside target.
$107,000: Resistance/Support zone to watch for rejection.
$105,000: Low Volume Node (LVN*) a possible good long entry zone.
$102,000 - $100,000: Support levels to monitor if $105,000 fails.
Currently it have bullish trend with a potential dip near $105,000 showing good entry point.

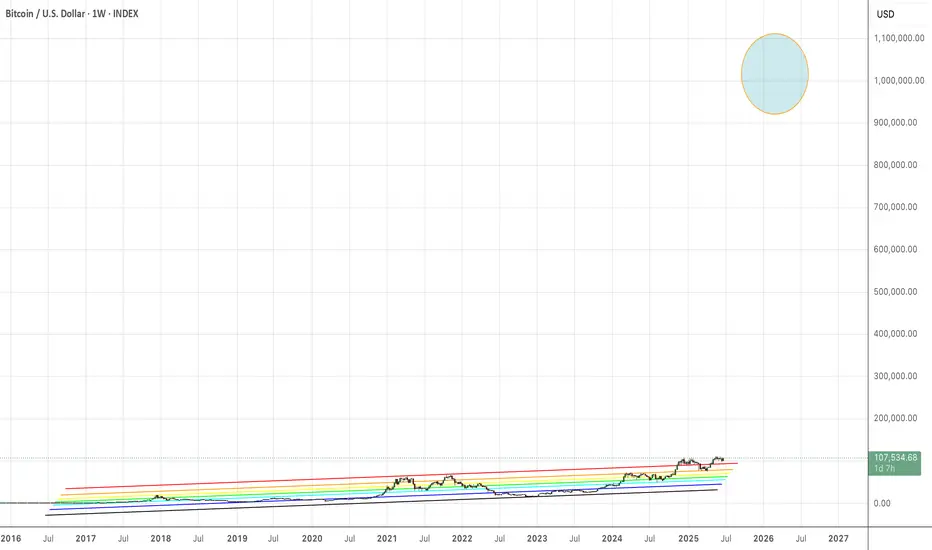
BitcoinThis image shows Bitcoin "all-time" bullish Fibonacci Channel, and it shows a theoretical pump up to $1M USD, based on the "stock-to-flow" model. BTC is way under the stock to flow curve. You can check it yourself. Do some research. "Diminishing-Log-Return" proponents have already been proven foolish. The "shrimp" model was always based on nothing, but old-style adherence to moving-averages and volume, and a supposed adherence to the idiot concept of diminishing log returns. Do you use log to chart in Tradingview? My guess is yes, most of the time, not all of the time, and sometimes linear and log are used together with "snap-to-rays". You use log, so you know that what happens at low price ranges also happens at high price ranges, because it's not about the price range. It's about the "amplitude" of the chart formation. Meaning, how high in % is this ascending triangle? Oh, it 800% "high". Ok, that gives me some indication that it can go 800% "higher" than the "neckline", which is the top of said ascending triangle. All seasoned technicians know this instinctively, and yet we have technicians handling hundreds of millions of dollars, and they're putting their eggs in the diminishing log returns basket - even though it's at odds with the facts on the ground. Fools! Most technicians are fools.
Bitcoin Technical OutlookDate: June 29, 2025
Timeframe: Daily (1D)
🔹 Market Structure
*Double Rounded Top formation visible, signaling potential exhaustion.
*Clean horizontal support zones marked around $101,000 and $92,000.
*Price reacting around neckline zone (~$106,000), forming potential lower high.
🔹 Key Levels
Resistance: $114,000 – $116,000
Major Support Zone: $101,000 → $92,000
🔹 Bullish Scenario
Price holds above $106,000 neckline and reclaims trendline resistance.
Clean breakout above $114,000 could resume bullish continuation to new highs.
🔹 Bearish Scenario
Breakdown below $106,000 neckline could trigger momentum toward $101,000 and $92,000 zones.
🔹 Bias Summary
Neutral-Bearish short-term bias.
Bulls need to reclaim $114K to invalidate breakdown risk.
Bears in control below neckline; watch $106K–$101K for reaction.

BITCOIN ROAD TO $44k - UPDATEI am updating the leading diagonal formation development, together with other insights that, if synergized properly, can give us the early warning of a potential crash towards $44k!!!!

BTCUSD_4HBitcoin Analysis Medium-Term Time Frame Elliott Wave Analysis Style The market is in five waves of ascent and can continue to rise by maintaining the $103,000 level. The target for wave 5 is $125,000.
