APPLE: 1st 1D Golden Cross in 2 years just formed.Apple is bullish on its 1D technical outlook (RSI = 67.490, MACD = 1.760, ADX = 17.850) and yesterday it started forming the first 1D Golden Cross in more than 2 years. This signals the extension of the 2nd major bullish wave of the 3 year Channel Up. The previous one made an incredible extensino to
Key facts today
Next report date
—
Report period
—
EPS estimate
—
Revenue estimate
—
26,080 COP
261.00 T COP
2,810.39 T COP
9.49 B
About Amazon.com
Sector
Industry
CEO
Andrew R. Jassy
Website
Headquarters
Seattle
Founded
1994
FIGI
BBG001BJ2992
Amazon.com, Inc. engages in the provision of online retail shopping services. It operates through the following business segments: North America, International, and Amazon Web Services (AWS). The North America segment includes retail sales of consumer products and subscriptions through North America-focused websites such as amazon.com and amazon.ca. The International segment offers retail sales of consumer products and subscriptions through internationally-focused websites. The Amazon Web Services segment involves in the global sales of compute, storage, database, and AWS service offerings for start-ups, enterprises, government agencies, and academic institutions. The company was founded by Jeffrey P. Bezos in July 1994 and is headquartered in Seattle, WA.
Related stocks

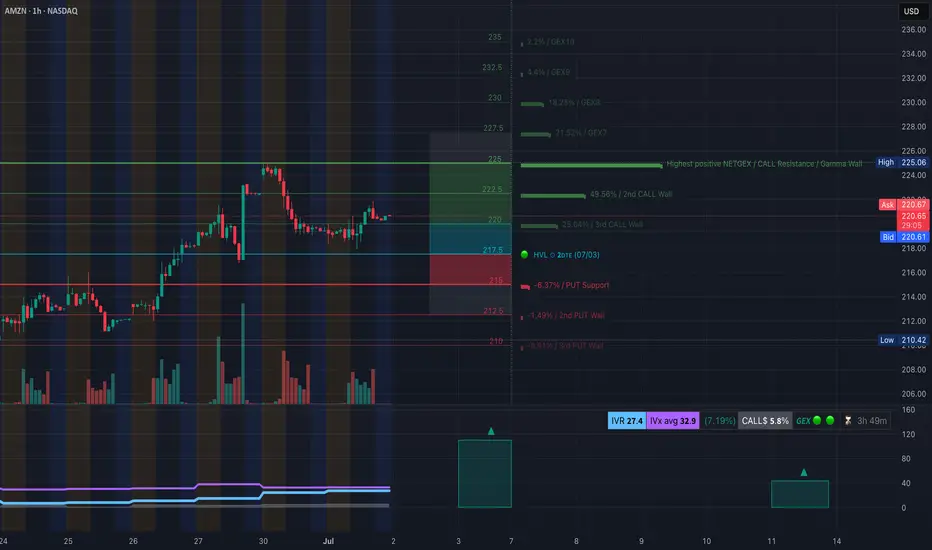
AMZN Is Coiling Up for a Gamma Push — Don’t Sleep on This Zone🔍 GEX Outlook & Option Bias:
Amazon (AMZN) is sitting right at the heart of a bullish Gamma setup. The 220–225 zone is where the action is:
* Highest Net Positive GEX sits at 225 — major gamma magnet and potential squeeze target.
* 49.56% Call Wall at 222.5 confirms call-dominant sentiment.
* IVR at
AMAZONAMZN needs some more upside before a pullback.
Disclosure: We are part of Trade Nation's Influencer program and receive a monthly fee for using their TradingView charts in our analysis.

AMZN: Daily Trend Change with Bullish Continuation Setup
🗓 Published: June 26, 2025
📍 Ticker: NASDAQ:AMZN – Amazon.com Inc.
🕒 Timeframes: Daily & 4H
📊 Technical Bias: Bullish
📈 Trend: Higher Highs & Higher Lows
🧠 Analysis Summary
Amazon has successfully reclaimed a bullish market structure on the daily chart by forming higher highs and higher lows sin

AMZN Monday Setup: Will $225 Hold or Fold? Key Levels for Trader🚨GEX-Based Options Sentiment (as of Sunday Close):
* $225 – Key Call Wall & Highest Positive GEX level: Strong resistance. AMZN closed right below this — very telling.
* $220 – GEX8 / 2nd Call Wall: Gamma magnet zone. Price may gravitate here early in the session.
* $210 – Strong Put Wall + HVL zone

AMZN Heating Up – GEX Shows There's Room to Run!
Alright, guys – here's the scoop on Amazon (AMZN) right now based on the latest GEX map and price action.
🧠 GEX Setup:
We’re seeing solid call gamma buildup from 213 → 220, and a strong positive NET GEX wall near 215–217. That tells us market makers might start pushing price toward those high-gamma

$AMZN - support at $218.63 . next level at $225AMZN - Stock holding support on the trendline. Stock is also holding flat top support at $218.56. With prime day coming soon, we can see a spike towards to $225 and $230 . decent call flow coming in.

AMZN Short Market Structure Analysis
Break of Structure (BOS)
A bullish run culminated in a BOS to the upside, which typically signals a short-term bullish intent. However, this move acts as a liquidity grab, sweeping buy-side liquidity above the prior high.
Liquidity Sweep & Rejection
Price taps into the hig

Amazon getting ready for another leg downAmazon is now in consolidation mode right below the 200MA which also happens to line up with a previous area of resistance. As long as it continues to consolidate below the 200MA, look for another leg down. If it breaks above the 200MA and closes an entire candle above then that would cancel the bea

Amazon swing trade ideaAmazon has fallen below its trendline and started to dip slightly despite the fact that the broad market is going higher. I have found an opportunity for a decent long entry and have ran the numbers, the intrinsic value of Amazon right now is between $180 and $520. Not only is it a retail giant but

See all ideas
Summarizing what the indicators are suggesting.
Neutral
SellBuy
Strong sellStrong buy
Strong sellSellNeutralBuyStrong buy
Neutral
SellBuy
Strong sellStrong buy
Strong sellSellNeutralBuyStrong buy
Neutral
SellBuy
Strong sellStrong buy
Strong sellSellNeutralBuyStrong buy
An aggregate view of professional's ratings.
Neutral
SellBuy
Strong sellStrong buy
Strong sellSellNeutralBuyStrong buy
Neutral
SellBuy
Strong sellStrong buy
Strong sellSellNeutralBuyStrong buy
Neutral
SellBuy
Strong sellStrong buy
Strong sellSellNeutralBuyStrong buy
Displays a symbol's price movements over previous years to identify recurring trends.
Curated watchlists where AMZN is featured.


Frequently Asked Questions
The current price of AMZN is 890,000 COP — it has increased by 0.39% in the past 24 hours. Watch AMAZON stock price performance more closely on the chart.
Depending on the exchange, the stock ticker may vary. For instance, on BVC exchange AMAZON stocks are traded under the ticker AMZN.
AMZN stock has fallen by −0.95% compared to the previous week, the month change is a 4.97% rise, over the last year AMAZON has showed a 8.08% increase.
We've gathered analysts' opinions on AMAZON future price: according to them, AMZN price has a max estimate of 1,155,378.49 COP and a min estimate of 776,892.43 COP. Watch AMZN chart and read a more detailed AMAZON stock forecast: see what analysts think of AMAZON and suggest that you do with its stocks.
AMZN reached its all-time high on Dec 30, 2024 with the price of 1,077,960 COP, and its all-time low was 10,640 COP and was reached on Feb 1, 2016. View more price dynamics on AMZN chart.
See other stocks reaching their highest and lowest prices.
See other stocks reaching their highest and lowest prices.
AMZN stock is 3.64% volatile and has beta coefficient of 1.37. Track AMAZON stock price on the chart and check out the list of the most volatile stocks — is AMAZON there?
Today AMAZON has the market capitalization of 9,449.44 T, it has decreased by −3.76% over the last week.
Yes, you can track AMAZON financials in yearly and quarterly reports right on TradingView.
AMAZON is going to release the next earnings report on Jul 31, 2025. Keep track of upcoming events with our Earnings Calendar.
AMZN earnings for the last quarter are 6.63 K COP per share, whereas the estimation was 5.69 K COP resulting in a 16.38% surprise. The estimated earnings for the next quarter are 5.37 K COP per share. See more details about AMAZON earnings.
AMAZON revenue for the last quarter amounts to 648.61 T COP, despite the estimated figure of 646.45 T COP. In the next quarter, revenue is expected to reach 661.08 T COP.
AMZN net income for the last quarter is 71.36 T COP, while the quarter before that showed 88.12 T COP of net income which accounts for −19.02% change. Track more AMAZON financial stats to get the full picture.
No, AMZN doesn't pay any dividends to its shareholders. But don't worry, we've prepared a list of high-dividend stocks for you.
As of Jul 4, 2025, the company has 1.56 M employees. See our rating of the largest employees — is AMAZON on this list?
EBITDA measures a company's operating performance, its growth signifies an improvement in the efficiency of a company. AMAZON EBITDA is 532.95 T COP, and current EBITDA margin is 19.15%. See more stats in AMAZON financial statements.
Like other stocks, AMZN shares are traded on stock exchanges, e.g. Nasdaq, Nyse, Euronext, and the easiest way to buy them is through an online stock broker. To do this, you need to open an account and follow a broker's procedures, then start trading. You can trade AMAZON stock right from TradingView charts — choose your broker and connect to your account.
Investing in stocks requires a comprehensive research: you should carefully study all the available data, e.g. company's financials, related news, and its technical analysis. So AMAZON technincal analysis shows the buy rating today, and its 1 week rating is buy. Since market conditions are prone to changes, it's worth looking a bit further into the future — according to the 1 month rating AMAZON stock shows the buy signal. See more of AMAZON technicals for a more comprehensive analysis.
If you're still not sure, try looking for inspiration in our curated watchlists.
If you're still not sure, try looking for inspiration in our curated watchlists.