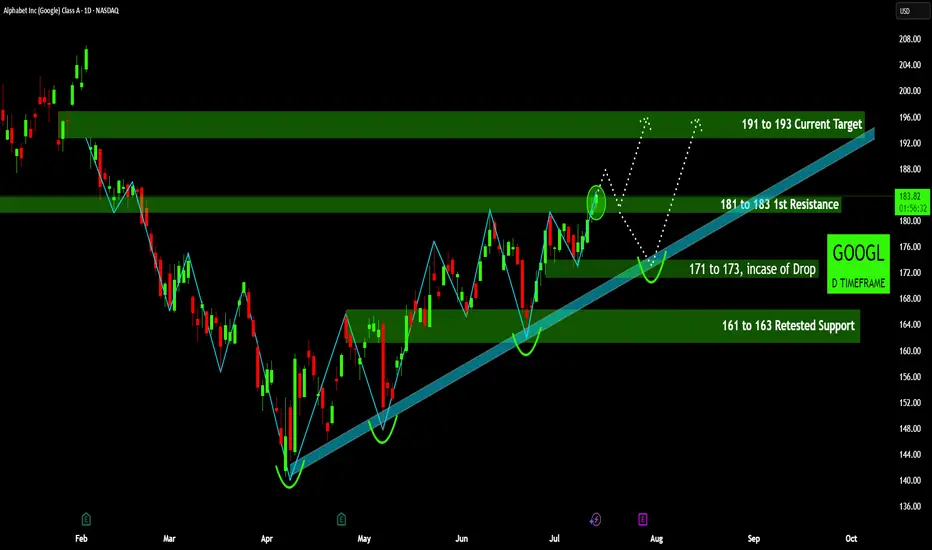
Alphabet - The textbook break and retest!📧Alphabet ( NASDAQ:GOOGL ) will head much higher:
🔎Analysis summary:
If we look at the chart of Alphabet we can basically only see green lines. And despite the recent correction of about -30%, Alphabet remains in a very bullish market. Looking at the recent all time high break and retest, the
Key facts today
Next report date
—
Report period
—
EPS estimate
—
Revenue estimate
—
8.019 CHF
90.93 B CHF
317.69 B CHF
5.07 B
About Alphabet Inc (Google) Class C
Sector
Industry
CEO
Sundar Pichai
Website
Headquarters
Mountain View
Founded
2015
FIGI
BBG00LVD61W6
Alphabet, Inc. is a holding company, which engages in software, health care, transportation, and other technologies. It operates through the following segments: Google Services, Google Cloud, and Other Bets. The Google Services segment includes products and services, such as ads, Android, Chrome, devices, Google Maps, Google Play, Search, and YouTube. The Google Cloud segment refers to infrastructure and platform services, collaboration tools, and other services for enterprise customers. The Other Bets segment relates to the sale of healthcare-related services and internet services. The company was founded by Lawrence E. Page and Sergey Mikhaylovich Brin on October 2, 2015 and is headquartered in Mountain View, CA.
Related stocks

GOOGL Short Term Trading IdeaEntered at $173.55 on 07/08.
Expecting earnings to be reported on 07/23 and beat expectations by a huge margin.

GOOGL Ready to Recharge or Break? TA for July 16📊 GEX Sentiment & Options Outlook (Based on July 15 Data)
* Key Resistance Zone:
‣ 184–185: Highest Positive NET GEX, 3rd Call Wall → Strong gamma resistance
‣ 190–192.5: Additional call wall cluster—unlikely to break without strong momentum
‣ 195: GEX10 level (top bullish magnet if a breakout trigg

Analyzing GOOGL's Path: Breakouts and Critical Support• Strong Upward Trendline : The chart clearly displays an ascending trendline (light blue) from early April, indicating a robust bullish trend. The price has consistently found support at or near this line, reinforcing its significance as a key technical level.
• Recent Breakout and Potential Re
GOOG Wave B
Bullish price action from the last couple of months has been unconvincing, and this looks more like a wave B correction.
A break of the black ascending channel would be a trigger for wave C.
It would be interesting to see a reversal pattern in smaller timeframes if price touches the gray supply

GOOGL Eyeing a Gamma Launch Above $182. for July 14🔹 GEX Options Sentiment Analysis
* Gamma Resistance Zone:
The $180 level marks the highest positive Net GEX / Call Wall, making it a magnet and potential resistance for GOOGL.
Above that:
* $182.5 = 2nd Call Wall
* $185 = 3rd Call Wall
* $186.43 is the extreme call zone from GEX
* Put Wa

GOOG - Possible Break OutHello Everyone,
Happy Sunday to All.
I would like to make a quick Analyse on GOOG. When i was scanning the stocks,i reliazed that this could be a possible breakout and could be a opportunity to buy.
This looks like a breakout and i am expecting to Re-test trend line which price level 175 $.
Then

$GOOGL $GOOG AI Signals a Volatile Expansion 🔍 Technical Overview (Daily TF)
GOOGL is currently trading at $180.19, breaking upward inside a well-defined bullish channel, hugging equilibrium levels after consolidating just below the $184 resistance zone. This setup reflects classic Smart Money reaccumulation behavior:
🟩 Current Structure: CHo


Momentum Watch: GOOG Entry ZoneNASDAQ:GOOG – Trend Continuation Setup
The price has been trending within a clean ascending channel since April 2025.
After a pullback toward the midline and Bollinger basis, price is showing potential support.
Setup:
• Entry: $175 (conceptual)
• Stop: $165.5 (below channel)
• Target: $208 (u

See all ideas
Summarizing what the indicators are suggesting.
Neutral
SellBuy
Strong sellStrong buy
Strong sellSellNeutralBuyStrong buy
Neutral
SellBuy
Strong sellStrong buy
Strong sellSellNeutralBuyStrong buy
Neutral
SellBuy
Strong sellStrong buy
Strong sellSellNeutralBuyStrong buy
An aggregate view of professional's ratings.
Neutral
SellBuy
Strong sellStrong buy
Strong sellSellNeutralBuyStrong buy
Neutral
SellBuy
Strong sellStrong buy
Strong sellSellNeutralBuyStrong buy
Neutral
SellBuy
Strong sellStrong buy
Strong sellSellNeutralBuyStrong buy
Displays a symbol's price movements over previous years to identify recurring trends.
US2079KAF4
ALPHABET 20/50Yield to maturity
7.16%
Maturity date
Aug 15, 2050
US2079KAG2
ALPHABET 20/60Yield to maturity
7.05%
Maturity date
Aug 15, 2060
US2079KAE7
ALPHABET 20/40Yield to maturity
6.36%
Maturity date
Aug 15, 2040
GOOG6065579
Alphabet Inc. 5.3% 15-MAY-2065Yield to maturity
5.69%
Maturity date
May 15, 2065
GOOG6065578
Alphabet Inc. 5.25% 15-MAY-2055Yield to maturity
5.57%
Maturity date
May 15, 2055
GOOG6065581
Alphabet Inc. 4.5% 15-MAY-2035Yield to maturity
4.88%
Maturity date
May 15, 2035
US2079KAD9
ALPHABET 20/30Yield to maturity
4.48%
Maturity date
Aug 15, 2030
US2079KAC1
ALPHABET 16/26Yield to maturity
4.30%
Maturity date
Aug 15, 2026
XS306443038
ALPHABET 25/54Yield to maturity
4.25%
Maturity date
May 6, 2054
GOOG6065580
Alphabet Inc. 4.0% 15-MAY-2030Yield to maturity
4.16%
Maturity date
May 15, 2030
GOOG5025299
Alphabet Inc. 0.45% 15-AUG-2025Yield to maturity
4.11%
Maturity date
Aug 15, 2025
See all ABEC bonds
Curated watchlists where ABEC is featured.


Frequently Asked Questions
The current price of ABEC is 139.528 CHF — it has decreased by −4.22% in the past 24 hours. Watch ALPHABET INC stock price performance more closely on the chart.
Depending on the exchange, the stock ticker may vary. For instance, on BX exchange ALPHABET INC stocks are traded under the ticker ABEC.
We've gathered analysts' opinions on ALPHABET INC future price: according to them, ABEC price has a max estimate of 200.72 CHF and a min estimate of 128.46 CHF. Watch ABEC chart and read a more detailed ALPHABET INC stock forecast: see what analysts think of ALPHABET INC and suggest that you do with its stocks.
ABEC reached its all-time high on Nov 18, 2021 with the price of 2,775.540 CHF, and its all-time low was 81.493 CHF and was reached on Jan 6, 2023. View more price dynamics on ABEC chart.
See other stocks reaching their highest and lowest prices.
See other stocks reaching their highest and lowest prices.
ABEC stock is 4.41% volatile and has beta coefficient of 0.94. Track ALPHABET INC stock price on the chart and check out the list of the most volatile stocks — is ALPHABET INC there?
Today ALPHABET INC has the market capitalization of 1.81 T, it has increased by 4.00% over the last week.
Yes, you can track ALPHABET INC financials in yearly and quarterly reports right on TradingView.
ALPHABET INC is going to release the next earnings report on Jul 23, 2025. Keep track of upcoming events with our Earnings Calendar.
ABEC earnings for the last quarter are 2.49 CHF per share, whereas the estimation was 1.79 CHF resulting in a 38.84% surprise. The estimated earnings for the next quarter are 1.72 CHF per share. See more details about ALPHABET INC earnings.
ALPHABET INC revenue for the last quarter amounts to 79.88 B CHF, despite the estimated figure of 78.97 B CHF. In the next quarter, revenue is expected to reach 74.51 B CHF.
ABEC net income for the last quarter is 30.58 B CHF, while the quarter before that showed 24.10 B CHF of net income which accounts for 26.87% change. Track more ALPHABET INC financial stats to get the full picture.
Yes, ABEC dividends are paid quarterly. The last dividend per share was 0.17 CHF. As of today, Dividend Yield (TTM)% is 0.44%. Tracking ALPHABET INC dividends might help you take more informed decisions.
ALPHABET INC dividend yield was 0.32% in 2024, and payout ratio reached 7.46%. The year before the numbers were 0.00% and 0.00% correspondingly. See high-dividend stocks and find more opportunities for your portfolio.
As of Jul 18, 2025, the company has 183.32 K employees. See our rating of the largest employees — is ALPHABET INC on this list?
EBITDA measures a company's operating performance, its growth signifies an improvement in the efficiency of a company. ALPHABET INC EBITDA is 118.19 B CHF, and current EBITDA margin is 36.45%. See more stats in ALPHABET INC financial statements.
Like other stocks, ABEC shares are traded on stock exchanges, e.g. Nasdaq, Nyse, Euronext, and the easiest way to buy them is through an online stock broker. To do this, you need to open an account and follow a broker's procedures, then start trading. You can trade ALPHABET INC stock right from TradingView charts — choose your broker and connect to your account.
Investing in stocks requires a comprehensive research: you should carefully study all the available data, e.g. company's financials, related news, and its technical analysis. So ALPHABET INC technincal analysis shows the sell today, and its 1 week rating is sell. Since market conditions are prone to changes, it's worth looking a bit further into the future — according to the 1 month rating ALPHABET INC stock shows the sell signal. See more of ALPHABET INC technicals for a more comprehensive analysis.
If you're still not sure, try looking for inspiration in our curated watchlists.
If you're still not sure, try looking for inspiration in our curated watchlists.