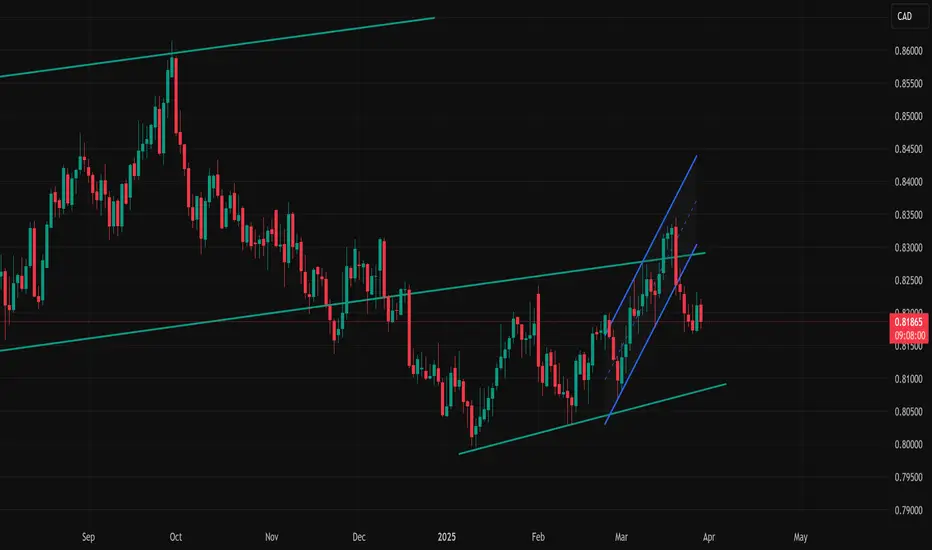
short setup on nzdcadNZDCAD Has just drop to a bearish movement on a weekly timeframe; there is currently a continuous bearish movement on a daily TF
CADNZD trade ideas
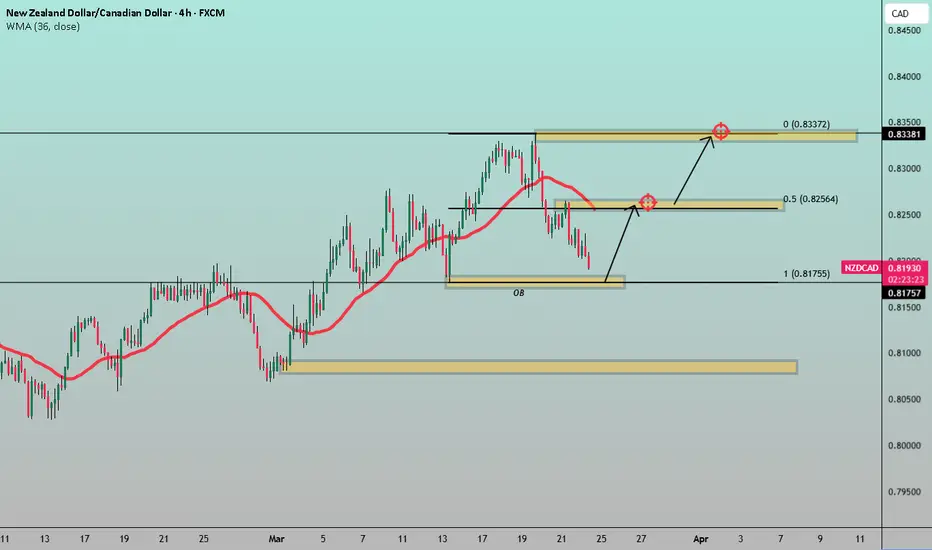
NZDCAdhello trader, price is reaching near the 4hr OB. the price may reverse from this point since the price is still uptrend, this could be correction for htf day-week. wait for proper reversal when candle break out with fvg for best result...
good luck..
EXPECT FOR A BULLISH TRENDNZDCAD gave us inv. H&Ss pattern(D1) and started to do HH and HL so now I'm expecting for price to start going up, let see what patterns are gonna form from our 51% and 61% zone.
NB:NO REVERSAL PATTERNS NO ENTRY.

NZD/CAD H1 | Approaching overlap resistanceNZD/CAD is rising towards an overlap resistance and could potentially reverse off this level to drop lower.
Sell entry is at 0.8205 which is an overlap resistance that aligns with the 23.6% Fibonacci retracement.
Stop loss is at 0.8240 which is a level that sits above the 38.2% Fibonacci retracement and a swing-high resistance.
Take profit is at 0.8165 which is a swing-low support.
High Risk Investment Warning
Trading Forex/CFDs on margin carries a high level of risk and may not be suitable for all investors. Leverage can work against you.
Stratos Markets Limited (www.fxcm.com):
CFDs are complex instruments and come with a high risk of losing money rapidly due to leverage. 63% of retail investor accounts lose money when trading CFDs with this provider. You should consider whether you understand how CFDs work and whether you can afford to take the high risk of losing your money.
Stratos Europe Ltd (www.fxcm.com):
CFDs are complex instruments and come with a high risk of losing money rapidly due to leverage. 63% of retail investor accounts lose money when trading CFDs with this provider. You should consider whether you understand how CFDs work and whether you can afford to take the high risk of losing your money.
Stratos Trading Pty. Limited (www.fxcm.com):
Trading FX/CFDs carries significant risks. FXCM AU (AFSL 309763), please read the Financial Services Guide, Product Disclosure Statement, Target Market Determination and Terms of Business at www.fxcm.com
Stratos Global LLC (www.fxcm.com):
Losses can exceed deposits.
Please be advised that the information presented on TradingView is provided to FXCM (‘Company’, ‘we’) by a third-party provider (‘TFA Global Pte Ltd’). Please be reminded that you are solely responsible for the trading decisions on your account. There is a very high degree of risk involved in trading. Any information and/or content is intended entirely for research, educational and informational purposes only and does not constitute investment or consultation advice or investment strategy. The information is not tailored to the investment needs of any specific person and therefore does not involve a consideration of any of the investment objectives, financial situation or needs of any viewer that may receive it. Kindly also note that past performance is not a reliable indicator of future results. Actual results may differ materially from those anticipated in forward-looking or past performance statements. We assume no liability as to the accuracy or completeness of any of the information and/or content provided herein and the Company cannot be held responsible for any omission, mistake nor for any loss or damage including without limitation to any loss of profit which may arise from reliance on any information supplied by TFA Global Pte Ltd.
The speaker(s) is neither an employee, agent nor representative of FXCM and is therefore acting independently. The opinions given are their own, constitute general market commentary, and do not constitute the opinion or advice of FXCM or any form of personal or investment advice. FXCM neither endorses nor guarantees offerings of third-party speakers, nor is FXCM responsible for the content, veracity or opinions of third-party speakers, presenters or participants.

NZDCAD Long BiasHi all,
Just a nice techincal level on Daily / H4 on NZDCAD for a potential Long position.
A strong uptrend with impulsive bullish candles.
Let's see how it goes.
Trade safe!

NZDCAD is BullishPrice was in a downtrend, however the bulls seem to have answered the call and are trying to assume control of the price action. If previous lower high is broken with good volume then we can expect a bullish reversal as per Dow theory. Targets are mentioned on the chart.

NZD/CAD BEST PLACE TO SELL FROM|SHORT
Hello, Friends!
NZD/CAD is making a bullish rebound on the 1H TF and is nearing the resistance line above while we are generally bearish biased on the pair due to our previous 1W candle analysis, thus making a trend-following short a good option for us with the target being the 0.817 level.
Disclosure: I am part of Trade Nation's Influencer program and receive a monthly fee for using their TradingView charts in my analysis.
✅LIKE AND COMMENT MY IDEAS✅

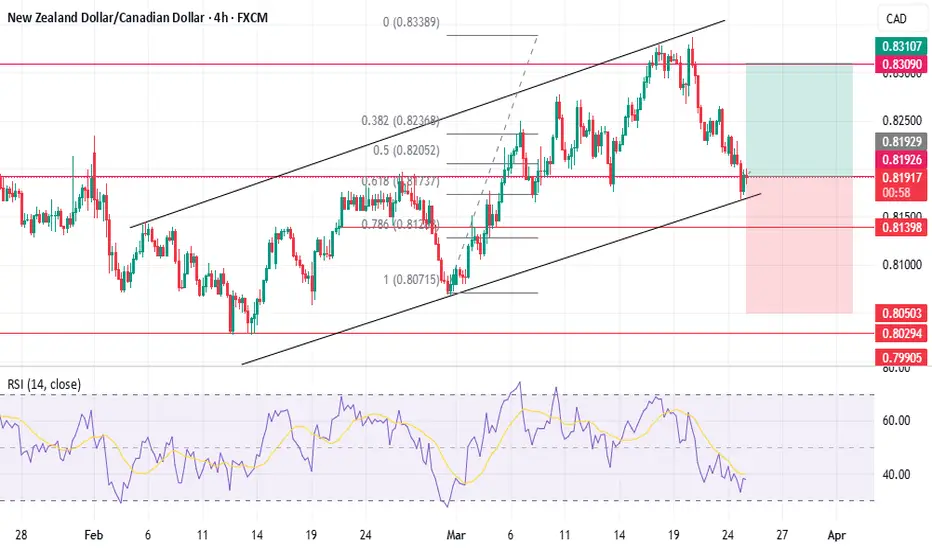
Bearish breakout?NZD/CAD is reacting off the pivot and a breakout could potentially lead the price to drop to the 1st support.
Pivot: 0.8194
1st Support: 0.80792
1st Resistance: 0.82654
Risk Warning:
Trading Forex and CFDs carries a high level of risk to your capital and you should only trade with money you can afford to lose. Trading Forex and CFDs may not be suitable for all investors, so please ensure that you fully understand the risks involved and seek independent advice if necessary.
Disclaimer:
The above opinions given constitute general market commentary, and do not constitute the opinion or advice of IC Markets or any form of personal or investment advice.
Any opinions, news, research, analyses, prices, other information, or links to third-party sites contained on this website are provided on an "as-is" basis, are intended only to be informative, is not an advice nor a recommendation, nor research, or a record of our trading prices, or an offer of, or solicitation for a transaction in any financial instrument and thus should not be treated as such. The information provided does not involve any specific investment objectives, financial situation and needs of any specific person who may receive it. Please be aware, that past performance is not a reliable indicator of future performance and/or results. Past Performance or Forward-looking scenarios based upon the reasonable beliefs of the third-party provider are not a guarantee of future performance. Actual results may differ materially from those anticipated in forward-looking or past performance statements. IC Markets makes no representation or warranty and assumes no liability as to the accuracy or completeness of the information provided, nor any loss arising from any investment based on a recommendation, forecast or any information supplied by any third-party.

NZDCAD: Bullish Continuation & Long Trade
NZDCAD
- Classic bullish formation
- Our team expects growth
SUGGESTED TRADE:
Swing Trade
Buy NZDCAD
Entry Level - 0.8206
Sl - 0.8171
Tp - 0.8262
Our Risk - 1%
Start protection of your profits from lower levels
Disclosure: I am part of Trade Nation's Influencer program and receive a monthly fee for using their TradingView charts in my analysis.
❤️ Please, support our work with like & comment! ❤️

NZD/CAD - Long Trade IdeaCurrently have been watching this market for a few weeks now and we have been slow progressing into this level.
Smaller Time frames have just displayed our change of character indicating that we will be starting to see a little more volume come in for buyers. After already taking out the previous high I will be looking for entries soon looking to sweep Buy side Liquidity
Price has already swept Sell Side Liquidity so now we will let time now just make its move'
Good luck to any traders that might follow
NZDCADWe can attempt to buy NZDCAD from specified level as it make HL , also there is no bearish divergence occur indicate that it moves upward.
SL , TP mention in chart.

NZDCAD ShortNZDCAD is now net short on the regression break.
I am consider this pair and the EA that best suits the trading considerations.

NZD-CAD Risky Long! Buy!
Hello,Traders!
NZD-CAD made a retest
Of the horizontal support
Of 0.8170 and we are already
Seeing a bullish rebound
So we are bullish biased
And we will be expecting
A further bullish move up
Buy!
Comment and subscribe to help us grow!
Check out other forecasts below too!
Disclosure: I am part of Trade Nation's Influencer program and receive a monthly fee for using their TradingView charts in my analysis.

NZDCAD Reached the support and may pullback from here.NZDCAD has reached the support and many times is rebound form here and I believe that it will move up again as seen form the graph.

NZD/CAD For Bearishyou can go short now
general trend is up trend
current phase is pull-back
have fun :)

NZD/CAD "Kiwi vs Loonie" Forex Market Heist Plan🌟Hi! Hola! Ola! Bonjour! Hallo! Marhaba!🌟
Dear Money Makers & Thieves, 🤑💰💸✈️
Based on 🔥Thief Trading style technical and fundamental analysis🔥, here is our master plan to heist the NZD/CAD "Kiwi vs Loonie" Forex market. Please adhere to the strategy I've outlined in the chart, which emphasizes long entry. Our aim is the high-risk Red Zone. Risky level, overbought market, consolidation, trend reversal, trap at the level where traders and bearish robbers are stronger. 🏆💸Book Profits wealthy and safe trade.💪🏆🎉
Entry 📈 : "The heist is on! Wait for the MA breakout (0.82800) then make your move - Bullish profits await!"
however I advise to Place Buy stop orders above the Moving average (or) Place buy limit orders within a 15 or 30 minute timeframe most recent or swing, low or high level.
📌I strongly advise you to set an alert on your chart so you can see when the breakout entry occurs.
Stop Loss 🛑:
Thief SL placed at the recent/swing low or high level Using the 4H timeframe (0.81800) swing trade basis.
SL is based on your risk of the trade, lot size and how many multiple orders you have to take.
Target 🎯: 0.83700 (or) Escape Before the Target
🧲Scalpers, take note 👀 : only scalp on the Long side. If you have a lot of money, you can go straight away; if not, you can join swing traders and carry out the robbery plan. Use trailing SL to safeguard your money 💰.
NZD/CAD "Kiwi vs Loonie" Forex Market is currently experiencing a Bullish trend., driven by several key factors. 📰🗞️Get & Read the Fundamental, Macro Economics, COT Report, Quantitative Analysis, Intermarket Analysis, Sentimental Outlook, Future Trend Move:
Before start the heist plan read it.👉👉👉
📌Keep in mind that these factors can change rapidly, and it's essential to stay up-to-date with market developments and adjust your analysis accordingly.
⚠️Trading Alert : News Releases and Position Management 📰 🗞️ 🚫🚏
As a reminder, news releases can have a significant impact on market prices and volatility. To minimize potential losses and protect your running positions,
we recommend the following:
Avoid taking new trades during news releases
Use trailing stop-loss orders to protect your running positions and lock in profits
💖Supporting our robbery plan 💥Hit the Boost Button💥 will enable us to effortlessly make and steal money 💰💵. Boost the strength of our robbery team. Every day in this market make money with ease by using the Thief Trading Style.🏆💪🤝❤️🎉🚀
I'll see you soon with another heist plan, so stay tuned 🤑🐱👤🤗🤩

NZDCAD BUY PROJECTION Market is in a weekly descending triangle pattern creating a current daily bullish market environment, with the continuous higher highs and higher lows created.
I'm anticipating a bounce on the current support area.

idea on a trendWe have a great bearish flag breaking out great trend.USD can return back to the low/mid-1.42s
"BoC Governor Macklem’s remarks on tariffs and monetary policy yesterday underscored the Bank’s sensitivity to the inflationary consequences of trade wars. He noted that the hot February CPI report had got policymakers’ attention but their outlook had not fundamentally changed. Market expectations for policy moves were unchanged around the comments. Swaps reflect around 80% probability of a 25bps cut by June."
"The USD’s failed push higher yesterday should put an effective cap on funds in the short run at least. Price action indicates a clear rejection of yesterday’s test of 1.44 and the USD closed the session back under resistance around 1.4340/50. This may set the market up for another push on trend support at 1.4300/10, with a break below here likely to drive the USD back to the low/mid-1.42s"

NZD/CAD For Bullishyou can go long now
or
wait for pull-back near by entry point and then go long
general trend is up trend
have fun :)

Bearish drop?NZD/CAD is rising towards the pivot and could drop to the 1st support.
Pivot: 0.82703
1st Support: 0.81897
1st Resistance: 0.83299
Risk Warning:
Trading Forex and CFDs carries a high level of risk to your capital and you should only trade with money you can afford to lose. Trading Forex and CFDs may not be suitable for all investors, so please ensure that you fully understand the risks involved and seek independent advice if necessary.
Disclaimer:
The above opinions given constitute general market commentary, and do not constitute the opinion or advice of IC Markets or any form of personal or investment advice.
Any opinions, news, research, analyses, prices, other information, or links to third-party sites contained on this website are provided on an "as-is" basis, are intended only to be informative, is not an advice nor a recommendation, nor research, or a record of our trading prices, or an offer of, or solicitation for a transaction in any financial instrument and thus should not be treated as such. The information provided does not involve any specific investment objectives, financial situation and needs of any specific person who may receive it. Please be aware, that past performance is not a reliable indicator of future performance and/or results. Past Performance or Forward-looking scenarios based upon the reasonable beliefs of the third-party provider are not a guarantee of future performance. Actual results may differ materially from those anticipated in forward-looking or past performance statements. IC Markets makes no representation or warranty and assumes no liability as to the accuracy or completeness of the information provided, nor any loss arising from any investment based on a recommendation, forecast or any information supplied by any third-party.

NZDCAD breakdown or support ?NZDCAD is trading in a ascending channel and now reached the higher low support area will it take support or will breakdown, trade accordingly

NZDCAD Broke the SupportNZDCAD Broke the Support zone and retouched signaling further bearish movement. Looking at a potential SELL
