CADNZD trade ideas
NZDCAD is in a very nice condition to buyNZDCAD is in a very nice condition to buy , time to buy
continue to market structure


NZDCAD: Bearish After the News?! 🇳🇿🇨🇦
NZDCAD turned bearish after a release of Canadian Inflation data.
The price retraced from a key daily resistance and broke
a support line of a rising parallel channel on an hourly time frame.
The market may drop at least to 0.8293
❤️Please, support my work with like, thank you!❤️
I am part of Trade Nation's Influencer program and receive a monthly fee for using their TradingView charts in my analysis.

NZD/CAD - Day Trading Analysis With Volume ProfileOn NZD/CAD , it's nice to see a strong buying reaction at the price of 0.81930.
There's a significant accumulation of contracts in this area, indicating strong buyer interest. I believe that buyers who entered at this level will defend their long positions. If the price returns to this area, strong buyers will likely push the market up again.
Strong rejection of lower prices + Uptrend and high volume cluster are the main reasons for my decision to go long on this trade.
Happy trading
Dale

NZDCADAll timeframes in sync, looking for price to come back to the zone to then possibly have more confluences in line to then take a buy position

NZDCAD Buy ForecastNZDCAD New Forecast👨💻👨💻
Am expecting a bullish movement to 1.2+RR
This is my personal trade and not in anyway a mandatory setup.
Note:
Follow proper risk management rules. Never risk more then 2% of your total capital. Money management is the key of success in this business...... Set your own SL & TP.
Please support this idea with a Like and COMMENT if you find it useful click "follow" on our profile if you will like these type of trading ideas delivered straight to your email in the future.
Thanks for your continued support!! lemme know your thoughts in the comment sec..

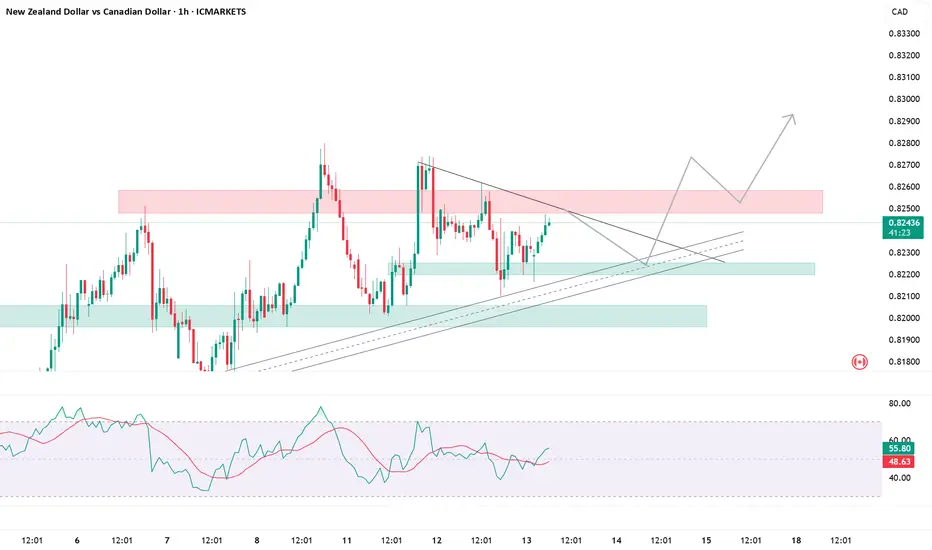
NZDCADBounced off latest daily support last week. Now have a minor H1 resistance, once broken and retest is made with bullish momentum, possible movement to the upside.

NZD/CAD SENDS CLEAR BEARISH SIGNALS|SHORT
Hello, Friends!
NZD/CAD is making a bullish rebound on the 9H TF and is nearing the resistance line above while we are generally bearish biased on the pair due to our previous 1W candle analysis, thus making a trend-following short a good option for us with the target being the 0.820 level.
Disclosure: I am part of Trade Nation's Influencer program and receive a monthly fee for using their TradingView charts in my analysis.
✅LIKE AND COMMENT MY IDEAS✅

SELLGod First
Minimum Risk Maximum Reward
Action Backed Believe
# faith, strategy, and execution all in one #

NZDCAD: Strong Bullish Signals 🇳🇿🇨🇦
I see 2 strong price action confirmations on NZDCAD:
the price broke a resistance line of a bullish flag
and then formed a confirmed change of character CHoCH on a 4H.
I think that the market will continue a bullish rally.
Next resistance - 0.83
❤️Please, support my work with like, thank you!❤️
I am part of Trade Nation's Influencer program and receive a monthly fee for using their TradingView charts in my analysis.

NZDCAD NICE SHORT OPPORTUNITY its an amazing opportunity for short nzdcad with a nice R/R
i beleive we will hit the target


NZDCAD PRINTING REVERSALTechnically:
NZDCAD printing double top
NZDCAD printing bearish divergence
NZDCAD supporting bearish trendline

NZDCAD may take some time to breakoutNZDCAD may take some time to breakout. But will remain Bullish.
Update on Buys NCADthis is an update I sent 3 trades EU of which stop loss of 20 pips and GU of which it hit take profits of 40 pips NCAD sell limit is active with 15 pips profits we are up 1% for the day and 3% for the week.


NZDCAD Swing Long PositionEntry: 0.81306
Stop Loss: 0.80188
Take Profit 1: 0.82542
Take Profit 2: 0.83529
Take Profit 3: 0.84448

NZDCAD BUY OPPORTUNITY Price is set to trade bullish as we had a recent bounce off fur trend line. A buy opportunity is envisaged from the current market price. Price maintains a bullish momentum


NZDCAD FORECAST This is the pair I'm watching closely today! In the higher timeframe, the price signals that more selling potential is about to come. I love the sequence in the lower timeframe. What I'm waiting for is to see if the price will develop a 1-2-3 structure, then look for a rejection candle as my confirmation for the risk entry.

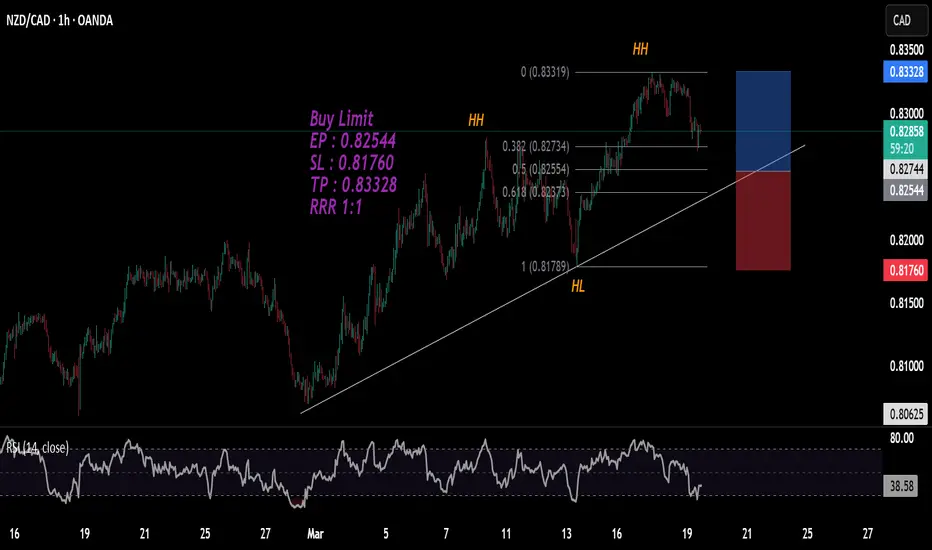
NZDCAD-BULLISH SETUPNZDCAD seems to be in bull run as it is continue to print new HH and HL with respecting the trendline.

Bullish bounce off overlap support?NZD/CAD is falling towards the pivot and could bounce to the 1st resistance.
Pivot: 0.81661
1st Support: 0.81118
1st Resistance: 0.82660
Risk Warning:
Trading Forex and CFDs carries a high level of risk to your capital and you should only trade with money you can afford to lose. Trading Forex and CFDs may not be suitable for all investors, so please ensure that you fully understand the risks involved and seek independent advice if necessary.
Disclaimer:
The above opinions given constitute general market commentary, and do not constitute the opinion or advice of IC Markets or any form of personal or investment advice.
Any opinions, news, research, analyses, prices, other information, or links to third-party sites contained on this website are provided on an "as-is" basis, are intended only to be informative, is not an advice nor a recommendation, nor research, or a record of our trading prices, or an offer of, or solicitation for a transaction in any financial instrument and thus should not be treated as such. The information provided does not involve any specific investment objectives, financial situation and needs of any specific person who may receive it. Please be aware, that past performance is not a reliable indicator of future performance and/or results. Past Performance or Forward-looking scenarios based upon the reasonable beliefs of the third-party provider are not a guarantee of future performance. Actual results may differ materially from those anticipated in forward-looking or past performance statements. IC Markets makes no representation or warranty and assumes no liability as to the accuracy or completeness of the information provided, nor any loss arising from any investment based on a recommendation, forecast or any information supplied by any third-party.
