NZDCAD Selling Trading IdeaHello Traders
In This Chart nzdcad HOURLY Forex Forecast By FOREX PLANET
today NZDCAD analysis 👆
🟢This Chart includes_ (NZDCAD market update)
🟢What is The Next Opportunity on NZDCAD Market
🟢how to Enter to the Valid Entry With Assurance Profit
This CHART is For Trader's that Want to Improve Their Technical Analysis Skills and Their Trading By Understanding How To Analyze The Market Using Multiple Timeframes and Understanding The Bigger Picture on the Charts
CADNZD trade ideas

NZDCAD is BullishPrice was in a downtrend, however the bulls seem to be warming up for assuming control of price action following the formation of a bullish divergence with double bottom reversal pattern formation. If previous lower high is broken with good volume then we can expect a bullish reversal as per Dow theory. Targets are mentioned on the chart.

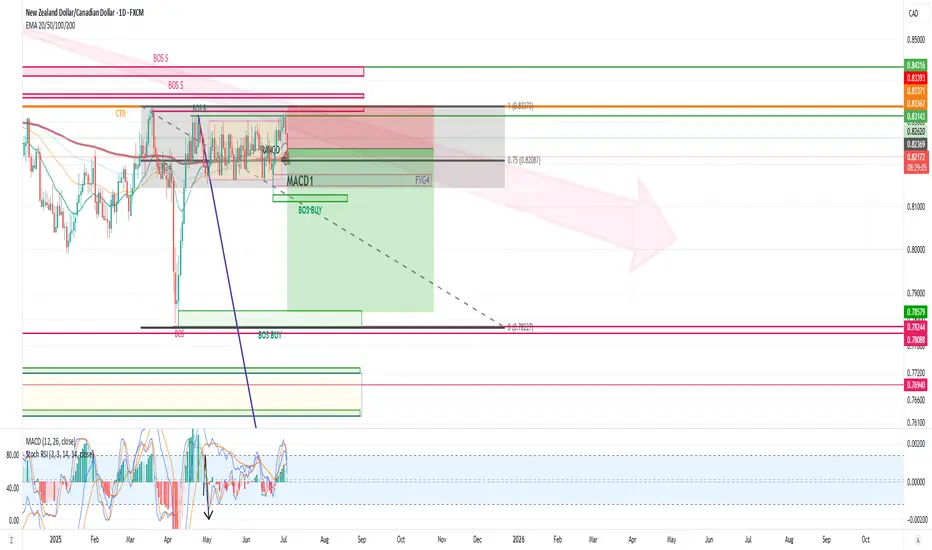
NZDCAD SHORT Market structure bearish on HTFs DH
Entry at both Daily and Weekly AOi
Weekly Rejection at AOi
Daily Rejection at AOi
Previous Structure point Daily
Around Psychological Level 0.82500
H4 EMA retest
H4 Candlestick rejection
Rejection from Previous structure
Levels 3.29
Entry 100%
REMEMBER : Trading is a Game Of Probability
: Manage Your Risk
: Be Patient
: Every Moment Is Unique
: Rinse, Wash, Repeat!
: Christ is King.

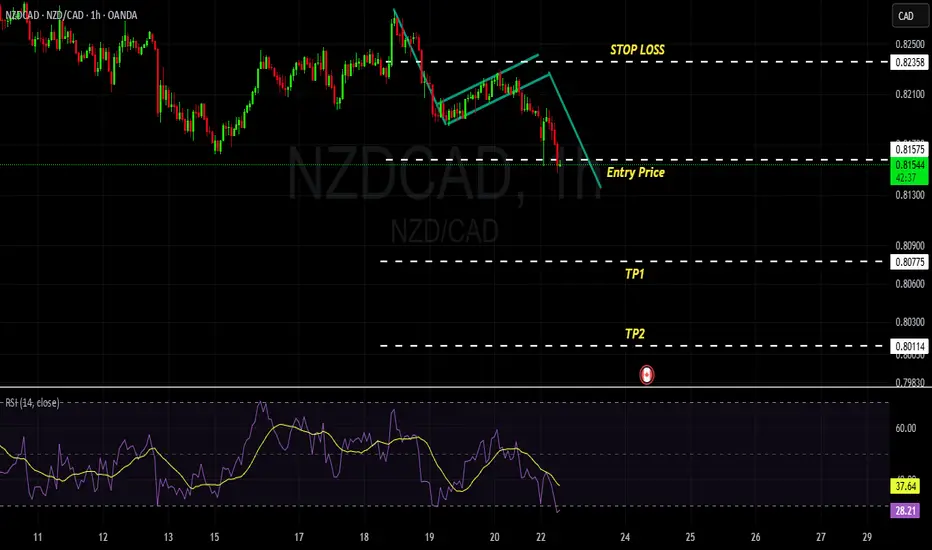
potential short setup on NZD/CAD🧠 Timeframe Sentiment Overview
Weekly (W): Bullish
Daily (D): Bullish
12H, 6H, 4H: Bearish
Bias: Weak bearish retracement inside HTF bullish trend. Caution advised—likely a counter-trend play or short-term pullback trade.
📉 Market Structure Analysis
Bearish BOS recently occurred on 4H with a sharp drop.
Price is now forming a potential lower high at previous support flipped resistance (around 0.82400–0.82550), shown in the red box.
Red arrow forecasts a continuation lower if price respects the short-term supply zone.
📊 EMA Confluence
Price is currently below both the 50 EMA (blue) and 200 EMA (red) → indicates a bearish short-term trend.
EMAs act as dynamic resistance in the supply zone.
🟥 Short Trade Setup
Entry Zone: Pullback into 0.82400–0.82577 (marked supply zone).
Stop Loss: Just above the red zone at ~0.82638.
Take Profit (TP): Weekly AOI at ~0.81680–0.81770, previous demand + liquidity zone.
Risk-Reward Ratio: Approximately 2:1 or better.
🔁 Strategy Notes
Since HTF is bullish (W + D), this is a counter-trend move, so confirmation (e.g. on 1H or 15m) is important.
Text on chart suggests waiting for 1H structure shift before executing the trade for better timing and lower risk.
✅ Confluences Supporting the Short
Clear 4H BOS and bearish momentum.
Bearish EMAs alignment (50 < 200).
Price entering previous support turned resistance.
Weekly AOI (target) is a high-probability demand zone.
Bearish momentum from 12H/6H/4H despite higher TF bullishness.
⚠️ Caution
Since W and D are bullish, price could bounce aggressively from the Weekly AOI.
Monitor LTF reaction closely for exit/reversal.

NZDCAD Sell ForecastNZDCAD New Forecast👨💻👨💻
This is my personal trade and not in anyway a mandatory setup.
Note:
Follow proper risk management rules. Never risk more then 2% of your total capital. Money management is the key of success in this business...... Set your own SL & TP.
Please support this idea with a Like and COMMENT if you find it useful click "follow" on our profile if you will like these type of trading ideas delivered straight to your email in the future.
Thanks for your continued support!! lemme know your thoughts in the comment sec..

Trade Idea: Buy NZD/CADWhy NZD?
✅ Strong Exports: NZ posted a $1.2B trade surplus (dairy & goods booming).
✅ Economy Improving: GDP growing at 1.4%, RBNZ supportive.
✅ USD Weakness: NZD rising as the US dollar loses steam.
Why CAD Could Struggle?
⚠️ Oil Dependency: If crude prices drop, CAD suffers.
⚠️ US Trade Risks: Trump tariffs could hurt Canada.
⚠️ High Unemployment: 7% and rising—pressures BoC.
Trade Setup
🔹 Buy NZD/CAD (expect NZD to rise vs CAD).
🔹 Watch: NZ trade data, oil prices, US-Canada trade news.
What Could Go Wrong?
❌ Oil spikes → CAD strengthens.
❌ US-NZ trade issues → NZD weakens.
Verdict: NZD looks stronger short-term—good odds for this trade. 🚀

NZDCAD: High-Conviction Long - Fundamental Strength & TechnicalThis analysis identifies an extremely high-conviction long opportunity in the NZDCAD currency pair 📈🇨🇦🇳🇿. Our conviction is primarily driven by a significant divergence in monetary policy outlooks and economic fundamentals between New Zealand and Canada. New Zealand's economic resilience, underpinned by robust dairy prices and a less dovish central bank stance, contrasts sharply with Canada's decelerating growth, rising unemployment, and a central bank poised for further rate cuts amidst trade policy uncertainties. Technically, NZDCAD appears poised for an upward move from key support levels, supported by bullish momentum indicators on the 4-hour chart. This is a medium-term trade expected to play out over days to weeks. 🗓️
I. Fundamental Rationale: Diverging Economic Trajectories 📊🌍
The core of this trade lies in the starkly different economic paths New Zealand and Canada are currently on, creating a compelling fundamental case for NZD appreciation against CAD:
Monetary Policy Divergence:
New Zealand (NZD): The Reserve Bank of New Zealand (RBNZ) maintained its Official Cash Rate (OCR) at 3.25% in June 2025. Analysts anticipate a hold at the upcoming July 9 meeting, balancing growth concerns with an "uncomfortably high near-term inflation outlook". This signals a less aggressive easing path. 🏦🇳🇿
Canada (CAD): In contrast, the Bank of Canada (BoC) held its policy rate steady at 2.75% in June 2025, after nine consecutive 0.25% cuts since June 2024. Market expectations for the upcoming July 30, 2025 meeting indicate a 33% chance of a further 25 basis point cut, with economists anticipating gradual cuts to 2.25% by mid-2025. This clear easing bias is driven by consistently below-target inflation (1.73% in May 2025). 📉🇨🇦
Impact: This creates a clear and widening interest rate differential fundamentally favoring the NZD. 💰
Inflation Outlook:
New Zealand: Annual inflation accelerated to 2.5% in Q1 2025, exceeding market expectations and marking the highest rate since June 2024. This reinforces the RBNZ's cautious stance. ⬆️
Canada: Canada's CPI registered 1.73% in May 2025, notably below the BoC's 2.0% target, providing ample justification for further monetary easing. ⬇️
Economic Performance & Labor Market:
New Zealand: GDP is projected to grow by 1.9% in 2025. The unemployment rate remained unchanged at 5.1% in March 2025, with average hourly earnings increasing by 4.5% annually. 💼✨
Canada: Real GDP contracted by 0.1% in April 2025, with a flash estimate pointing to another 0.1% decline in May, implying an annualized loss of 0.3% in Q2 2025. The unemployment rate rose to 7.0% in May 2025, its highest since September 2016 (excluding pandemic years). 📉🏭
Impact: New Zealand demonstrates greater economic resilience and a more stable labor market. 💪
Commodity & Trade Dynamics:
New Zealand: Benefits significantly from surging dairy prices, its top export commodity, which saw a substantial 10% increase in Q1 2025, with Fonterra forecasting record milk prices and production volumes. This contributed to a robust monthly trade surplus of $1.2 billion in May 2025. 🥛🧀💰
Canada: While the CAD maintains a strong positive correlation with oil prices, energy exports decreased by 5.6% in May, with crude oil exports falling 4.0%. Furthermore, Canadian exports to the US have declined for four consecutive months due to ongoing US tariffs. 🛢️📉
Impact: Strong commodity tailwinds and a healthy trade surplus for NZD, versus tariff-induced headwinds and declining energy exports for CAD. 🌬️
Yield Differential: The New Zealand 10-year government bond yield (4.57% as of June 30, 2025) is notably higher than Canada's (3.38% as of July 3, 2025). This provides a positive carry for holding NZD over CAD. 📊
II. Technical Rationale: Chart Insights (4-Hour Timeframe) 📈🔍
The technical picture on the 4-hour chart supports a bullish reversal from current levels, complementing the fundamental outlook:
Current Price Action & Long-Term Trend: NZDCAD is currently approximately 0.8277 (as of July 1, 2025). While short-term analyses may show a "sharp bearish trend," the pair is described as "trading in an uptrend and currently is in a correction phase" as it approaches a key support area. The 1-month change for NZDCAD is +0.13%, and year-to-date is +2.45%, indicating a longer-term bullish bias despite recent fluctuations. This corrective dip presents a favorable entry point. 📉➡️📈
Key Support & Resistance Levels:
Entry Point (0.8270) is strategically chosen near the immediate support cluster, specifically around the Pivot Point 1st Support of 0.8276 and an identified buying opportunity zone around 0.82700. ✅
Take Profit (TP) of 0.8350 is positioned just below the Pivot Point 3rd Level Resistance of 0.8356. 🎯
Stop Loss (SL) of 0.8220) is carefully placed below the key support levels of 0.8240 (Pivot Point 3rd Support) and 0.8236 (Pivot Point 3rd Support). A sustained break below this level would invalidate the bullish thesis. 🛑
Momentum Indicators:
RSI (14): The 14-day RSI for NZDCAD is around 41.78 to 54.33, suggesting a neutral to slightly bullish sentiment, with room for upward movement. 📊
MACD (12, 26, 9): A "bullish divergence" has been identified on the hourly timeframe, often signaling a return of buying interest. The MACD line is also observed to be slightly above its signal line, hinting at a potential bullish crossover. ⬆️
Moving Averages: The 50-day Simple Moving Average (SMA) is positioned slightly above the 200-day Exponential Moving Average (EMA). This configuration suggests a potential bullish crossover of longer-term moving averages, generally considered a positive long-term signal. 📈
III. Trade Setup: 📋✨
Currency Pair: NZDCAD 🇳🇿🇨🇦
Direction: Long (Buy) ⬆️
Entry Point: 0.8270
Take Profit (TP): 0.8350
Stop Loss (SL): 0.8220
Calculated Risk (in pips): 50 pips
Calculated Reward (in pips): 80 pips
Risk-Reward Ratio: Approximately 1.6:1 (A favorable ratio for a high-probability setup!) ✅
Key Considerations: Always adhere to strict risk management principles, risking no more than 1-2% of your total trading capital on this single trade. Be mindful of potential volatility around upcoming high-impact economic events in July, particularly the RBNZ and Bank of Canada interest rate decisions, and inflation data. 🗓️🔔

NZDCAD: Market of Buyers
Our strategy, polished by years of trial and error has helped us identify what seems to be a great trading opportunity and we are here to share it with you as the time is ripe for us to buy NZDCAD.
Disclosure: I am part of Trade Nation's Influencer program and receive a monthly fee for using their TradingView charts in my analysis.
❤️ Please, support our work with like & comment! ❤️

NZDCAD BearishMarket is making series of LH and LL, it has no divergence and we anticipate the market to reach TP1 and TP2 in continuation of Bear Trend. Market has broken the resistance level of 0.81613 with momentum candle which is a good indication of bearish trend.
NZDCAD at Resistance: Will the Bearish Pattern Repeat?NZDCAD at Resistance: Will the Bearish Pattern Repeat?
NZDCAD has faced a strong resistance zone, and it shows no signs of a clear direction.
Looking to the left side of the chart, we can observe that despite occasional upward movements, the pair has repeatedly followed a similar bearish pattern.
This repeated behavior suggests that the current setup may once again lead to a downside move.
If history repeats itself, NZDCAD could initiate another bearish wave from this zone, potentially targeting the 0.8300 and 0.8280 levels.
You may find more details in the chart!
Thank you and Good Luck!
PS: Please support with a like or comment if you find this analysis useful for your trading day
Disclosure: I am part of Trade Nation's Influencer program and receive a monthly fee for using their TradingView charts in my analysis.

NZDCAD reached key resistance: Rebound to 0.82450 likelyPrice on NZDCAD has reached a pretty significant resistance level, that has been a key turning point in the past, with several strong reversals from the area. So naturally, I’ve been watching to see how price reacts here again.
We can already see early signs of rejection, so I will monitor this pair and I’ll be looking for short setups from the zone again.
🟥 My sell idea is based on the expectation that this resistance will hold. I would be targeting a move down toward the 0.82450 level , which I feel is a realistic target before any reversal could take from the gains, especially if price respects this structure continuously.
But if price breaks above and starts holding strong above the zone, then I’ll back off the bearish bias and reassess, and I’d consider the bearish idea invalidated, with potential for further upside.
Just sharing how I see the chart right now, not financial advice

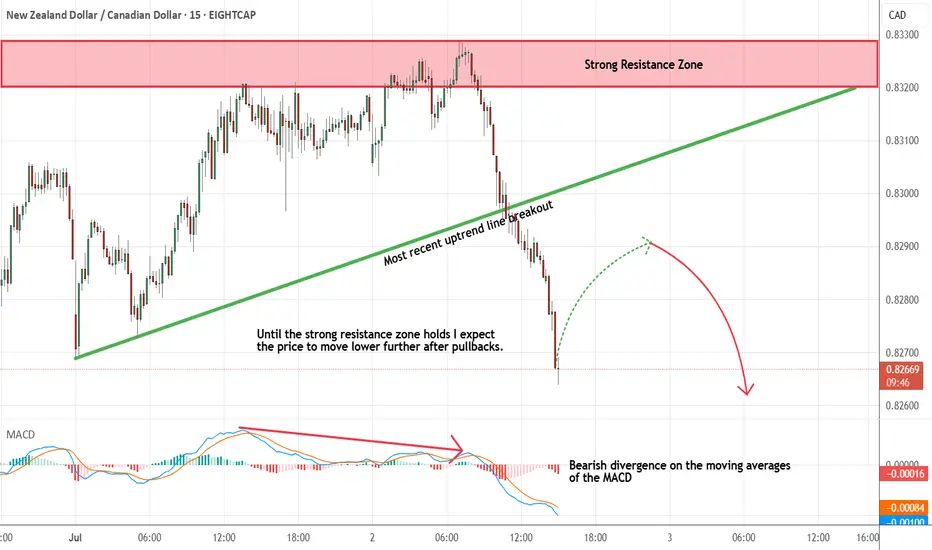
NZDCAD - Looking To Sell Pullbacks In The Short TermM15 - Bearish divergence followed by the most recent uptrend line breakout.
No opposite signs.
Expecting pullbacks and bearish continuation until the strong resistance zone holds.
If you enjoy this idea, don’t forget to LIKE 👍, FOLLOW ✅, SHARE 🙌, and COMMENT ✍! Drop your thoughts and charts below to keep the discussion going. Your support helps keep this content free and reach more people! 🚀
--------------------------------------------------------------------------------------------------------------------
NZD-CAD Swing Short! Sell!
Hello,Traders!
NZD-CAD keeps growing
In an uptrend but the pair
Will soon retest a wide
Horizontal resistance level
Around 0.8350 so after the
Retest we will be expecting
A bearish pullback
Sell!
Comment and subscribe to help us grow!
Check out other forecasts below too!
Disclosure: I am part of Trade Nation's Influencer program and receive a monthly fee for using their TradingView charts in my analysis.

NZDCAD LONGMarket structure bullish on HTFs DW
Entry at Daily and Weekly AOi
Weekly Rejection at AOi
Weekly EMA retest
Previous Weekly Structure Point
Daily Rejection At AOi
Previous Daily Structure Point
Around Psychological Level 0.82500
H4 Candlestick rejection
Levels 4.08
Entry 105%
REMEMBER : Trading is a Game Of Probability
: Manage Your Risk
: Be Patient
: Every Moment Is Unique
: Rinse, Wash, Repeat!
: Christ is King.

NZDCAD Potential UpsidesHey Traders, in today's trading session we are monitoring NZDCAD for a buying opportunity around 0.82700 zone, NZDCAD is trading in an uptrend and currently is in a correction phase in which it is approaching the trend at 0.82700 support and resistance area.
Trade safe, Joe.

GBPCAD 10 weeks of Consolidation/buildup ready for breakout ?GBPCAD has nearly 10 weeks consolidated at the box and each week got rejected from the resistance. The wig of the candle can tell you the story of rejection and now last week this wig has been overcome by strong bullish solid candle and high chances of breakout possible. let us see...

BANK JOB: NZD/CAD LOOT GRAB (Swing Heist Plan) 🏦 "Market Heist: NZD/CAD Long Before Trap Closes! 💰
🦹♂️ Attention All Market Thieves!
(Hola! Oi! Salut! Hallo! Ahlan!) 🎭💸
🔥 Thief Trading Intel Confirmed!
The NZD/CAD "Kiwi vs Loonie" vault is primed for cracking! Our bullish heist blueprint targets the red zone - but we escape before the bears set their trap!
🔓 ENTRY: CRACKING THE SAFE
"Resistance wall at 0.83150 is the vault door!"
✔ Option 1: Buy Stop above resistance (breakout play)
✔ Option 2: Buy Limit at swing low (15m/30m pullback)
🔔 Pro Tip: Set breakout alerts - don't miss the heist!
🚨 STOP LOSS: POLICE EVASION PLAN
📍 Thief SL: 0.82200 (below 4H swing low & MA)
⚠️ Warning: No SL before breakout! You'll trigger the alarms!
💎 TARGET: ESCAPE WITH THE LOOT
🎯 Primary Take: 0.84400
💰 Scalpers: Long-only! Trail your SL like a getaway car!
📊 MARKET CONDITIONS
🐂 Bullish Trend (but overbought - time it right!)
🔍 Key Intel Needed: COT reports, macro data, sentiment
🌐 Full Briefing: Check bi0 linkss 👉🔗
🚦 RISK MANAGEMENT PROTOCOLS
• ❌ Avoid news event heists
• 🔒 Always use trailing stops
• 💣 Position size = explosive potential
🦾 SUPPORT THE SYNDICATE
💥 SMASH THAT BOOST BUTTON!
💬 Comment your heist results below!
🔔 Next job coming soon - stay tuned!
🤑 Remember thieves: Book profits before the cops arrive!

This currency is likely to go down.It is moving within a very strong support resistance zone so we can expect it to sell again.

SHORT ON NZD/CADNzd/cad has given us a double top with a confirmed change of character (choc)
to the downside.
I am waiting for price to reach into supply sweeping liquidity before taking a sell to the next demand level looking to catch 100-150 pips.

Is the NZDCAD uptrend still strong?NZDCAD has broken the trendline structure and is heading towards the resistance at 0.83500
0.827 has become a confluence of support and trendline. The pair is looking for more buying momentum at the support zone.
2 zones to watch are 0.827 and 0.823
If the 0.823 zone is broken, the uptrend is broken and the market turns to a downtrend. The target of the downtrend and the market finds the bottom of last month around 0.812.
Confirm SELL signal when breaking 0.823

NZDCAD SHORT Market structure bearish on HTFs DH
Entry at both Weekly and Daily AOi
Weekly Rejection at AOi
Weekly EMA Retest
Daily Rejection at AOi
Daily EMA retest
Previous Structure point Daily
Around Psychological Level 0.82500
H4 EMA retest
H4 Candlestick rejection
Rejection from Previous structure
Levels 4.26
Entry 110%
REMEMBER : Trading is a Game Of Probability
: Manage Your Risk
: Be Patient
: Every Moment Is Unique
: Rinse, Wash, Repeat!
: Christ is King.

NZD_CAD SHORT FROM RESISTANCE|
✅NZD_CAD will soon retest a key resistance level of 0.8320
So I think that the pair will make a pullback
And go down to retest the demand level below at 0.8267
SHORT🔥
✅Like and subscribe to never miss a new idea!✅
Disclosure: I am part of Trade Nation's Influencer program and receive a monthly fee for using their TradingView charts in my analysis.
